The Optical Counterpart of the Isolated Neutron Star RX J1605.3+3249
Abstract
We have detected the optical counterpart to the nearby isolated neutron star RX J1605.3+3249 using observations from the Space Telescope Imaging Spectrometer aboard the Hubble Space Telescope. The counterpart, with mag and very blue colors, lies close to the ROSAT HRI error circle and within the Chandra error circle. The spectrum is consistent with a Rayleigh-Jeans tail whose emission is a factor of above the extrapolation of the X-ray blackbody, and the source has an unabsorbed X-ray-to-optical flux ratio of , similar to that of other isolated neutron stars. This confirms the classification of RX J1605.3+3249 as a neutron star.
1 Introduction
Thanks to ROSAT, a half dozen nearby neutron stars that emit no detectable radio emission have been identified (see Treves et al. 2000 for a comprehensive review). These objects have been eagerly studied using facilities such as the XMM-Newton Observatory, the Chandra X-ray Observatory, the Hubble Space Telescope (HST), Keck and the Very Large Telescope with the hope of determining the physical parameters, in particular radius and temperature, and to compare these to models of neutron stars. Independently, by their sheer proximity these objects play a pivotal role in assessing the neutron star demographics in the Galaxy. These two considerations highlight the virtue of detailed studies of nearby neutron stars.
RX J1605.3+3249 was identified in the ROSAT All-Sky Survey by Motch et al. (1999). The X-ray spectrum is well fitted by a blackbody with eV and low interstellar column density, cm-2, and is quite similar to those of well studied nearby neutron stars such as RX J1856.53754 and RX J0720.43125. Motch et al. (1999) obtained deep (mag and mag) images from the Keck telescope. Only one object (star C) was found within the High Resolution Imager (HRI) circle (we believe that the uncertainty of the HRI position was underestimated; see § 2.2). Optical spectroscopic observations carried out at the Canada-France-Hawaii Telescope (CFHT) showed that star C was a distant late-type M dwarf.
However, the soft spectrum and the stable X-ray emission are better accounted for by a model in which RX J1605.3+3249 is an isolated neutron star. If so, the optical counterpart would be below (or perhaps just at) the limit of the Keck observations. As a part of our investigation of nearby neutron stars with HST we undertook deep observations of this field. In this Letter we report the discovery of a faint blue optical star which we identify with the optical counterpart of RX J1605.3+3249. Our discovery confirms that RX J1605.3+3249 is a nearby neutron star.
2 Observations & Data Reduction
| Telescope | Instrument | Date | Exposure | Band |
|---|---|---|---|---|
| (UT) | (s) | |||
| Keck II | LRIS | 1998-Aug-24 | 1800 | R |
| HST | STIS | 2001-Jul-21 | 2700 | 50CCD |
| HST | STIS | 2001-Jul-21 | 5360 | F28X50LP |
2.1 Hubble Space Telescope Observations
We observed RX J1605.3+3249 with the Space Telescope Imaging Spectrograph (STIS) aboard HST in two modes: unfiltered CCD (50CCD aperture) and a longpass filter that transmitted photons longward of Å; see Table 1. For each mode, the individual images were drizzled (Fruchter & Hook 2002) onto a single image with a pixel scale of 0.5. Thus final images had pixels.
2.2 Keck Observations
For astrometric purposes we obtained imaging data from the Low-Resolution Imaging Spectrometer (LRIS; Oke et al. 1995) on the Keck II telescope; see Table 1. These images were reduced in a standard manner using tasks in MIDAS: bias subtraction, flat-fielding, and stacking of the exposures. We show the LRIS image in Figure 1.
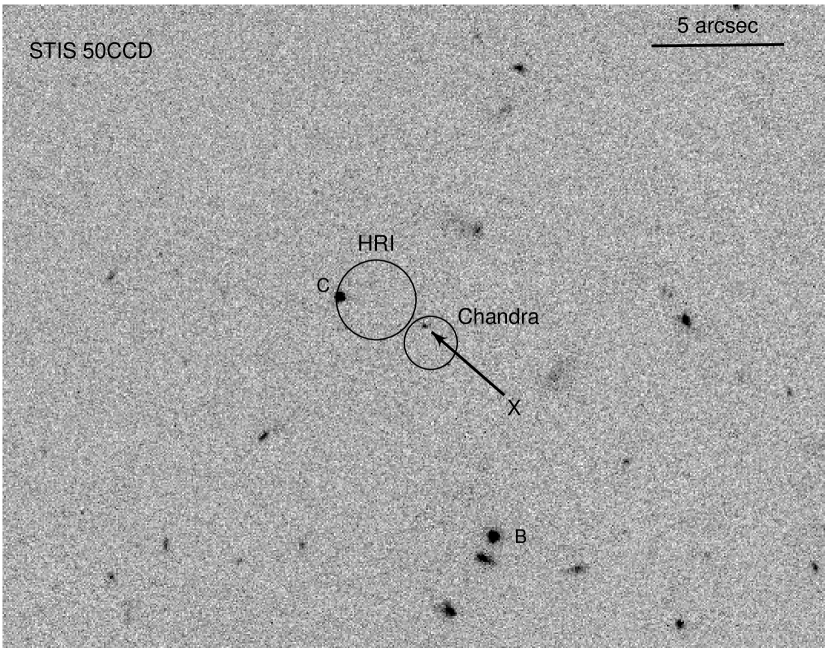
After correcting the stellar positions measured in a 30-s LRIS image for geometric distortions111See http://alamoana.keck.hawaii.edu/inst/lris/coordinates.html., we fit for plate-scale, zero-point, and rotation using 20 unsaturated stars from the latest version of the Guide Star Catalog (GSC-2.2)222See http://www-gsss.stsci.edu/support/data_access.htm., obtaining rms residuals of in each coordinate (in what follows, astrometric uncertainties refer to rms values in each coordinate unless otherwise specified). We then determined the astrometric solution (plate-scale, zero-point, and rotation) of the full 30-minute LRIS image by using 24 stars common to that and the 30-s image, getting rms residuals of . Finally, we used 21 stars on the deep LRIS image to determine the plate-scale, zero-point, and rotation of the drizzled STIS 50CCD image (shown in Fig. 2), getting rms residuals of . The final uncertainty to which our STIS coordinates are on the ICRS is dominated by the uncertainty of the GSC-2.2333See http://www-gsss.stsci.edu/gsc/gsc2/calibrations/astrometry/astrometry.htm#method..
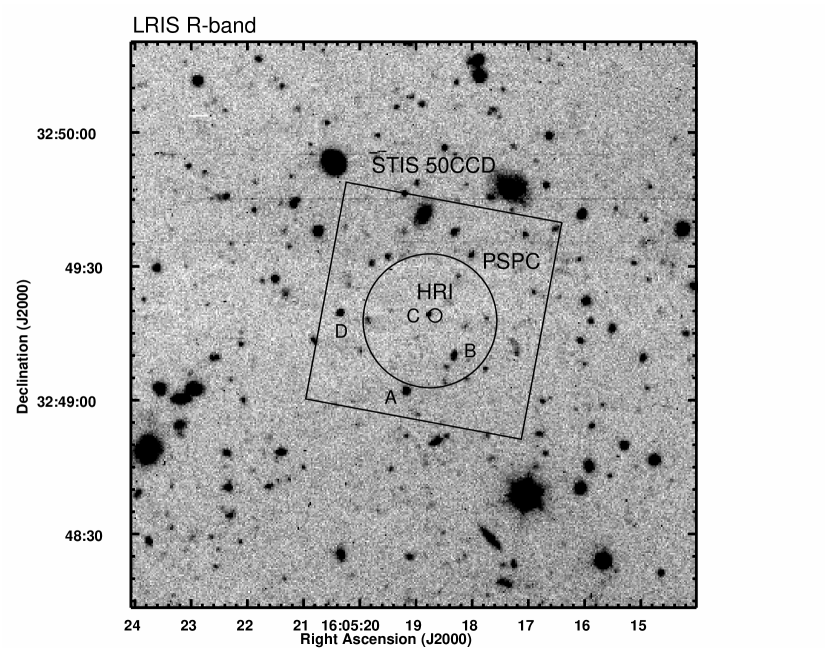
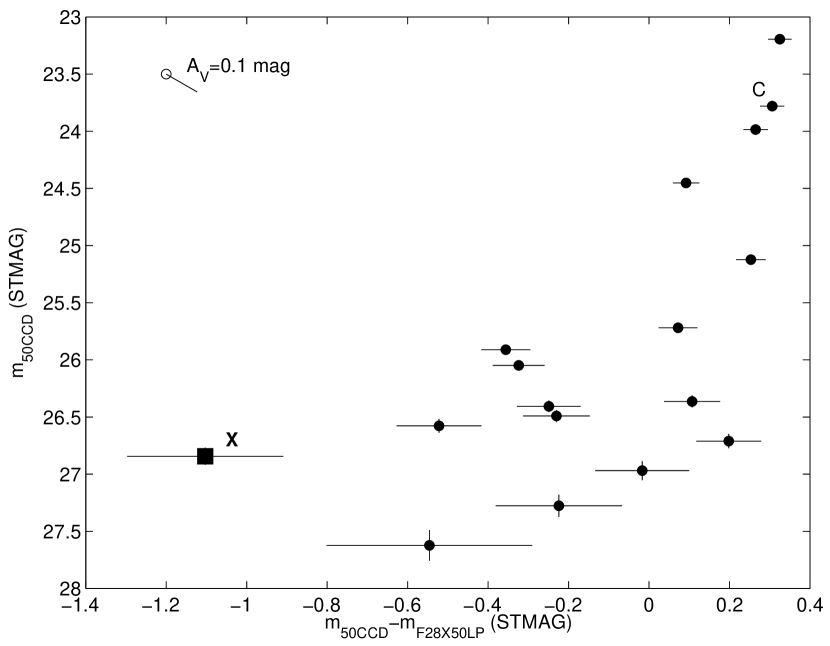
We inspected all point sources on the STIS images that were within the PSPC error circle and found a very blue source. As can be seen from Figure 3 this is the bluest source in the PSPC error circle. The source, hereafter “X”, is located at (J2000) , with uncertainties of about , and lies from the HRI position from Motch et al. (1999), outside the nominal 90% error circle.
However, we have found a problem in comparing positions referenced to the USNO-A2.0 (Monet 1998), like the HRI position, and those referenced to the GSC-2.2/ICRS (our optical data). In this field, there appears to be a systematic shift between the GSC-2.2 and the USNO-A2.0 of (the shift in Right Ascension is a negligible ). If we correct the HRI position to the GSC-2.2 reference frame, we find the new position to be (J2000) . With this position, the error circle appears to be located properly with respect to star C, comparing with Fig. 4 of Motch et al. (1999).
Even with the updated position, X is slightly outside the 90% HRI error circle444X is within the error circle of the position obtained from a preliminary analysis of XMM data; van Kerkwijk et al., in preparation.. We have two possible explanations for this. First, RX J1605.3+3249 may have non-negligible proper motion, such as that seen for RX J1856.53754 (Walter 2001). In this case the offset between the HRI position (epoch 1998.3) and the STIS image (2001.6) could be real. However, the LRIS data are not of sufficient quality to detect X with any confidence, so we will have to wait for additional data. Second, we note that the quoted uncertainty of the HRI position may be underestimated: Motch et al. (1999) used 6 reference sources for the boresight corrections and claim an uncertainty of with no contribution from systematic effects. In comparison, Hasinger et al. (1998) use 32 sources and get typical HRI uncertainties of that include a systematic error to achieve good X-ray-to-optical matches.
In either case, the blue color of source X is similar to those of the counterparts of other isolated neutron stars (e.g. RX J1856.53754 and RX J0720.43125; Walter & Matthews 1997; van Kerkwijk & Kulkarni 2001b; Motch & Haberl 1998; Kulkarni & van Kerkwijk 1998). Thus we consider it likely that X is the counterpart of RX J1605.3+3249.
2.3 X-ray
While our identification based on color and position is plausible, the uncertainty in the ROSAT HRI position prevents us from being sure about the association (pulsations or a common proper motion would be definitive measurements). Fortunately, the availability of archival data from the Chandra X-ray Observatory offered us to opportunity to decrease the chance coincidence probability by a factor of 10. The Chandra observation (ObsID 2791) had a duration of 20-ks, and RX J1605.3+3249 was at the aim-point of the ACIS-I CCD array. Using standard processing steps555http://asc.harvard.edu/cal/ASPECT/fix_offset/fix_offset.cgi. we corrected for a systematic astrometric error of and . As a cross-check, we compared the positions of other X-ray sources to GSC-2.2 stars (which, since we used the GSC-2.2 as the reference for the optical astrometry, ensures that they are on the same system as our HST data) and found that the coordinates match to better than 0.5 arcsecond.
We then measured the centroid of RX J1605.3+3249 (with a count-rate of , RX J1605.3+3249 is somewhat affected by photon pileup, but this should not affect the centroid) to be (J2000) , . We estimate a final 90% confidence radius of the X-ray position with respect to the STIS image of . As can be seen in Fig. 2, source X is well within this radius, lending credence to our identification.
3 Analysis & Discussion
We rely on the spectral fits to the ROSAT PSPC data presented in Motch et al. (1999): eV, , and , where pc is the distance and the normalization assumes in the PSPC. The absorption column density implies an extinction of mag, (Predehl & Schmitt 1995) — while this value is uncertain, it is low enough to not make a large difference. The total Galactic hydrogen column density is (determined by COLDEN666See http://asc.harvard.edu/toolkit/colden.jsp.; Dickey & Lockman 1990) so that the maximum extinction is mag. This agrees with the extinction estimated from infrared dust emission (Schlegel, Finkbeiner, & Davis 1998), and confirms that the total extinction to RX J1605.3+3249 is low.
Within a -radius aperture, we measure magnitudes of mag and mag for source X in the STMAG system. To correct the photometry to a nominal infinite aperture, we follow Kaplan, Kulkarni, & van Kerkwijk (2002a) and Kaplan et al. (2003). As X is bluer than all of the stars in the image, we used the bluest of the available aperture corrections: 0.183 mag at radius for 50CCD and 0.214 mag at radius for F28X50LP (T. Brown 2002, private communication). This then gives corrected magnitudes of mag and mag, where we have incorporated a 0.02 mag uncertainty from the aperture corrections.
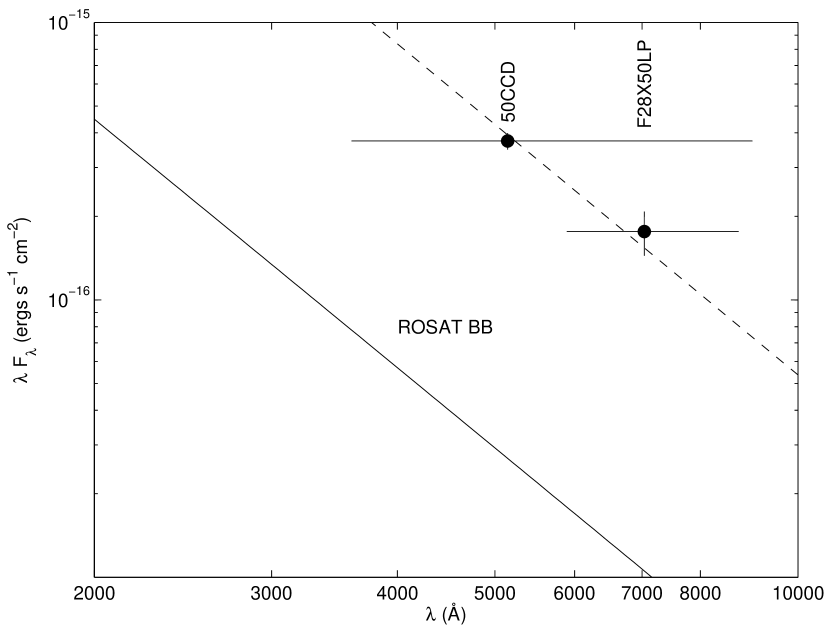
Since the STIS bandpasses are so wide we must use the shapes of the bandpasses to convert the measured magnitudes into fluxes. Following van Kerkwijk & Kulkarni (2001b), we find effective wavelengths of 5148 Å and 7137 Å and effective extinctions of 1.56 and 0.79 for 50CCD and F28X50LP, respectively. With these wavelengths, we can now apply the standard STMAG conversion of .
We plot the spectral energy distribution of source X in Figure 4, assuming a blackbody spectrum in the X-ray regime777This blackbody is likely a simplification of a more realistic atmosphere model, but as yet such models have been unsuccessful in fitting sources like RX J1856.53754 and RX J0720.43125.. As one can see, the optical photometry appear to follow a power-law with spectral index (), appropriate for a Rayleigh-Jeans tail and similar to that of other isolated neutron stars (van Kerkwijk & Kulkarni 2001b; Kaplan et al. 2003). We also plot in Figure 4 the extrapolation of the best-fit ROSAT PSPC blackbody. The Rayleigh-Jeans fit to the STIS data has a normalization that is a factor of above the extrapolation of the blackbody. Other power-law indices are possible, as found for RX J0720.43125 (Kaplan et al. 2003), but we do not believe that the current data warrant a full fit. The unabsorbed bolometric X-ray-to-optical flux ratio is (assuming that the X-ray spectrum is well described by a blackbody).
The blueness of source X and its X-ray-to-optical flux ratio, taken together with the X-ray spectrum of RX J1605.3+3249, virtually guarantee that X is the optical counterpart of RX J1605.3+3249 and that RX J1605.3+3249 is an isolated neutron star. It then joins 3 other sources (RX J1856.53754, RX J0720.43125, and possibly RX J1308.6+2127) that have soft X-ray blackbodies, blue optical counterparts, and no other emission; see Table 3. RX J1605.3+3249 stands out from the other sources in Table 3 by virtue of its relatively large optical excess: the optical flux is a factor of 14 above the extrapolated X-ray flux, where for the other sources the ratio is closer to 6 (this is despite the fact that the X-ray-to-optical flux ratio for RX J1605.3+3249 is within the range of the other sources). This can also be seen from the ROSAT data in Schwope et al. (1999), where RX J1605.3+3249 has a factor of 2 smaller count rate than RX J0720.43125 despite being hotter and having a comparable optical magnitude. There are two possibilities to explain the large excess of RX J1605.3+3249: either its X-ray emission is suppressed relative to the optical, or the optical emission is enhanced.
The first scenario implies that the blackbody radius ( km, where the distance of pc is predicted based on the optical flux; see Kaplan, van Kerkwijk, & Anderson 2002b) is significantly smaller than those of the other sources (typically 6 km). If the blackbody radius can be interpreted as the radius of a hot polar cap, perhaps RX J1605.3+3249 has a different magnetic field configuration leading to a smaller cap size, or RX J1605.3+3249 is in an orientation where only half of the cap is visible (although this is difficult when relativistic beaming is taken into account; Psaltis, Özel, & DeDeo 2000).
| Source | Period | aaTemperature of the best-fitting blackbody. | bb-band Vega magnitude, either measured or interpolated. | ccAbsorption-corrected bolometric X-ray-to-optical flux ratio, assuming that the X-ray emission is a blackbody. The -band flux is computed according to , following Bessell, Castelli, & Plez (1998). | OpticalddThe ratio of the observed -band flux to the extrapolated X-ray blackbody flux at 5500 Å. | References |
|---|---|---|---|---|---|---|
| (s) | (eV) | (mag) | Excess | |||
| RX J1856.53754 | 61 | 25.8 | 4.4 | 6 | 1,2,3,4 | |
| RX J0720.43125 | 8.39 | 81 | 26.8 | 4.6 | 6 | 5,6 |
| RX J1308.6+2127 | 10.31 | 91 | 28.7 | 5.0 | 5 | 7,8,9,10 |
| RX J1605.3+3249 | 92 | 27.1 | 4.4 | 14 | 11,12 |
References. — 1: Ransom, Gaensler, & Slane (2002); 2: Burwitz et al. (2002); 3: Drake et al. (2002); 4: van Kerkwijk & Kulkarni (2001b); 5: Haberl et al. (1997); 6: Kaplan et al. (2003); 7: Schwope et al. (1999); 8: Hambaryan et al. (2002); 9: Kaplan et al. (2002a); 10: Haberl (2003); 11: Motch et al. (1999); 12: this work.
The second scenario could occur if there were a significant contribution to the optical emission from non-thermal emission. Non-thermal emission could arise if there were a substantial spin-down luminosity, (such as that seen for PSR B0656+14; Koptsevich et al. 2001). In this case, the high optical excess could indicate a large for RX J1605.3+3249. While we cannot constrain the non-thermal emission from the current photometry, it may be difficult to reproduce the thermal-like spectrum observed in Figure 4 and to invoke significant non-thermal flux. One could appeal to light-element atmospheres for RX J1605.3+3249, as they have high optical excesses over blackbodies (Pavlov et al. 1996). However, these excesses are far too high (factors of 50–100, instead of 14) to fit our photometry, allowing us to reject such models.
Future observations, such as higher-precision X-ray spectroscopy from Chandra and XMM (being analyzed), additional optical photometry, and improved X-ray timing (in order to determine and eventually and the magnetic field ), should help to settle these issues. We are also searching for an H nebula around RX J1605.3+3249 (e.g., van Kerkwijk & Kulkarni 2001a). A single definitive measurement would be the distance, which would determine the areas of the X-ray and optical emission regions, but a parallax measurement with HST would require a significant investment of observing time.
References
- Bessell et al. (1998) Bessell, M. S., Castelli, F., & Plez, B. 1998, A&A, 333, 231
- Burwitz et al. (2002) Burwitz, V., Haberl, F., Neuhäuser, R., Predehl, P., Trümper, J., & Zavlin, V. E. 2002, A&A, in press (astro-ph/0211536)
- Dickey & Lockman (1990) Dickey, J. M. & Lockman, F. J. 1990, ARA&A, 28, 215
- Drake et al. (2002) Drake, J. J., et al. 2002, ApJ, 572, 996
- Fruchter & Hook (2002) Fruchter, A. S. & Hook, R. N. 2002, PASP, 114, 144
- Haberl (2003) Haberl, F. 2003, in High Energy Studies of Supernova Remnants and Neutron Stars: 34th COSPAR Scientific Assembly, ed. W. Becker & W. Hermsen, (astro-ph/0302540)
- Haberl et al. (1997) Haberl, F., Motch, C., Buckley, D. A. H., Zickgraf, F.-J., & Pietsch, W. 1997, A&A, 326, 662
- Hambaryan et al. (2002) Hambaryan, V., Hasinger, G., Schwope, A. D., & Schulz, N. S. 2002, A&A, 381, 98
- Hasinger et al. (1998) Hasinger, G., Burg, R., Giacconi, R., Schmidt, M., Trümper, J., & Zamorani, G. 1998, A&A, 329, 482
- Kaplan et al. (2002a) Kaplan, D. L., Kulkarni, S. R., & van Kerkwijk, M. H. 2002a, ApJ, 579, L29
- Kaplan et al. (2002b) Kaplan, D. L., van Kerkwijk, M. H., & Anderson, J. 2002b, ApJ, 571, 447
- Kaplan et al. (2003) Kaplan, D. L., van Kerkwijk, M. H., Marshall, H. L., Jacoby, B. A., Kulkarni, S. R., & Frail, D. A. 2003, ApJ, in press (astro-ph/0303126)
- Koptsevich et al. (2001) Koptsevich, A. B., Pavlov, G. G., Zharikov, S. V., Sokolov, V. V., Shibanov, Y. A., & Kurt, V. G. 2001, A&A, 370, 1004
- Kulkarni & van Kerkwijk (1998) Kulkarni, S. R. & van Kerkwijk, M. H. 1998, ApJ, 507, L49
- Monet (1998) Monet, D. E. A. 1998, in The PMM USNO-A2.0 Catalog (U.S. Naval Observatory, Washington DC)
- Motch & Haberl (1998) Motch, C. & Haberl, F. 1998, A&A, 333, L59
- Motch et al. (1999) Motch, C., Haberl, F., Zickgraf, F.-J., Hasinger, G., & Schwope, A. D. 1999, A&A, 351, 177
- Oke et al. (1995) Oke, J. B., et al. 1995, PASP, 107, 375
- Pavlov et al. (1996) Pavlov, G. G., Zavlin, V. E., Trümper, J., & Neuhäuser, R. 1996, ApJ, 472, L33
- Predehl & Schmitt (1995) Predehl, P. & Schmitt, J. H. M. M. 1995, A&A, 293, 889
- Psaltis et al. (2000) Psaltis, D., Özel, F., & DeDeo, S. 2000, ApJ, 544, 390
- Ransom et al. (2002) Ransom, S. M., Gaensler, B. M., & Slane, P. O. 2002, ApJ, 570, L75
- Schlegel et al. (1998) Schlegel, D. J., Finkbeiner, D. P., & Davis, M. 1998, ApJ, 500, 525
- Schwope et al. (1999) Schwope, A. D., Hasinger, G., Schwarz, R., Haberl, F., & Schmidt, M. 1999, A&A, 341, L51
- Treves et al. (2000) Treves, A., Turolla, R., Zane, S., & Colpi, M. 2000, PASP, 112, 297
- van Kerkwijk & Kulkarni (2001a) van Kerkwijk, M. H. & Kulkarni, S. R. 2001a, A&A, 380, 221
- van Kerkwijk & Kulkarni (2001b) —. 2001b, A&A, 378, 986
- Walter (2001) Walter, F. M. 2001, ApJ, 549, 433
- Walter & Matthews (1997) Walter, F. M. & Matthews, L. D. 1997, Nature, 389, 358