A View through Faraday’s fog:
Parsec scale rotation measures in AGN
Abstract
Rotation measure observations of 9 quasars, 4 BL Lacertae objects, and 3 radio galaxies are presented. The rest frame rotation measures in the cores of the quasars and the jets of the radio galaxy M87 are several thousand rad m-2. The BL Lacertae objects and the jets of the quasars have rest frame rotation measures of a few hundred rad m-2. A nuclear rotation measure of 500 rad m-2 in the rest frame is suggested as the dividing line between quasar and BL Lacertae objects. The substantial rotation measures of the BL Lacertae objects and quasars cast doubt on the previous polarization position angle investigations of these objects at frequencies of 15 GHz or less. BL Lacertae itself has a rotation measure that varies in time, similar to the behavior observed for the quasars 3C 273 and 3C 279. A simple model with magnetic fields of 40 G or less can account for the observed rotation measures.
1 Introduction
Polarization observations using Very Long Baseline Interferometry (VLBI) have been probing magnetic field orientations at high angular resolution for almost 20 years (Cotton et al., 1984). Details of magnetic vector orientation are required to understand the relativistic jets of AGN, but the presence of a magnetized plasma in the centers of these objects complicates the analysis. Faraday rotation (Faraday, 1845), or the rotation of the plane of polarization of an electromagnetic wave as it traverses a magnetized medium, changes the observed polarization orientation from that intrinsic to a source. The intrinsic polarization angle is related to the observed polarization angle by
| (1) |
where is the observed wavelength. The linear relationship to is the characteristic signature of Faraday rotation. The slope of the line is known as the Rotation Measure (RM) and depends linearly on the electron density , the net line of sight magnetic field , and path length through the plasma. Using units of cm-3, mG and parsecs the rotation measure is given by:
| (2) |
Simultaneous, multi-frequency observations allow the rotation measure to be determined, and the recovery of the intrinsic polarization orientation. Faraday rotation towards an extragalactic source was first observed by Cooper & Price (1962), who found a rotation measure of 60 rad m-2 towards the center of Centaurus A. Without knowledge of the rotation measure errors in the intrinsic polarization angle can be substantial. Rotation measures of 250 rad m-2 can change the intrinsic polarization angle by 25∘ at 8 GHz. Thus, parsec scale rotation measures are required if polarization observations are to yield the true magnetic vector orientation in the relativistic jets of AGN. Faraday rotation probes the density weighted magnetic field along the line of sight, so an added benefit is the ability to probe the physical conditions in the Faraday screen itself.
We present rotation measures for 16 quasars, radio galaxies, and BL Lacertae objects obtained with the Very Long Baseline Array (VLBA)111The National Radio Astronomy Observatory is operated by Associated Universities, Inc., under cooperative agreement with the National Science Foundation.. Observations and data reduction are described in §2. In §3 results for individual objects with maps of the rotation measure, magnetic vector orientation corrected for Faraday rotation, and spectral indices are shown. In §4 we discuss our results, which are followed by our conclusions. We assume H km s-1 Mpc-1, q0=0.5, and spectral index definition throughout.
2 Observations and Data Reduction
The observations, performed on 2000 June 27 (2000.40), were carried out at seven widely separated frequencies between 8.1 and 15.2 GHz using the 10 element VLBA. This 24 hour observation targeted the sources listed in Table 1. Prior to self-calibration all processing was performed in the Astronomical Image Processing System (AIPS; van Moorsel, Kemball, & Greisen, 1996). Amplitude calibration using APCAL was performed using the recorded system temperatures and gain tables. The task FRING was used on two minutes of data from 2200+420 to remove errors due to clock and correlator model inaccuracies. A global fringe fit was run on all the data to remove the remaining delay and rate errors. The RL delay offset was removed using the procedure CROSSPOL. A bandpass correction table was made with BPASS using 3C 279 as a bandpass calibrator. The data were then averaged in frequency across the bandwidths shown in Table 2.
Self-calibration was done using DIFMAP (Shepherd, 1997; Shepherd, Pearson & Taylor, 1994) and AIPS in combination. Polarization leakage of the antennas (D-terms) were determined using the AIPS task LPCAL. This calibration was performed twice, first using 0133476 with an accompanying CLEAN model for this polarized source. Plots of the real versus imaginary crosshand polarization data indicated that a satisfactory D-term solution was obtained. After this calibration was performed the radio galaxy 2021614 was found to be unpolarized. The D-terms were solved for again using 2021614 as an unpolarized calibrator as a consistency check. Both sources produced nearly identical corrections for the D-terms, and 2021614 was used as the final D-term calibrator.
Absolute electric vector position angle (EVPA) calibration was determined by using the EVPA’s of 0851202, 0923392, 1308326 and 2200420 listed in the VLA Monitoring Program222http://www.aoc.nrao.edu/smyers/calibration/ (Taylor & Myers, 2000). The EVPA calibration at 8 GHz was readily obtained from the polarization calibration website. The observations were interpolated in time as necessary. Polarization monitoring observations at 8 and 22 GHz were interpolated to produce position angles at 12 and 15 GHz. Figure 1 of Zavala & Taylor (2002) shows calibrated position angle results for these four calibrators with the associated VLA data from the website. As a further test of our EVPA calibration we examined the rotation measure of component C4 of 3C 279 after the EVPA calibration was completed. In Zavala & Taylor (2001) C4 was shown to have a relatively low RM and polarization angle at 8 GHz to at 15 GHz on 2000 January 27. After the EVPA calibration for this experiment was completed we measured C4 and the EVPA was 87∘ for all frequencies. Although C4 does vary its position angle and RM with time the agreement between the observations of 2000 January and 2000 July suggests that the polarization calibration was performed correctly.
To perform the rotation measure analysis data cubes in were constructed. This provides adequate short and long spacings in to properly recover RMs between 30000 rad m-2. The 12 and 15 GHz images used to produce the polarization angle maps were tapered to approximate the 8 GHz resolution, and a restoring beam matched to the 8 GHz beam was used.
3 Results
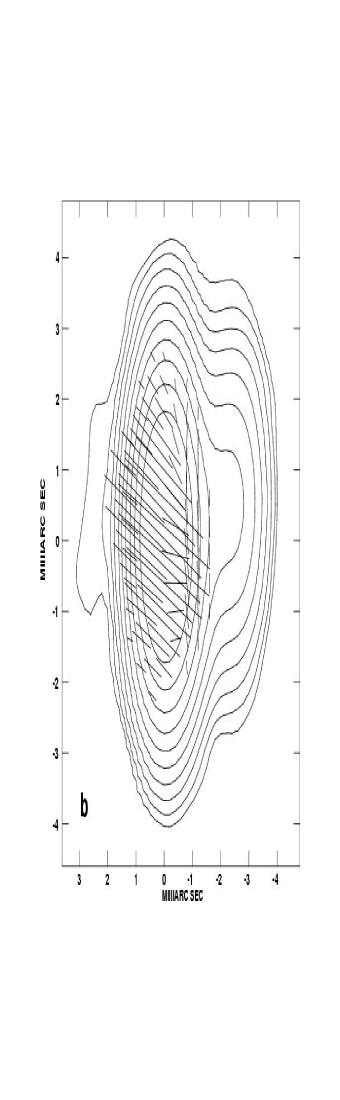
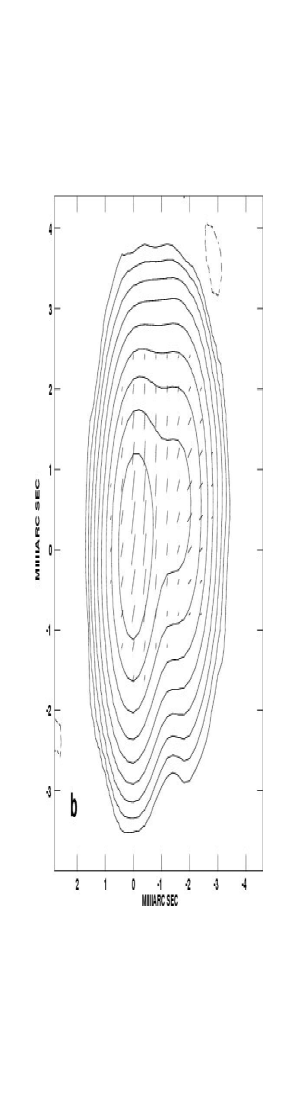
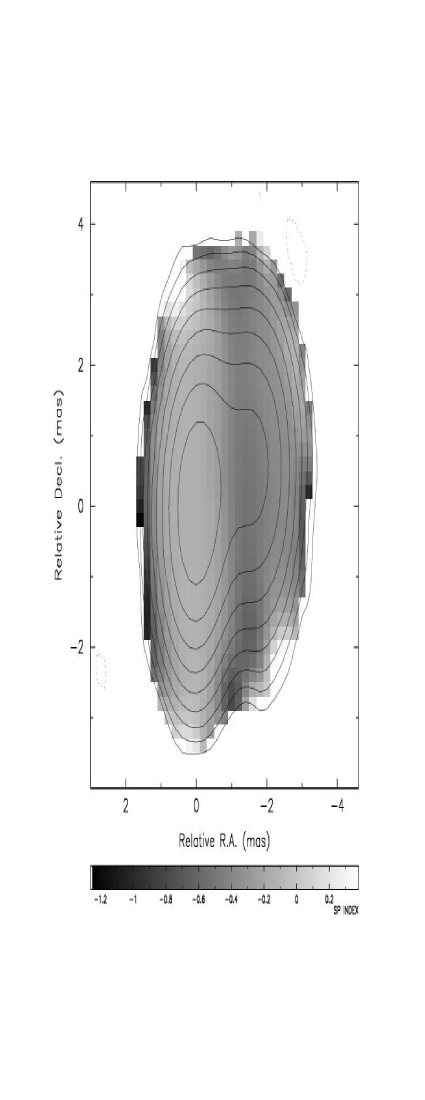
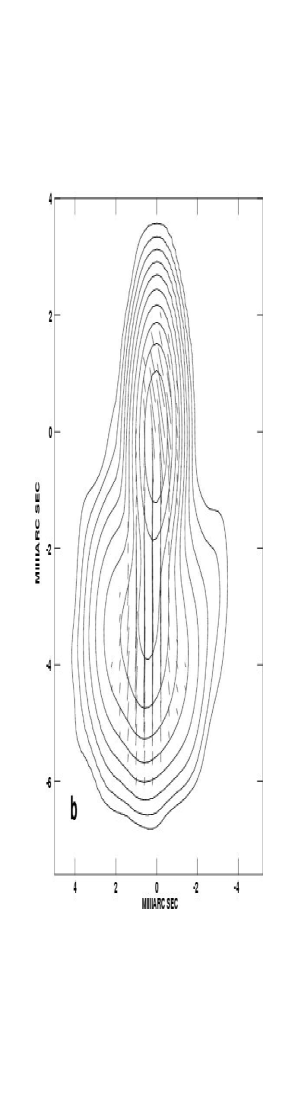
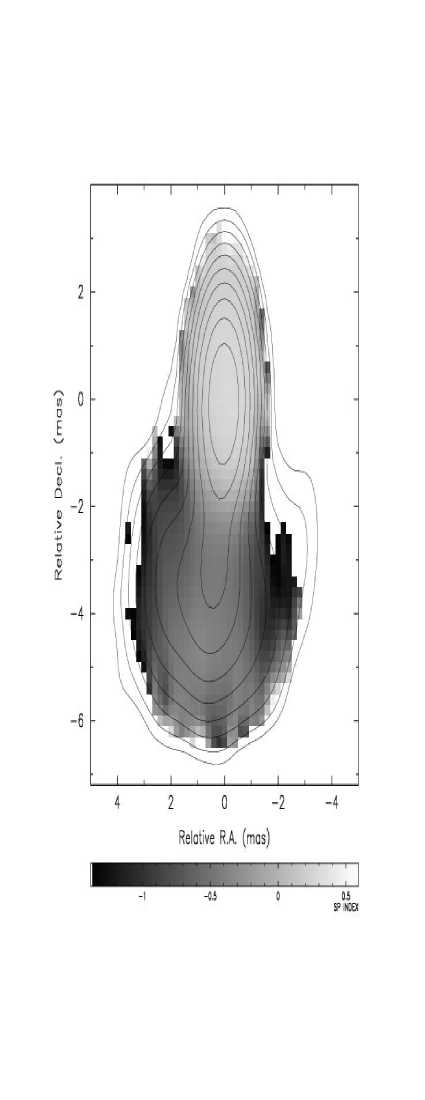
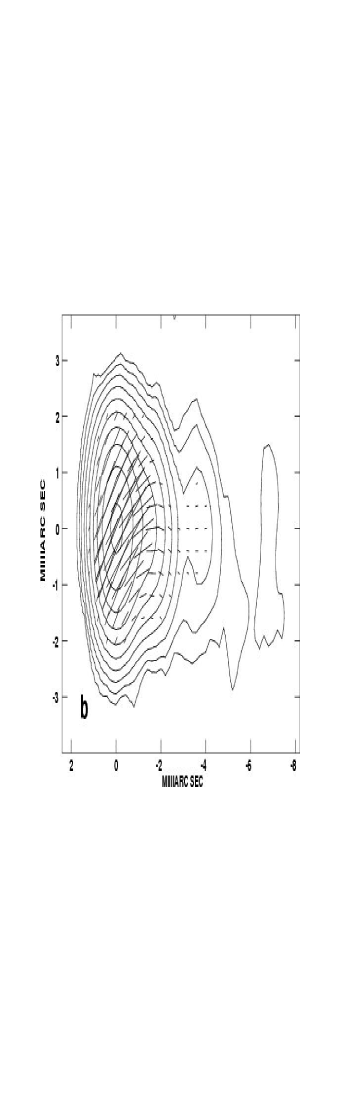
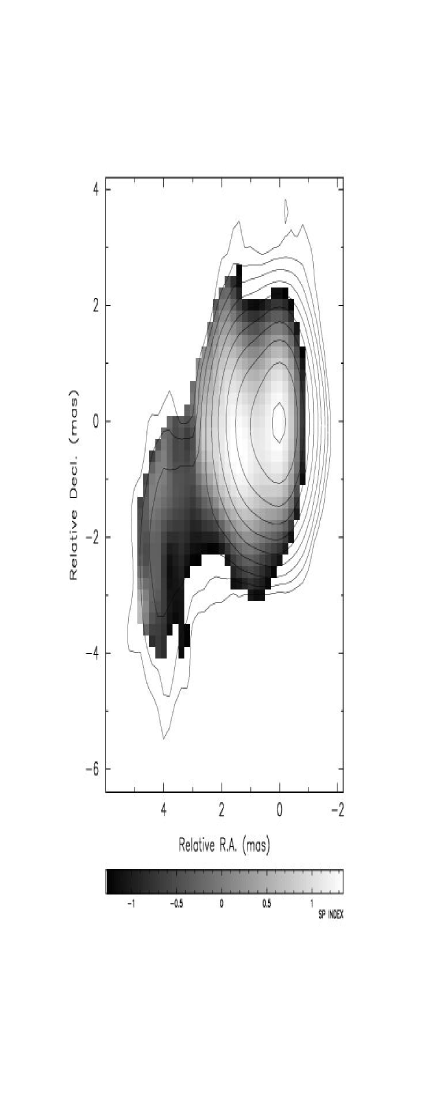
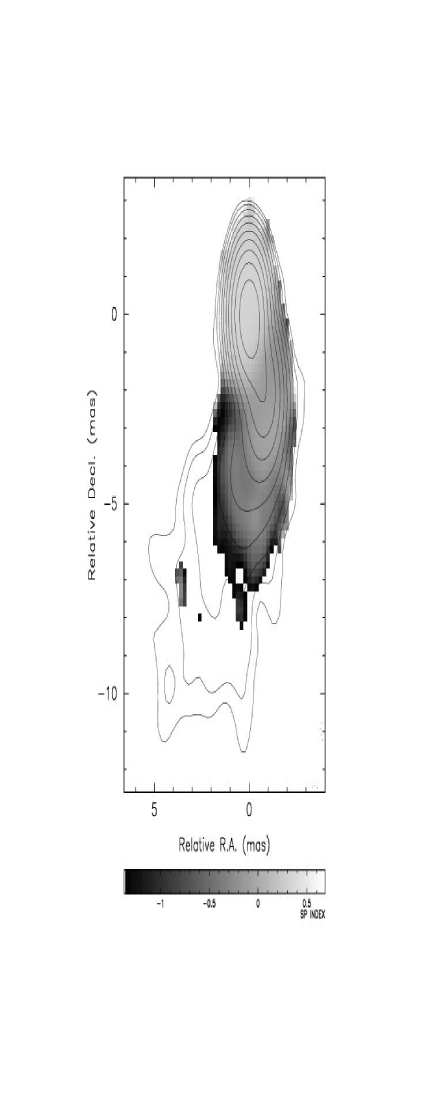
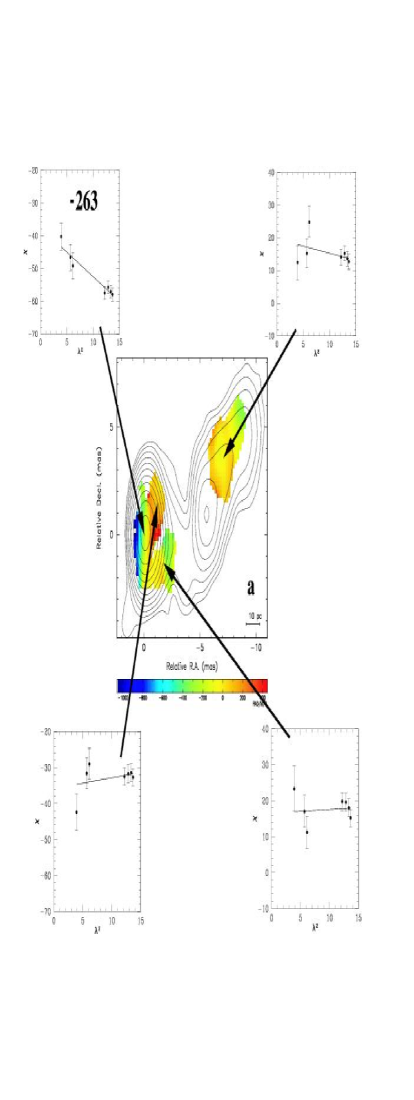
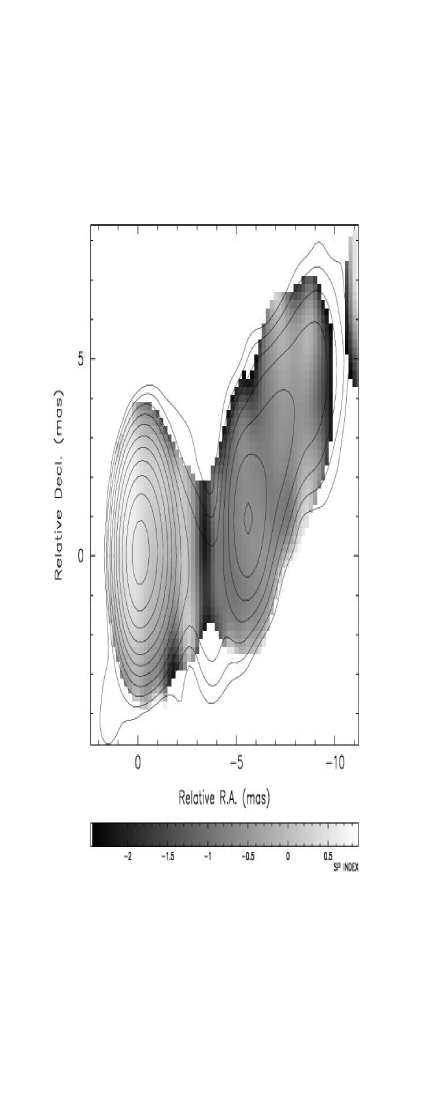
Results for individual sources are presented. There are usually three images for most sources. These images display the rotation measure, E vectors corrected for Faraday rotation, and spectral indices for the sources. Rotation measure results for the radio galaxies 3C 111, 3C 120 and M87 were presented in Zavala & Taylor (2002), thus only spectral index and E vector maps are shown in this paper. Vector lengths shown are proportional to the polarized flux density, and the scale is given for each figure. These plots were made with the AIPS task COMB with PCUT set to 5 derived from the Stokes Q and U maps, and ICUT set to 3 in total intensity. No polarization data for the radio galaxy 2021+614 are provided as this source was unpolarized.
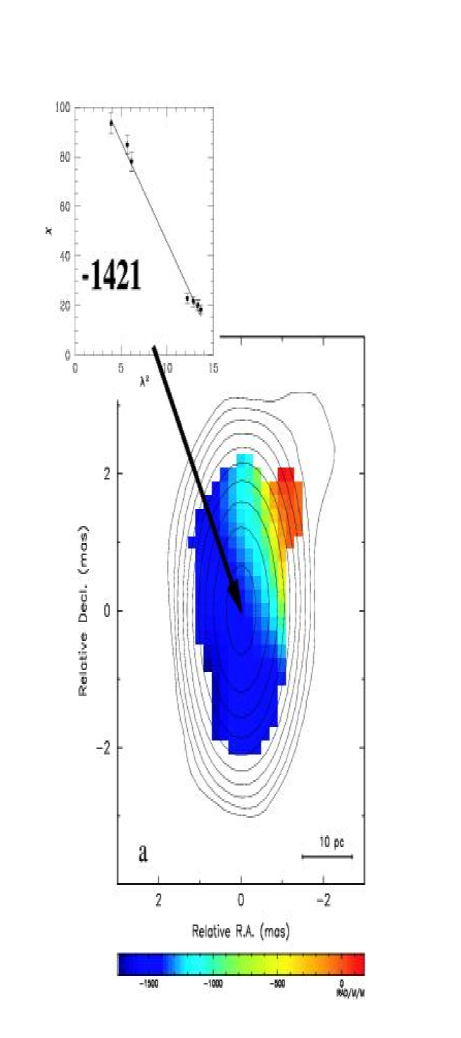
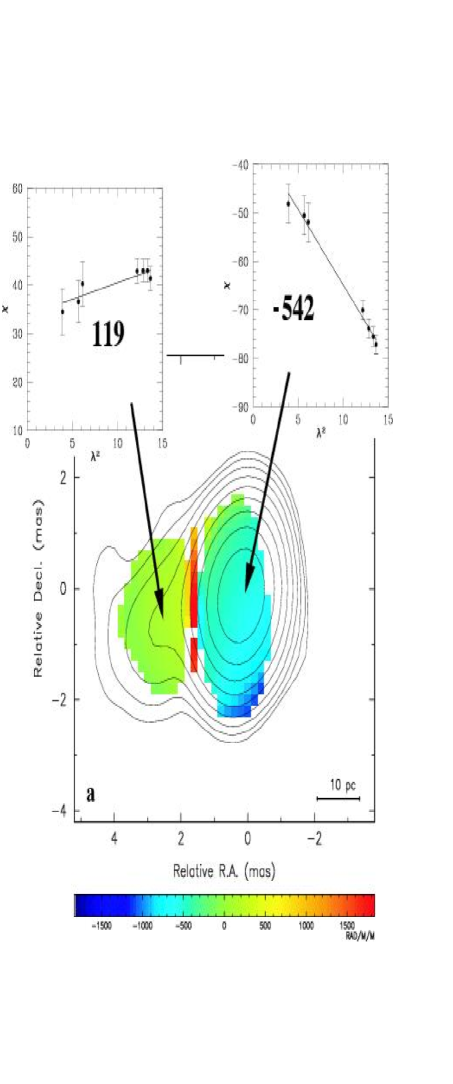
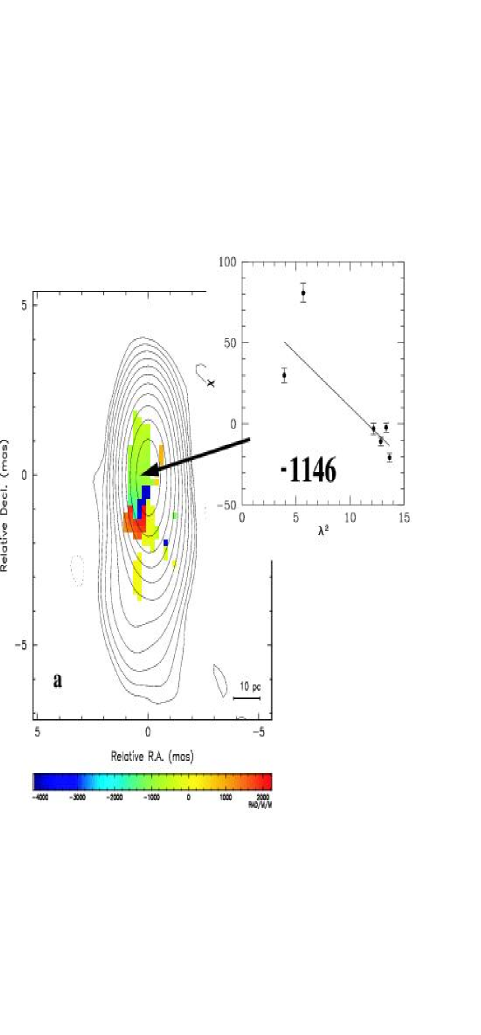
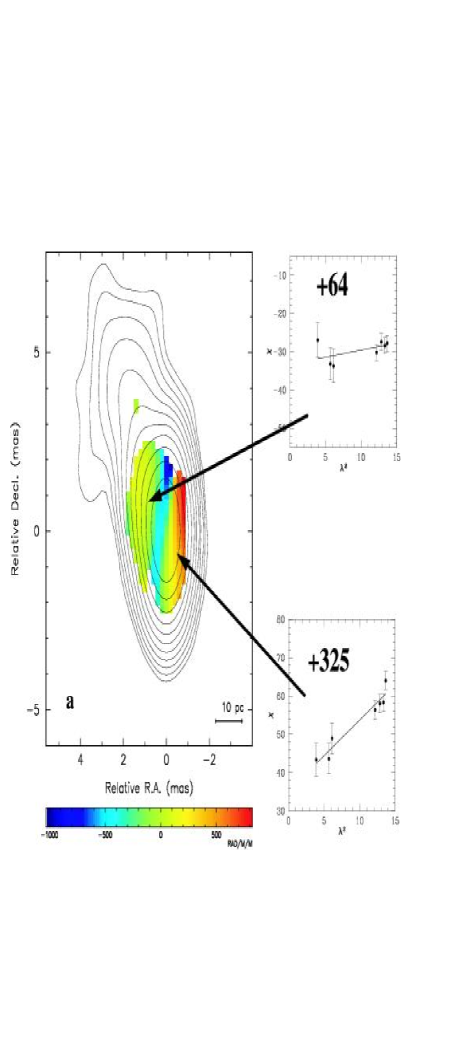
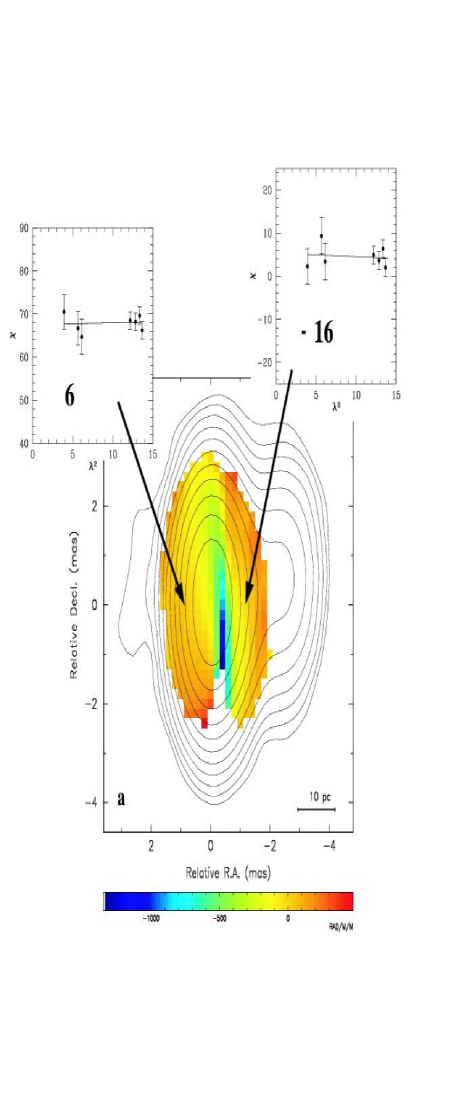
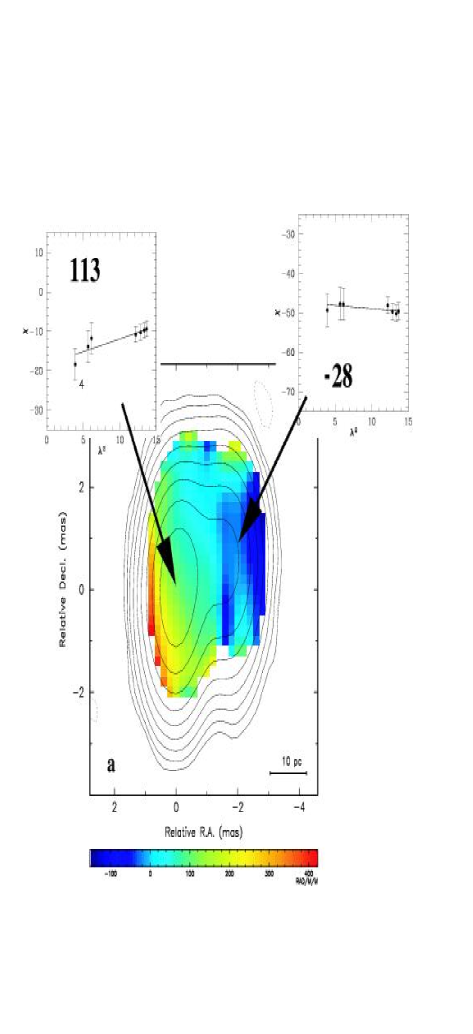
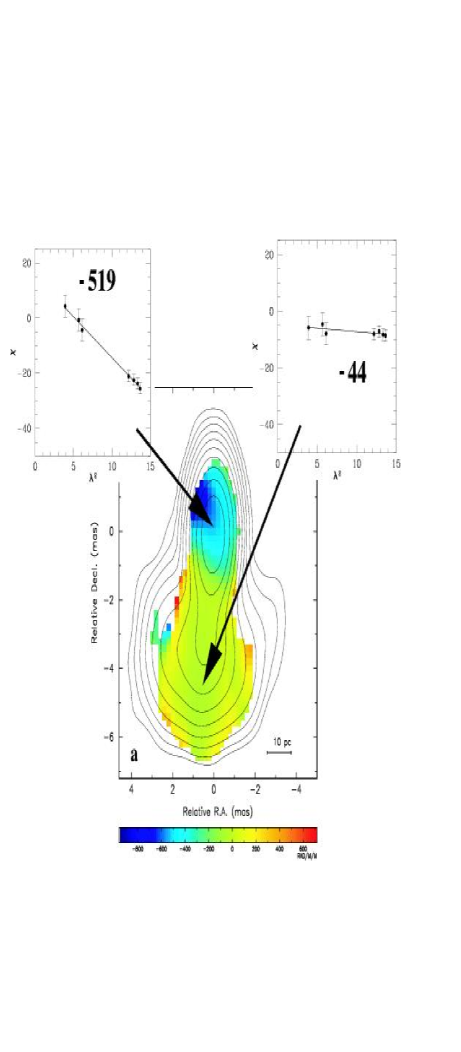
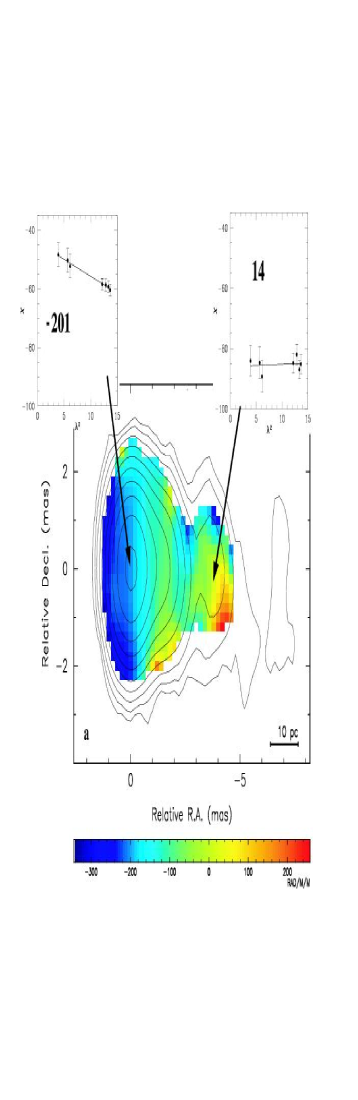
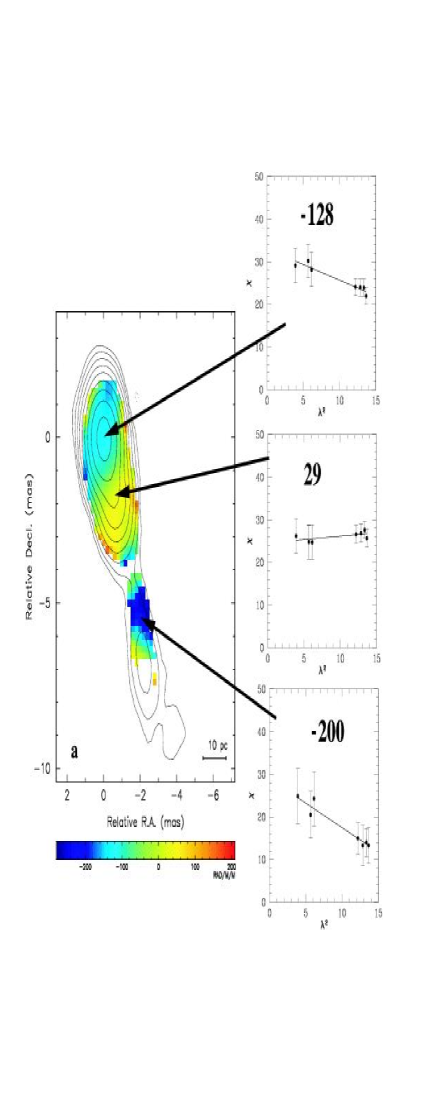
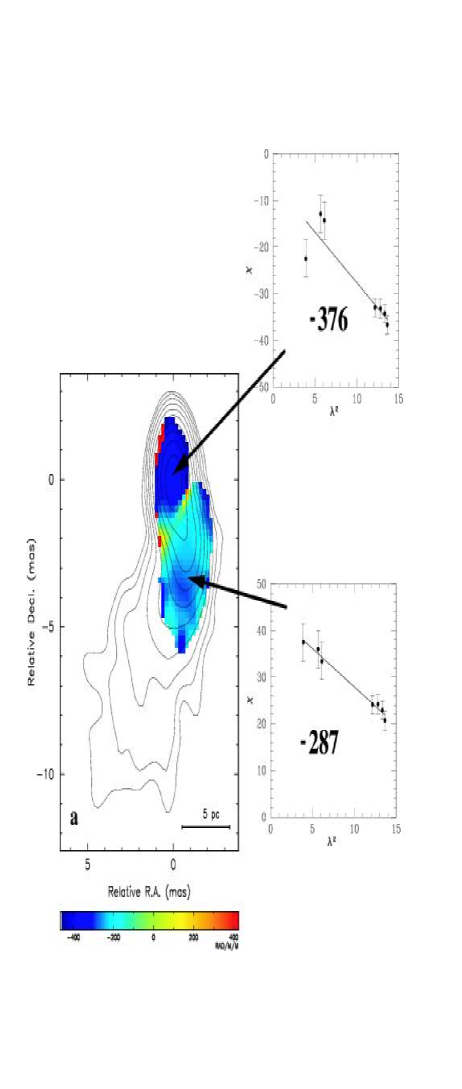
The rotation measure maps consist of a color plot of the observed RM results overlaid on 15 GHz contours. The 15 GHz contours begin at the 3 level in the Stokes I map and increase by factors of two. Insets of the plots of polarization angle versus are shown, with the linear fits to the data provided. Values of the RM which result from the fits are placed in the inset plots in units of rad m-2. The error bars on the data points are determined by adding in quadrature the noise from the Stokes Q and U maps with the errors determined from the EVPA calibration technique previously reported in Zavala & Taylor (2001). These are 2∘ at 8 GHz and 4∘ at 12 and 15 GHz.
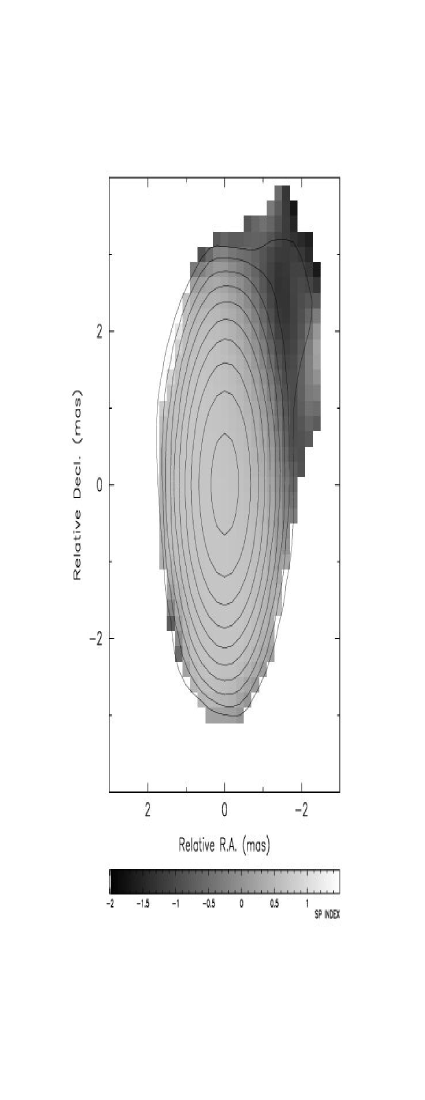
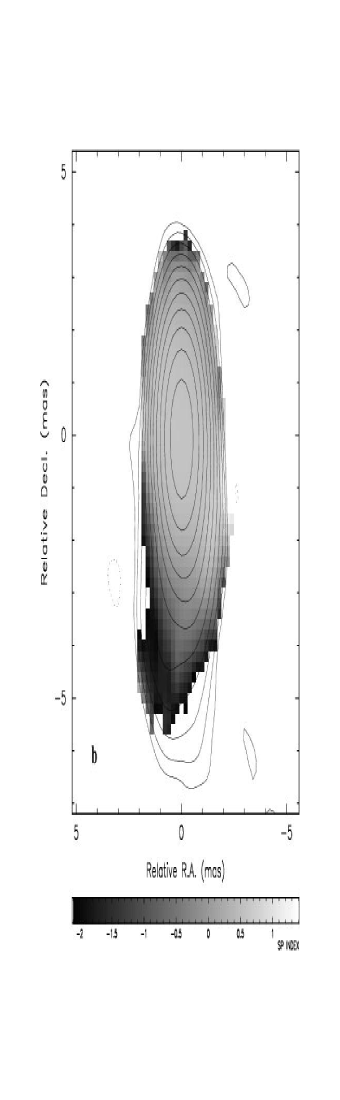
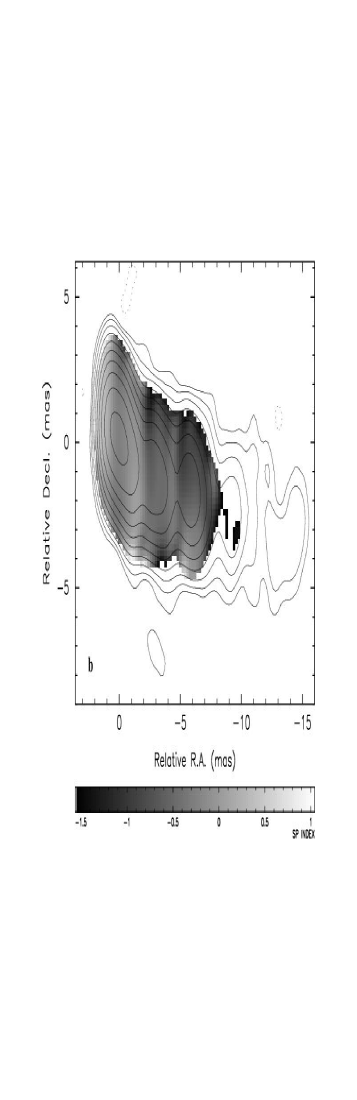
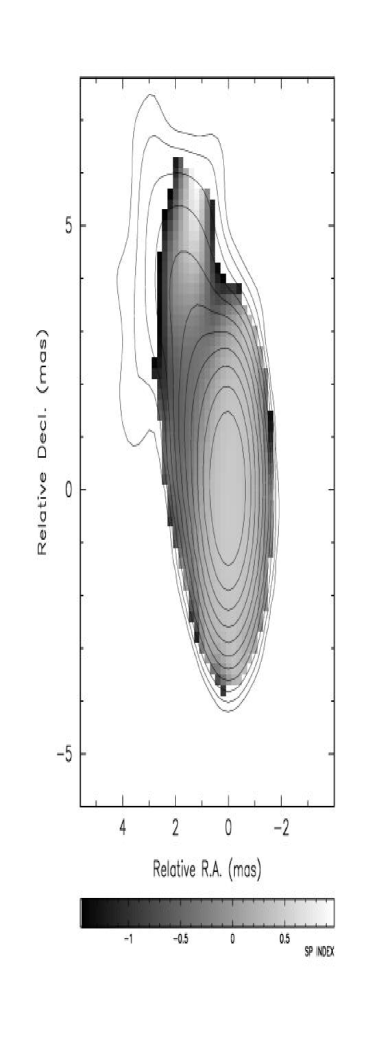
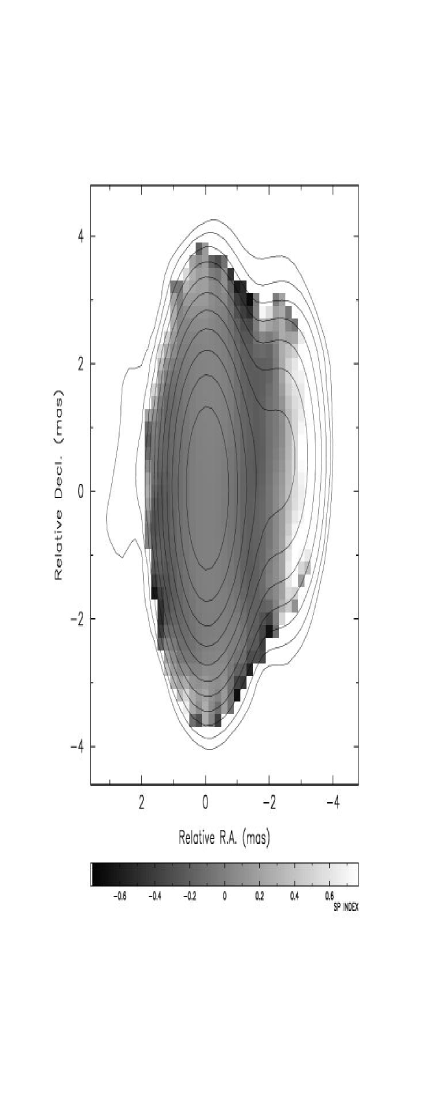
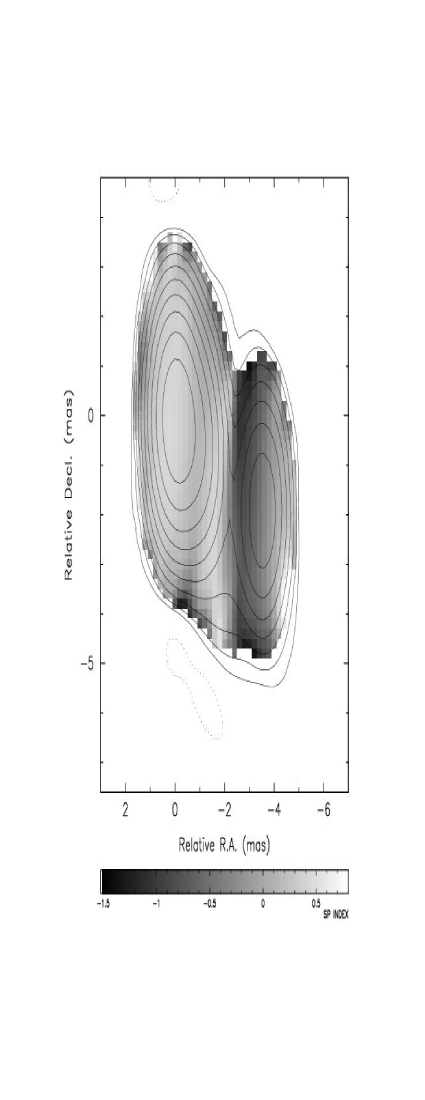
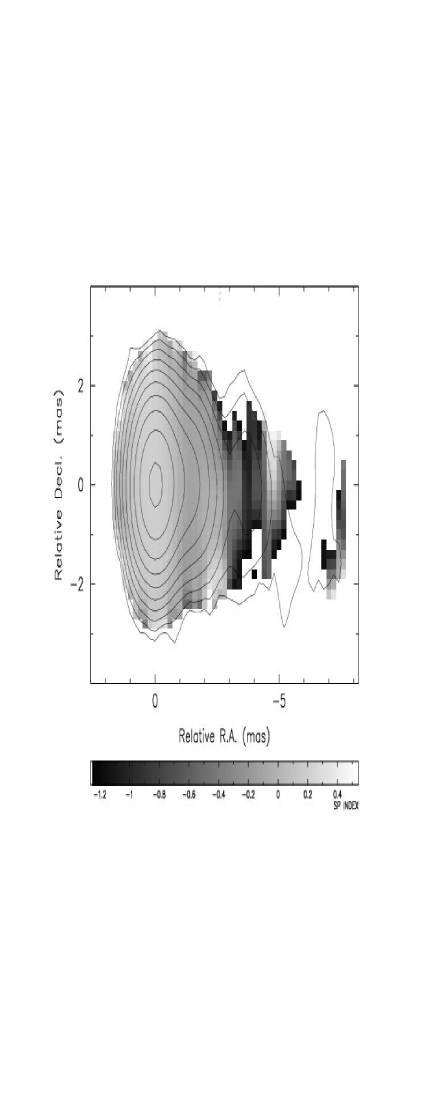
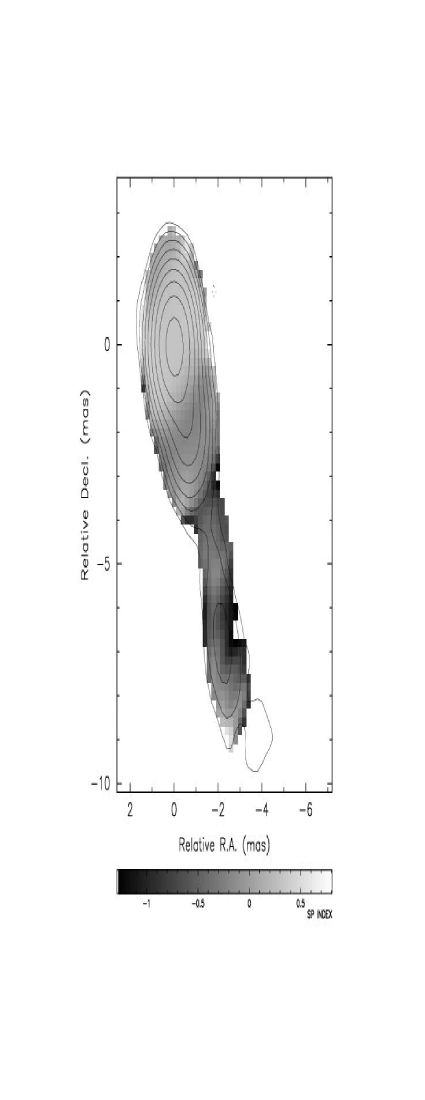
Spectral index maps were made with the AIPS task COMB, with pixels less than 5 in the Stokes I images blanked. The spectral index plots were made for the interval.
3.1 B0133+476
This quasar exhibits a relatively high RM of rad m-2 in the core. The percent polarization increases at the location of the fit from 1.3% at 15 GHz to 1.9% at 8.1 GHz. The extension NW of the core with a positive rotation measure of rad m-2 is consistent with an RM of zero. There is therefore no convincing evidence for a change of sign of the B field in this region. This region does coincide with an optically thin spectrum from 812 GHz, as indicated in Fig. 2. The core has a flat spectrum across these frequencies.
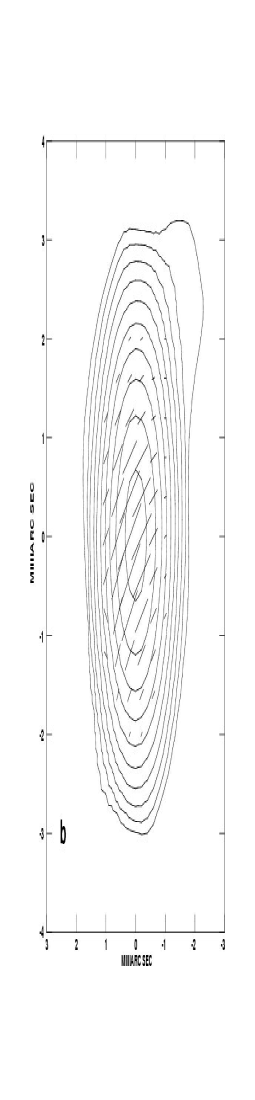
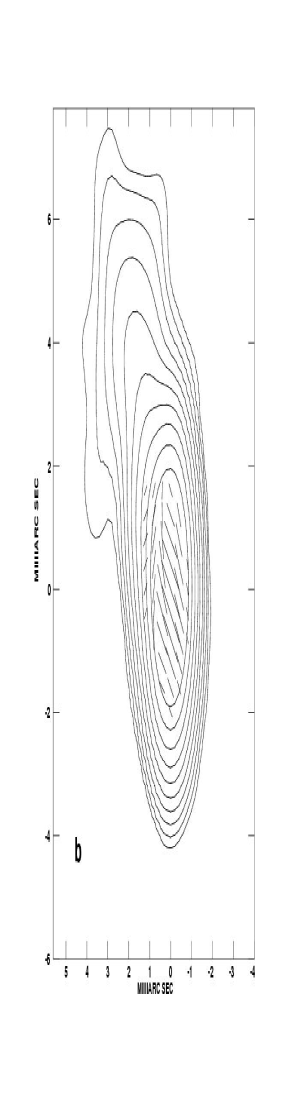
3.2 B0212+735
The quasar 0212+735 shows an RM of rad m-2 at the center, and rad m-2 in the jet (Fig. 3). The center fit exhibits a flat spectrum, with . Percent polarization at the peak in the I map is approximately 6% from 1215 GHz and decreases to 3% at 8 GHz. The optically thin jet maintains a percent polarization 13%. The thin (width about 1 pixel) region with an indicated RM of 1000 rad m-2 separates two areas where the slope of the rotation measure changes sign. The polarization vectors also change direction across this boundary. The fits to a law show different slopes across 812 GHz as compared to 1215 GHz. The RMs of order 1000 are then not physically real, but result from the superposition of two regions of differing polarization angles. Unfortunately, it is not possible to reject these fits easily in preparing the RM maps.
3.3 3C 111
The rotation measure image for this radio galaxy was published in Zavala & Taylor (2002). No reliable rotation measures could be determined for the core due to a weak to non-existent polarization at 12 and 8 GHz. The jet had a rotation measure of rad m-2 3 mas east of the core, which decreased to rad m-2 5 mas east of the core. A positive spectral index coincides with the depolarized core of this radio galaxy. The E fieldvectors are well ordered along the jet.
3.4 B0420-014
No reliable fits to a law were obtained for this quasar. The plot of polarization angle versus (inset to Fig. 6a) is representative of the results obtained for 0420014. Two different RM slopes are implied; a steep positive slope from 15-12 GHz, and a shallower, negative slope across the 8 GHz position angle data. The spectral index plot (Fig. 6b) shows that a flat spectrum characterizes most emission from this quasar across 812 GHz. Percent polarizations integrated over the source are 0.9%, 0.1% and 0.4% at 8.1, 12.5 and 15 GHz, respectively. We set an upper limit to of 0.2% at 12.1 GHz. The upper limit for 12.1 GHz is due to noisier polarization data at this frequency. Rotation measure fits using all but the 12.1 GHz data create inconsistent slopes of position angle versus . The 8 GHz points are consistent with a rotation measure of zero, while the two points at 12.5 and 15.1 GHz suggest a much higher rotation measure.
3.5 3C 120
As for 3C 111, the RM maps for this radio galaxy were presented in Zavala & Taylor (2002). The core rotation measure was rad m-2. This decreased to approximately rad m-2 after a projected distance of 1 parsec, which is similar to what is observed in quasars. The jet, where the percent polarization is 18%, was shown to have good agreement to a law. The spectral index in the jet is or less. Electric field vectors are perpendicular to the jet axis. The E vectors in the core are coincident with rotation measures that may show a deviation from a law (Zavala & Taylor, 2002, Fig. 4).
3.6 B0528+134
This quasar shows a decrease in RM as one proceeds along the jet from the core (Fig. 8). The inset plots in Fig. 8 have RMs of and rad m-2. The percent polarization in the core is 1% at 15 GHz, decreasing to 0.5% at 8 GHz. The spectral index at the location of the core RM fit has turned over and is slightly positive (Fig. 9. A small steeper spectrum region separates the flat spectrum core and jet. The jet fractional polarization varies from 2% to 3.5% from 15 GHz to 8 GHz respectively.
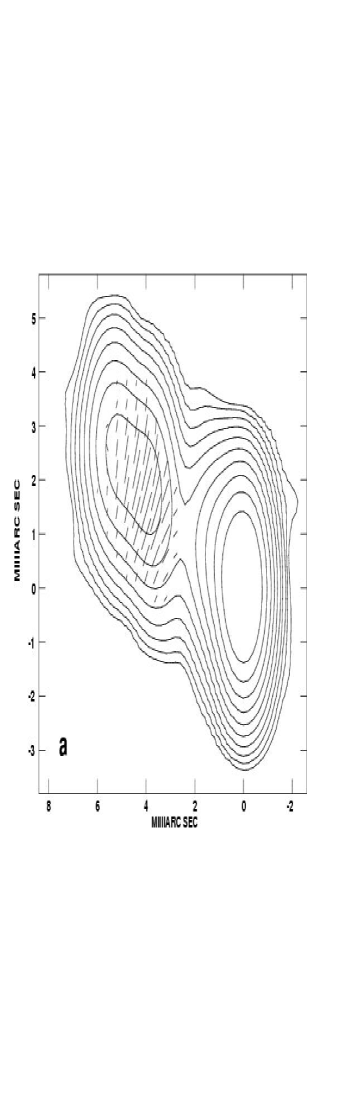
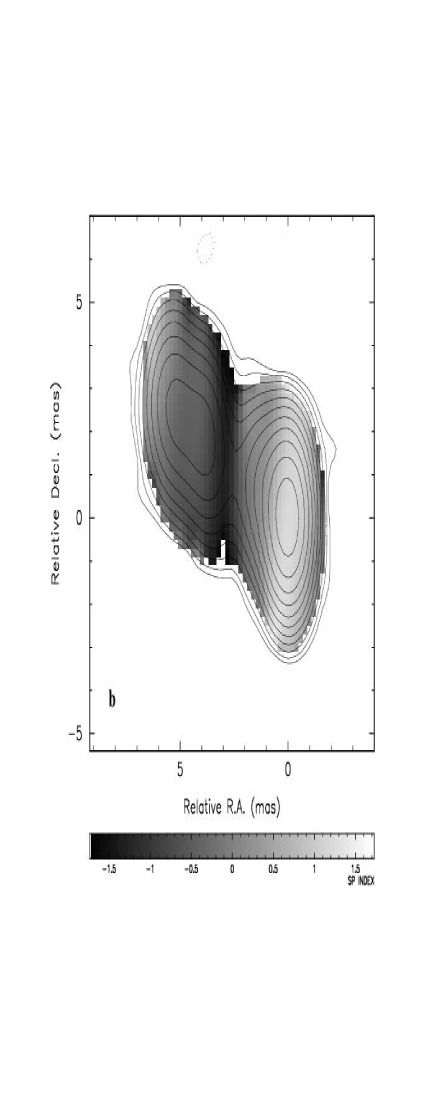
3.7 B0923+392
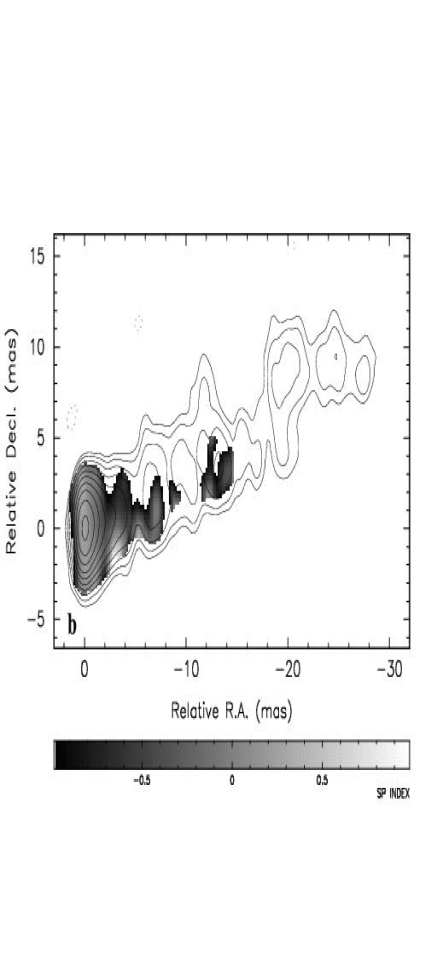
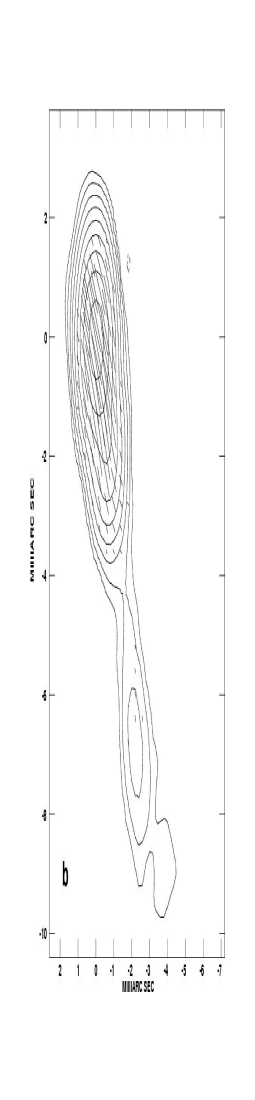
3.8 M87
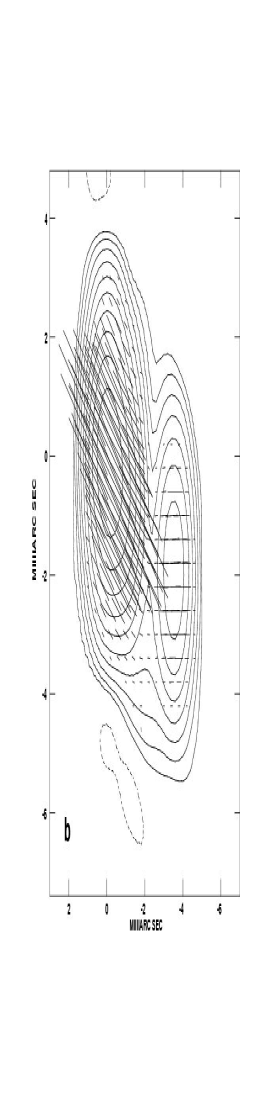
The rotation measure map for this radio galaxy was presented in Zavala & Taylor (2002). The rotation measures are confined to a region from 18 to 27 mas west of the core. The rotation measure varied from 5000 rad m-2 to almost 10,000 rad m-2. The errors in the rotation measures are approximately rad m-2. A sign change in the slope of the RM is seen over a projected distance of 0.3 pc. The electric field vectors in the area 20 mas west the core are perpendicular to the jet boundary. The cutoff used to create the spectral index maps (§3) prevents the spectral index from being mapped in this area.
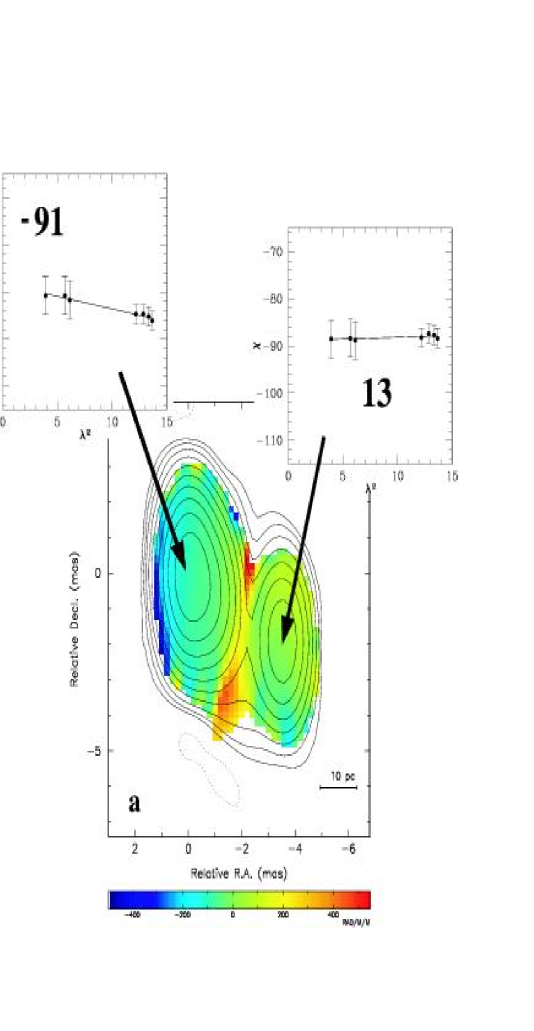
3.9 3C 279
Both the flat spectrum core and steeper spectrum jet (see Fig. 14) of this quasar show good agreement to a law. The low rotation measure of the core ( rad m-2) is similar to that seen in Taylor (2000) and Zavala & Taylor (2001). Taylor (1998) found a much higher core rotation measure of 1280 rad m-2.
3.10 B1308+326
The low RM of this BL Lac is contrasted with a turn in the E fieldof almost 35∘ from core to the edge of the polarized emission west of the core. The fits give rotation measures of and rad m-2. Percent polarization in the core is 3% while in the jet it increases to almost 6%. The core has a flat spectrum. Electric field vectors in the core are perpendicular to the jet direction, and turn almost parallel to the jet at 2 mas west of the core. There is an unpolarized jet component 9 mas west of the core which is not shown.
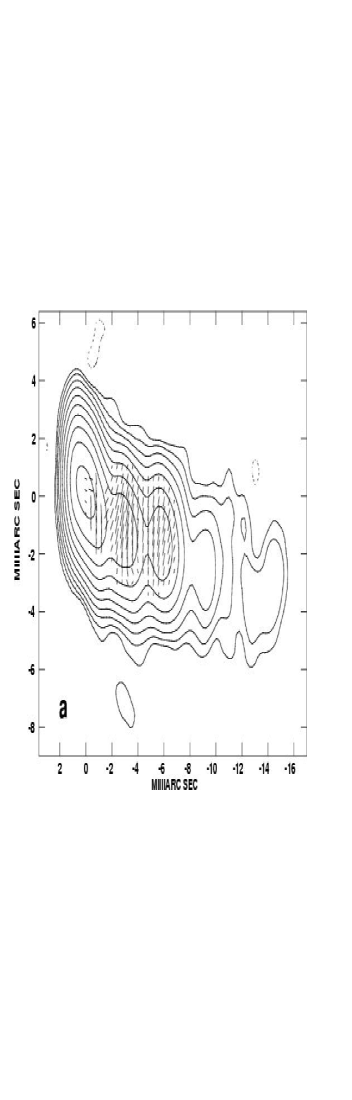
3.11 B1611+343
As seems typical for quasars the RM in the core and jet both seem to be in good agreement with the law. Similar to the general results of Taylor (1998, 2000) the rotation measure is highest in the core ( rad m-2), and decreases to rad m-2 within 10 parsecs of the core. This follows the change in spectral index from a flat spectrum core to a steeper spectrum jet. The electric field vectors are essentially parallel to the jet throughout this quasar.
3.12 1803+784
This BL Lac object is optically thick at 8 GHz at the core, and has an fractional polarization of 5%, while maintaining agreement to the law. The jet has a flat RM (14 73 rad m-2), is optically thin, and has approximately 2030% polarization. In a similar fashion as the quasars the core shows a higher rotation measure ( rad m-2) as compared to the jet.
3.13 1823+568
Breaking with the trend seen for other objects reported herein, the jet 5 mas south of the core of this BL Lac object displays an RM ( rad m-2) comparable to that in the core ( rad m-2). These two regions are separated by a nearly flat RM 2 mas south of the core. The B vectors remain perpendicular to the jet axis, and the core and jet have the usual flat and steeper spectra respectively.
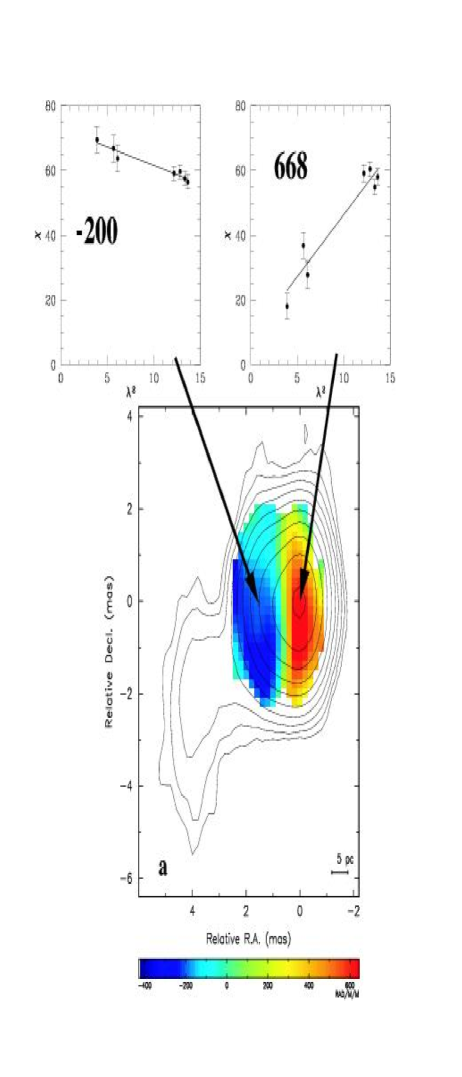
3.14 2005+403
At first glance this quasar seems to exhibit a sign change in the RM, but the quality of the core RM fit is poor. The core has an RM of rad m-2, and the jet rad m-2. The 8 GHz core polarization angles suggest a flat RM, while the 12 and 15 GHz data suggest the steeper, positive RM of 668 rad m-2. The core has an inverted spectrum from 8 to 15 GHz. The location of the RM fit 1.5 mas east of the core has an inverted spectrum from 812 GHz, but is optically thin at 15 GHz.
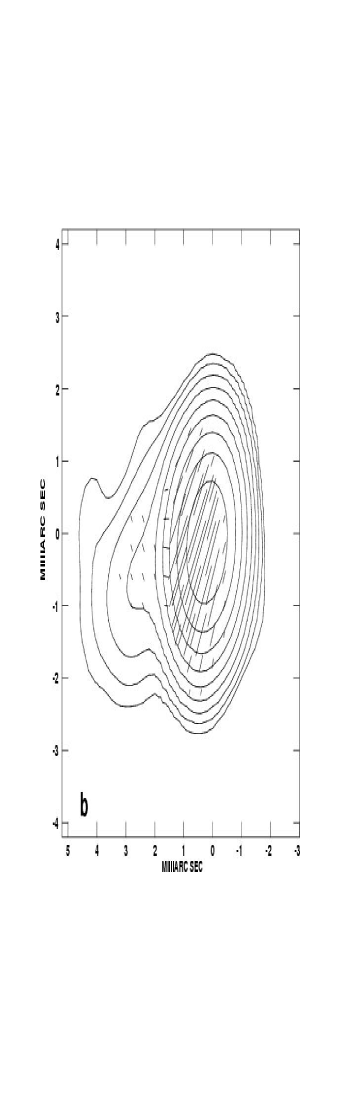
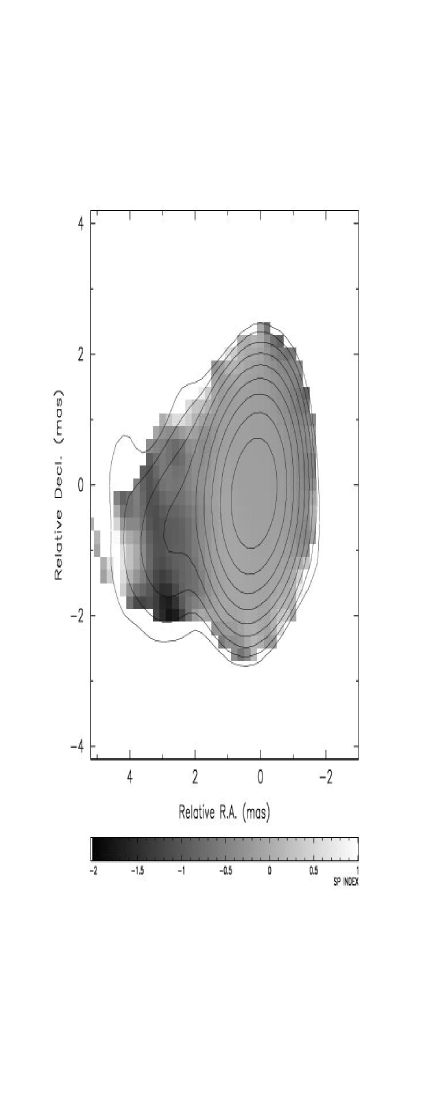
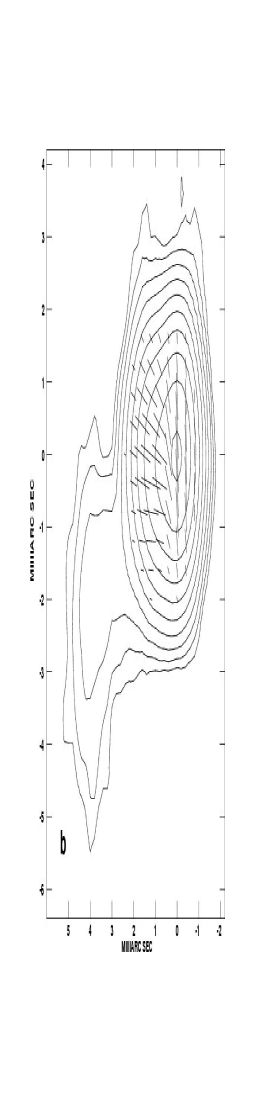
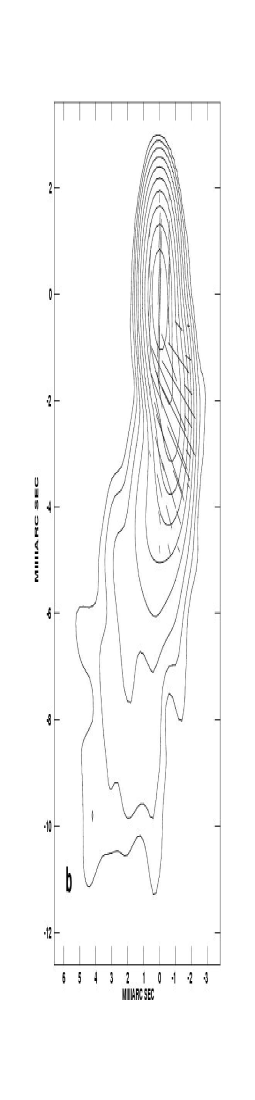
3.15 B2200+420 (BL Lac)
This prototype of the BL Lac object class (Strittmatter et al., 1972) has previously been observed to have a core rotation measure of 550 rad m-2 and a jet rotation measure of 110 rad m-2 with good agreement to a law (Reynolds, Cawthorne, & Gabuzda, 2001). However, Fig. 25 clearly shows a breakdown in the law for the core. The rotation measure in the jet has increased to rad m-2 as compared to the Reynolds, Cawthorne, & Gabuzda (2001) result. Our data show the jet has a rotation measure comparable to the jets in quasars, and has a higher polarization than the core (mcore = 3%, mjet = 18%).
3.16 2251+158
This bright quasar exhibits an interesting structure in both the RM and B vector image. As the inset plots of Fig. 27 show, agreement to a law is only evident at the peak in the I image. The RM at this point is rad m-2. Percent polarizations for the core range from 1% at 8 GHz to 0.7% at 15 GHz. Rotation measures are not given in the remaining insets due to the poor fits to a Faraday rotation law. The reliability of the indicated E fielddirections in Fig. 27b are suspect due to the unreliable RM fits. The spectral index is flat within 3 mas of the core (Fig. 28), and becomes steep beyond that point.
4 Discussion
Some general rotation measure properties of the sample will be discussed, and then properties of separate classes of AGN. Data used to prepare the figures for this section are listed in Table 3.
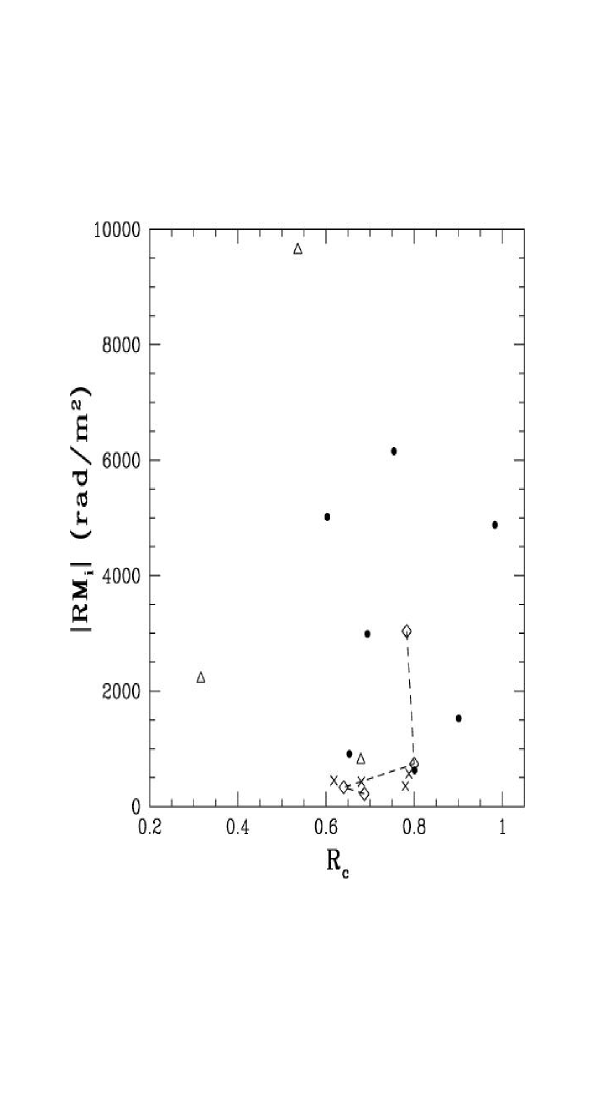
4.1 Rotation measure vs. core dominance
In an effort to examine the cause of the observed rotation measures a plot of the absolute value of the maximum RM versus 15 GHz core dominance (Rc) was created (Fig. 29). The core dominance is defined as the ratio of the peak flux density in the map divided by the sum of the CLEAN components in the map. The rotation measure has been corrected for redshift by a factor of (1 + z)2. Quasars are plotted as dots, radio galaxies as triangles, and BL Lac objects as X’s. Multi-epoch rotation measure data for the quasar 3C 279 are plotted as diamonds connected by a dashed line. The plotted rotation measure is for the core, except for the radio galaxies 3C 111 and M87. For these two radio galaxies we plot the maximum rotation measure observed in the jet as depolarization in these galaxies prevented the determination of a rotation measure in their cores.
At first glance Fig. 29 shows that on parsec scales AGN rotation measures are independent of core dominance. Closer examination shows that the BL Lacertae objects have a systematically smaller maximum RM as compared to quasars and radio galaxies. This suggests that a moderate ( 500 rad m-2 or less) rotation measure in the rest frame could serve as a dividing line between quasars and BL Lac objects. This division may not be robust, as clearly 3C 279 has crossed below this threshold. The small number of BL Lac objects in Fig. 29 represent snapshots in time, and future monitoring will be needed to confirm that BL Lac objects are restricted to relatively low rotation measures. Vermeulen et al. (1995) have shown that BL Lac itself can have optical emission lines with equivalent widths greater than 5 angstroms, and thus not meet the criteria for classification as a BL Lac object as set by Stickel, Fried, & Kuehr (1993). Therefore, it is not inconceivable that the RM variation in the core of a BL Lac could yield a rotation measure more consistent with a quasar core. As the jets of BL Lacs have rotation measures consistent with those seen for quasar jets similar Faraday depths are present on parsec scales for these two optical AGN classes.
The path of 3C 279 through Fig. 29 shows that at least one quasar can move vertically and horizontally through a core dominanceRM space. Future monitoring may show that all quasars have a variable RM independent of core dominance. The cores can also brighten or fade, so some horizontal movement in Fig. 29 occurs. 3C279 maintains a constant magnetic field orientation across the three year span of RM monitoring of 145150∘, with the exception of epoch 1998.59 when the magnetic vector orientation was 120∘. The magnetic field orientation was determined from the RM corrected intrinsic E field vector rotated by 90∘.
Small number statistics make comparisons between the object classes difficult. However, the systematic offset between the BL Lac’s and quasars in Fig. 29 may make a comparison worthwhile. The quasars in Fig. 29 have an average (absolute value) rotation measure of 2400 rad m-2, and a median of 1500 rad m-2. The BL Lacs have an average of 450 rad m-2, and a median of 440 rad m-2. These data suggest that BL Lac cores have a low, but not insignificant, rotation measure as compared to quasar cores. Such a rotation measure property separating BL Lacs from quasar cores must be tested over time and for a larger sample before it is to be considered a defining characteristic.
As shown in Zavala & Taylor (2002) the radio galaxies M87, 3C 120 and 3C 111 have relatively high rotation measures; equal to or greater than the rest frame RMs in the quasar cores presented here. A similar result was found for the radio galaxy 3C 166 which has a rest frame RM of 2300 rad m-2 for its inner jet and has a depolarized core (Taylor, Hough & Venturi, 2001). The highest parsec scale rotation measure in the rest frame (2040,000 rad m-2) still belongs to the quasar OQ 172 (Udomprasert et al., 1997), so rotation measures of order 10,000 rad m-2 do not belong exclusively to the radio galaxies. The depolarization of radio galaxy cores in Zavala & Taylor (2002) may be due to Faraday depolarization across an observing band as the nuclear torus surrounding the black hole may provide the requisite Faraday depth to account for the observed depolarization (Rudnick, Jones & Fielder, 1986).
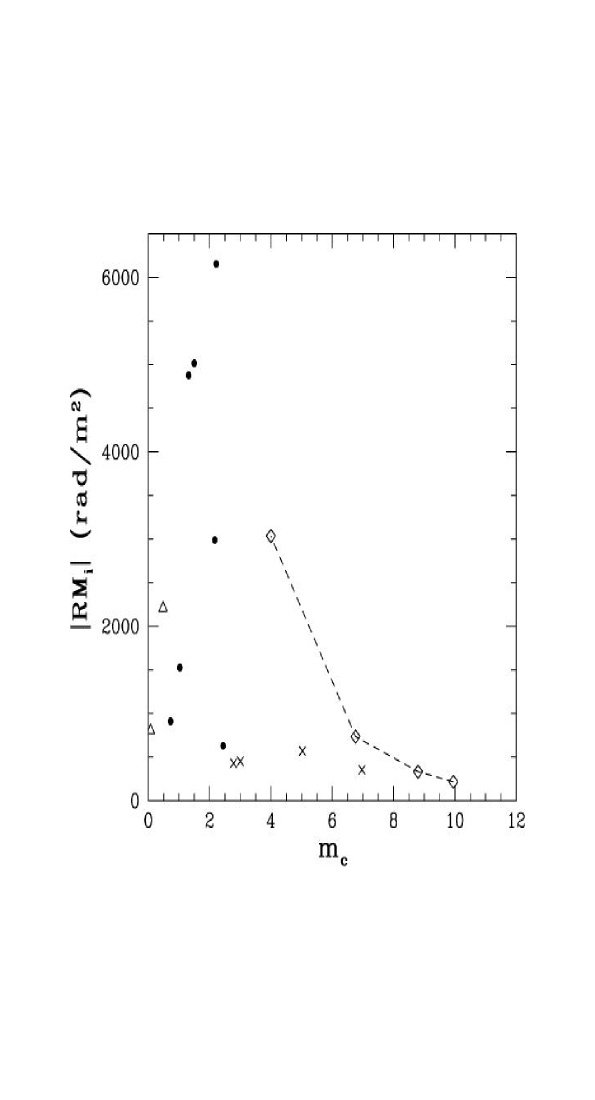
4.2 Rotation measure vs. percent polarization
A high core rotation measure (RM greater than 500 rad m-2) is clearly anti-correlated with core percent polarization (Fig. 30). The symbols in Fig. 30 are the same as for Fig. 29. This depolarization for high rotation measures is not due to Faraday depolarization across the observing bandwidth. For Faraday rotation to depolarize the signal across the 32 MHz bandwidth at 15 GHz requires an RM of more than 600,000 rad m-2. This is clearly inconsistent with the observed RMs of order 1000 rad m-2.
A possible explanation for the depolarization is a gradient in the Faraday screen across the source, or beamwidth depolarization (Gardner & Whiteoak, 1966). A useful rule of thumb is that a turn of one radian in polarization angle across the beam is sufficient to cause substantial depolarization. The required RM gradient is then
| (3) |
where the RM gradient RM equals the change in polarization angle at the given wavelength squared across a beam. At 15.1 and 8.1 GHz gradients of 2540 and 770 rad m-2 beam-1, respectively, will depolarize a source across a beamwidth. Invoking an RM gradient to depolarize the 15 GHz signal provides a gradient more than three times what is needed to depolarize the 8 GHz signal. Obviously, a gradient can depolarize a source at 8 GHz, and have no appreciable effect at a higher frequency. The changes in the observed rotation measure are attributed to a foreground screen sampled on a changing sightline as components move along the jets in the AGN (Taylor, 2000). Once a component has moved beyond a projected distance of 10 parsecs from the core the screen changes to a lower and more uniform Faraday depth.
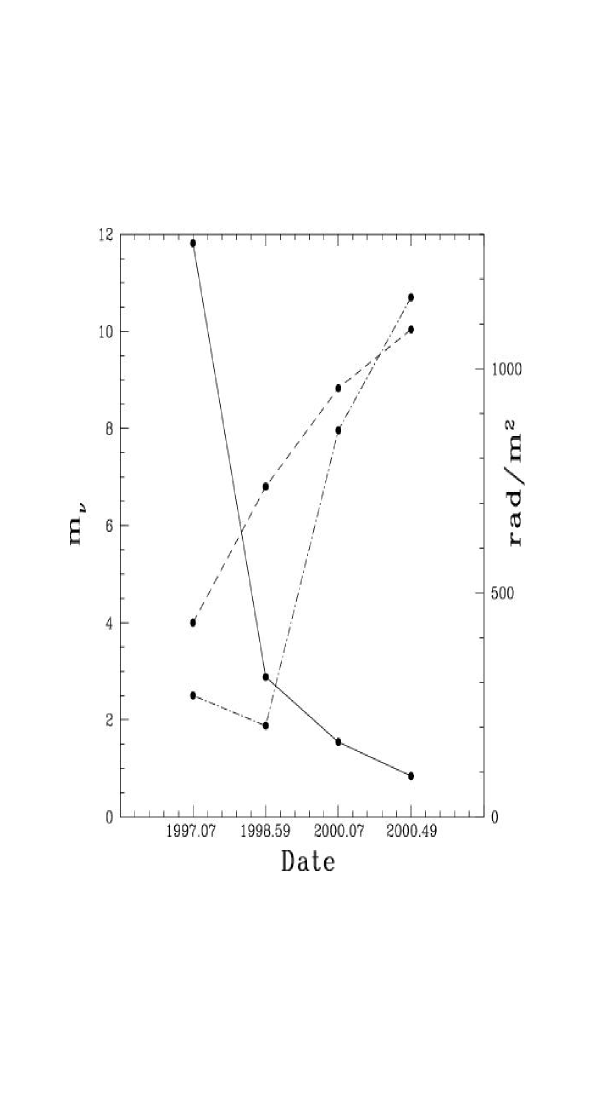
The multi-epoch data for 3C 279 can also be used to look for any correlation of percent polarization with rotation measure. This is shown in Fig. 31, where the rotation measure in the core and percent polarization at 8 and 15 GHz are plotted versus observation epoch for 3C 279. The initial high rotation measure at epoch 1997.07 occurs with a relatively low percent polarization at both frequencies. As the magnitude of the RM decreases the percent polarization rises. Interestingly, the 8 GHz percent polarization lags the rise in the 15 GHz percent polarization at epoch 1998.59. This is consistent with a Faraday screen with a gradient that decreases in magnitude as components move along the jet.
Tracking the motion of model components in the region of high Faraday depth will set an upper limit to the scale size of the foreground Faraday screen. For example, epochs 1997.07 and 1998.59 could set such a limit if the motion of a model component near the core could be accurately measured and its motion tracked. Unfortunately, while we can measure the motion of component C4 (the component 3.5 mas west of the core) of 3C 279 across the four epochs, we were unable to unambiguously identify components within approximately a milliarcsecond of the core. These may be stationary components 1.2 mas or less from the core of 3C 279 as reported by Wehrle et al. (2001). Another factor is that these observations were not designed with the (u,v) coverage required to properly conduct a motion study.
No correlation was found between the rest frame rotation measures and spectral index of the cores of the objects presented here.
4.3 Implications for BL Lac objects
The unified scheme for AGN describes BL Lacertae objects as strongly Doppler boosted sources whose relativistic jet is viewed close to the observer’s line of sight (Zensus, 1997). In such a scenario the relativistic jet can sweep away magnetized thermal gas which is probably intrinsic to the central parsecs of an AGN. Therefore, the foreground Faraday screen would be removed. An observer should then see little or no Faraday rotation towards a BL Lac object on parsec scales.
Surprisingly, Reynolds, Cawthorne, & Gabuzda (2001) found a relatively high quasar-like value for the core RM of BL Lac. The BL Lac objects presented here have core rest frame rotation measures of 500 rad m-2 or less. While BL Lac itself has a high core RM, the agreement to a law is not good, in contrast to the fits obtained by Reynolds, Cawthorne, & Gabuzda (2001). Failure to follow the Faraday rotation law could indicate an optical depth effect. BL Lac has a flat spectrum (=0.33) core and the combination of several components of varying, but physically unrelated, electric vector position angles can explain the lack of agreement to a law. The blending of components of unrelated polarization angles is also hinted at by the core percent polarization of 2.8%. Denn, Mutel, & Marscher (2000) reported that core polarizations of BL Lac in excess of 1% indicated the emergence of a new polarized component from the core. Full resolution 15 GHz maps with a 1.1 by 0.6 mas beam of BL Lac do not resolve the hypothetical component, but an extension to the south of the core may be an emerging component.
The jets of the BL Lac 1823+568 and BL Lac itself have rotation measures comparable to those found for quasar jets. Compared to Reynolds, Cawthorne, & Gabuzda (2001) the RM of the jet of BL Lac has increased by 170 rad m-2, and this time-variability argues for a Faraday screen intrinsic to the central regions of this object.
The nonnegligible jet rotation measures for BL Lacertae objects has implications for interpretations of intrinsic magnetic field orientations in these objects. Gabuzda, Pushkarev, & Cawthorne (2000) analyzed magnetic field orientations in the jets of BL Lac objects at 5 GHz and found that the majority of jets have magnetic vectors transverse to the jet axis. A correction using an integrated rotation measure of approximately 50 rad m-2 or less was applied for most objects in their analysis. At 5 GHz the parsec scale rotation measure of 250 rad m-2 changes the vector orientation by 52∘. Therefore, any attempt to make conclusions on magnetic or electric vector orientations in BL Lacertae objects at frequencies less than 15 GHz without parsec scale rotation measures must be suspect.
Our rotation measure results allow for the determination of the intrinsic EVPA orientation in the BL Lacertae objects presented here. To determine the degree of alignment of the electric vector with the jet direction we used the MODELFIT feature in DIFMAP to represent the BL Lac objects with Gaussian components, and derived a jet orientation axis . This angle , along with the difference for the core and brightest jet components, are listed in Table 4. There are no intrinsic electric vector orientations perpendicular to the jets or cores for the four BL Lacs. All the BL Lac objects presented here are optically thin at 15 GHz in both their cores and jets. The intrinsic magnetic field orientation is therefore determined by rotating the intrinsic electric vector by 90 ∘. None of the four BL Lac objects presented here shows an intrinsic magnetic field orientation parallel to the jet. With the obvious problems of small number statistics two out of four of the cores and jets of the BL Lacs have intrinsic magnetic vectors oriented perpendicular to the jet axes. The flat/inverted spectrum cores of the BL Lac objects do make interpretations of the magnetic vector orientations problematic at frequencies of 8 GHz or less. The averaging of components within our beam also complicates the analysis. Direct comparison to the extensive compilation of Gabuzda, Pushkarev, & Cawthorne (2000) is difficult as 10 years or more separate our observations. During this time much can change on the small scales probed by VLBI.
4.4 Depolarization in 0420014
As discussed in Taylor (2000) quasar cores are expected to be viewed through a line of sight likely to produce high (several 1000 rad m-2) rotation measures. The quasar 0420014 is weakly polarized (Fig. 6), and no reliable fits to a law were obtained. 0420014 is a high optical polarization quasar (Brindle et al., 1986) and is one of the EGRET detected blazars (Hartman et al., 1999). Jorstad et al. (2001) show that this quasar has structure on sub-milliarcsecond scales which includes stationary and moving components. Marscher et al. (2002) showed 0420014 that has two polarization components in their 22 and 43 GHz maps. Their 1997.58 data show the core is 0.5% polarized at 22 GHz, and 2.0% polarized at 43 GHz.
A relatively simple mechanism for our observed low polarization for 0420014 is a superposition of components with differing polarization angles as described by Pacholczyk & Gregory (1973). They describe how spectral components of differing Stokes parameters combine to produce a flat-spectrum, depolarized image. This can result in several extrema appearing in a plot of percent polarization versus frequency. This is similar to what is presented here for 0420014, which has nearly equal percent polarizations at 8 and 15 GHz, but a minimum at 12 GHz. Untapered, full-resolution 15 GHz data (Fig. 32) clearly resolves two polarized components similar to those seen by Marscher et al. (2002) . The peak percent polarization in this image is 1.3%.
4.5 Magnetic fields and the Faraday screen
To determine a magnetic field strength from a rotation measure two free parameters must be specified: the electron density and the path length through the Faraday rotating medium. This requires knowledge of the location and nature of the foreground Faraday screen.
Asada et al. (2002) suggest the jet of 3C 273 itself as a possible Faraday rotating medium. They report a rotation measure gradient across the jet of 3C 273 and attribute this to a helical magnetic field which wraps around the jet. This explains the change in sign of the rotation measure across the jet as the magnetic field points towards or away from the observer due to the twisting of the helix. There are only two beamwidths across the region where the RM gradient is determined, so it is difficult to conclusively resolve such a feature. The quasar 1611+343 (§3.11) is the only AGN presented here where there is just sufficient resolution across the jet to search for such a rotation measure gradient. No rotation measure gradient is apparent transverse to the jet axis in Fig. 17. If the helical field does serve as a Faraday screen then this requires thermal material to be mixed with the relativistic jet itself. If the helical field is also a source of synchrotron radiation then internal Faraday depolarization should also be apparent (Burn, 1966). Faraday rotation measures across a jet of sufficient width to resolve any gradient in rotation measure are therefore required.
The line of sight integrated magnetic field topology can be investigated using the change of slope of the rotation measure plots. A change in sign like that observed for M87 (Zavala & Taylor, 2002) requires the line of sight magnetic field to change by 180∘. A similar sign change was observed for the core of 3C 273 (Zavala & Taylor, 2001). The net magnetic field in the Faraday rotating medium must change across the plane of the sky on projected distances of a few tenths of a parsec to around 5 parsecs.
We now put forth a simple model to explain the observed rotation measures. Upper limits to electron densities are set by the requirement that the optical depth for free-free absorption be less than unity. We assume the path length through the Faraday screen is the same as that seen for the plane of the sky. A temperature of 104 K, suitable for the narrow line region of an AGN, is assumed. Then the electron density (cm-3) required to give an optical depth of one as a function of path length L (cm) is:
| (4) |
This sets an upper of a few times 104 cm-3 to maintain an optical depth less than one, with the Gaunt factor set to unity. This is in line with the densities calculated for narrow line regions in AGN (Osterbrock, 1989; Stauffer & Spinrad, 1979) of 103 cm-3. Setting the electron density to 1000 cm-3 is then a reasonable estimate.
Rotation measures vary from 1000s of rad m-2 in quasar cores and the jet of M87, to a few hundred rad m-2 for quasar jets and the BL Lac objects. These screens may be very different entities, and can vary their electron densities as the level of the ionizing continuum varies. With these caveats in mind let the depth of the Faraday screen be approximately a parsec, and consider RMs in the observer’s frame of 2000 rad m-2 and 200 rad m-2 for the two extremes. Fields of 3 G and 0.3 G, respectively, are needed to account for these rotation measures. Even for M87 fields of less than 40 G (Zavala & Taylor, 2002) can cause the observed RMs under these assumptions. The fields are much less than required for equipartition with the thermal gas surrounding the jet, and cannot confine the jet.
Other than observational conjecture, is there any theoretical basis for a Faraday screen with a depth of a few parsecs? Hardee & Rosen (2002) assign the role of the Faraday screen to the jet of 3C 345, albeit on kiloparsec scales. A layer several jet radii thick, which preserves the helical orientation in the jet, is found to exist over these distances in their simulations. Such a layer would be a few parsecs thick if it existed on milliarcsecond scales. This would require a high-amplitude helical twisting, which does not seem to be present on parsec scales and would in any event destabilize the jet (Hardee, private communication). A mixing layer caused by Kelvin-Helmholtz instabilities (de Young, 2002) has been suggested for the screen put forth in Zavala & Taylor (2002) for the rotation measures in M87 (de Young, private communication). This mixing layer can account for the observed change in the RM slope by the turbulence in such a layer.
The simulations shown in Bicknell, Saxton & Sutherland (2002) and Bicknell (2002), which attempt to explain Compact Symmetric Objects (CSO) may also prove useful. The CSOs are considered frustrated radio galaxies whose jets are disrupted by collisions with dense clouds in their cores. These clouds become ionized as a result of the shocks from the collision, and they can serve as a Faraday screen. The densities in the clouds need to be at least 1000 cm-3 in order to be stable against tidal forces from a supermassive black hole (Bicknell, Saxton & Sutherland, 2002), which agrees with the simple estimates above. These shocked clouds should exhibit free-free absorption at lower frequencies, which should be examined in future observations (Bicknell, Saxton & Sutherland, 2002). A screen of shocked clouds may not be present in every case, but M87 and 3C 120 are two examples where the model appears useful.
Attributing the observed rotation measures in M87 as arising in a shocked cloud gives special meaning to the intrinsic magnetic field vectors. Such a collision is not very disruptive and is likely to be oblique. The B field vectors would then be more or less aligned with the jet flow (Bicknell, private communication). Rotating the E vectors in Fig. 12 by 90∘ does produce vectors parallel to the local jet flow. An explanation is still required for the lack of polarized emission in M87 outside of the area of the RM data. Invoking a high Faraday depth towards the core of a radio galaxy (Rudnick, Jones & Fielder, 1986) accounts for the observed RM without invoking the shocked cloud scenario. A heterogeneous Faraday screen of several 105 rad m-2 would need a region of a lower Faraday depth to allow the rotation measure to be observed. This should require significant freefree absorption against the jet where the Faraday depth is high enough to depolarize the jet.
As components are ejected along a jet they should exhibit similar Faraday rotation effects as they pass behind such shocked clouds. The region 2 mas west of the core of 3C 120 (Gómez et al., 2000) may be such a cloud. Components exhibit variations in their light curve and polarization properties when they pass this feature (Gómez et al., 2000). Polarization monitoring of 3C 120 could conclusively identify this feature as a persistent source of Faraday rotation via a long-lived, dense cloud. Gómez et al. did report a high rotation measure towards this component, but it was unfortunately based on only two frequencies.
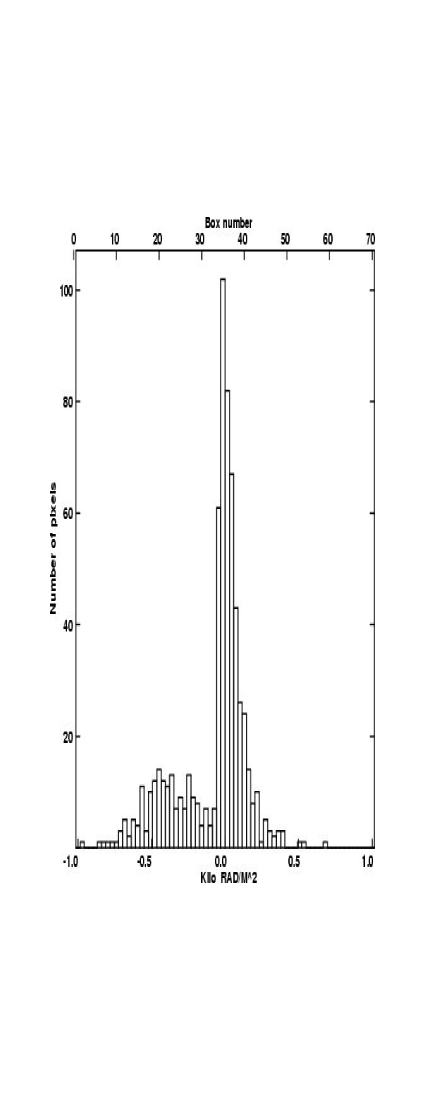
Finally, we consider the hot gas which confines the narrow line region clouds (Elvis, Briel, & Henry, 1983) as a potential Faraday screen. This turbulent hot gas will cause the radiation traversing the region to experience a random walk magnetic field orientation This will cause the RM derived magnetic field strength to underestimate the true field by a factor of where N is the number of cells (O’Dea, 1989). There are two predictions which can be used to test this scenario. First, the rotation measure distribution should have a Gaussian distribution with zero mean and a width given by a standard deviation . This is expected for any random walk process. Second, should a counter jet be detected in polarized flux it should have a higher rotation measure than the jet oriented towards the observer. The higher RM results from the longer path length through the Faraday screen which the counter jet is seen through. Unfortunately, we still await the detection of a polarized counter jet on parsec scales.
The RM distribution can be measured and examined for a sign of the random walk Gaussian signature. Most of our sources have their rotation measure extent covered by just a few beams, so it is difficult to place conclusive results on the histograms. The quasar 1611+343 does have a broad jet, and provides the best sampling of the RM maps shown here. The histogram is shown in Fig. 33, and is distinctly non-Gaussian.
Rotation measure changes in 3C 279 over 6 months to 1.5 years also argue against the intercloud region as a Faraday screen. It is difficult to reconcile changes on such short timescales for a medium 100’s of parsecs across.
Although we invoke a mixing layer/thin skin Faraday screen for the source of the observed rotation measures, a turbulent medium may play a role in some cases. M87 could conceivably have its rotation measure distribution derived from such a screen. This is especially true if we consider the observed polarization in the jet to be seen through a window in an otherwise very depolarizing screen (Rudnick, Jones & Fielder, 1986).
5 Conclusions
Parsec-scale rotation measures are presented for 9 quasars, 4 BL Lacertae objects, and 3 radio galaxies. Rotation measures in the cores of these AGN are independent of core dominance. The four BL Lac objects have a median core rotation measure of 440 rad m-2, systematically less than the median rotation measure of 1500 rad m-2 for quasar cores. A core rotation measure could be determined for one radio galaxy only due to depolarization at 8 and 12 GHz for these galaxies. An anti-correlation of core rotation measure with percent polarization is consistent with depolarization by a gradient in rotation measure in AGN cores. This is also in agreement with the observation that quasar rotation measures decrease rapidly beyond a projected distance of 10 parsecs from the core. A decreasing rotation measure gradient proceeding from the core along the jet also explains the time variation on rotation measure and percent polarization for the quasar 3C 279.
BL Lacertae is shown to have a variable rotation measure in its core and jet, consistent with a Faraday screen intrinsic to this AGN. The rotation measures in the jets of BL Lacertae and the BL Lac object 1823+568 result in substantial turns in polarization angles at frequencies less than 15 GHz. Therefore, results of magnetic vector orientations in the jets of BL Lac objects determined at these frequencies without VLBI-scale rotation measures are called into question. Rotation measures in the jets of BL Lac objects are comparable to those seen in the jets of quasars. This further blurs the distinction between BL Lacertae objects and quasars.
Depolarization in the quasar 0420014 is attributed to polarized components which just begin to be resolved at 15 GHz. The combination of different polarization angles in these components results in the observed depolarization and lack of agreement to a law for this quasar.
Magnetic fields of 40 G or less can account for the observed rotation measures for path lengths through the Faraday rotating medium of 1 parsec and electron densities cm-3. The line of sight magnetic field reverses across projected distances on the sky of a few parsecs or less.
References
- Asada et al. (2002) Asada, K., Inoue, M., Uchida, Y., Kameno, S., Fujisawa, K., Iguchi, S., & Mutoh, M. 2002, PASJ, 54, L39
- Bicknell, Saxton & Sutherland (2002) Bicknell, G. V., Saxton, C. J., & Sutherland, R. S. 2002, Publ. Astro. Soc. Aus., in press
- Bicknell (2002) Bicknell, G. 2002 in NewAR, Relativistic jets in the CHANDRA and XMM era, eds. G. Brunetti, D. E. Harris & R. Sambruna (Amsterdam: Elsevier) in press
- Brindle et al. (1986) Brindle, C., Hough, J. H., Bailey, J. A., Axon, D. J., & Hyland, A. R. 1986, MNRAS, 221, 739
- Burn (1966) Burn, B. J. 1966, MNRAS, 133, 67
- Cooper & Price (1962) Cooper, B. F. C. & Price, R. M. 1962, Nature, 195, 1084
- Cotton et al. (1984) Cotton, W. D., Geldzahler, B. J., Marcaide, J. M., Shapiro, I. I., Sanroma, M., & Rius, A. 1984, ApJ, 286, 503
- de Young (2002) de Young, D. S. 2002, The physics of extragalactic radio sources, by David S. De Young (Chicago, Ill. : University of Chicago Press)
- Denn, Mutel, & Marscher (2000) Denn, G. R., Mutel, R. L., & Marscher, A. P. 2000, ApJS, 129, 61
- Elvis, Briel, & Henry (1983) Elvis, M., Briel, U. G., & Henry, J. P. 1983, ApJ, 268, 105
- Faraday (1845) Faraday, M. 1933 in Faraday’s Diary, ed. T. Martin (London: G. Bell & Sons), 264
- Felten (1996) Felten, J. E. 1996, in ASP Conf. Ser. 88, Clusters, Lensing, and the Future of the Universe, ed. V. Trimble & A. Reisenegger (San Francisco: ASP), 271
- Gabuzda, Pushkarev, & Cawthorne (2000) Gabuzda, D. C., Pushkarev, A. B., & Cawthorne, T. V. 2000, MNRAS, 319, 1109
- Gardner & Whiteoak (1966) Gardner, F. F. & Whiteoak, J. B. 1966, ARA&A, 4, 245
- Gómez et al. (2000) Gómez, J. L., Marscher, A. P., Alberdi, A., Jorstad, S. G., & García-Miró, C. 2000, Science, 289, 2317
- Hardee & Rosen (2002) Hardee, P. E. & Rosen, A. 2002, ApJ, 576, 204
- Hartman et al. (1999) Hartman, R. C. et al. 1999, ApJS, 123, 79
- Jorstad et al. (2001) Jorstad, S. G., Marscher, A. P., Mattox, J. R., Wehrle, A. E., Bloom, S. D., & Yurchenko, A. V. 2001, ApJS, 134, 181
- Kellermann et al. (1998) Kellermann, K. I., Vermuelen, R. C., Zensus, J. A., & Cohen, M. H. 1998, AJ, 115, 1295
- Marscher et al. (2002) Marscher, A. P., Jorstad, S. G., Mattox, J. R., & Wehrle, A. E. 2002, ApJ, 577, 85
- O’Dea (1989) O’Dea, C. P. 1989, A&A, 210, 35
- Osterbrock (1989) Osterbrock, D. E. 1989, Astrophysics of Gaseous Nebulae and Active Galactic Nuclei (Mill Valley: University Science Books)
- Pacholczyk & Gregory (1973) Pacholczyk, A. G. & Gregory, S. A. 1973, MNRAS, 161, 31
- Reynolds, Cawthorne, & Gabuzda (2001) Reynolds, C., Cawthorne, T. V., & Gabuzda, D. C. 2001, MNRAS, 327, 1071
- Rudnick, Jones & Fielder (1986) Rudnick, L., Jones, T. W. & Fielder, R. 1986, AJ, 91, 1011
- Shepherd (1997) Shepherd, M. C. 1997, in ASP Conf. Ser. 125, Astronomical Data Analysis Software and Systems VI, ed. G. Hunt & H. E. Payne (San Francisco: ASP), 77
- Shepherd, Pearson & Taylor (1994) Shepherd, M. C., Pearson, T. J., & Taylor, G. B. 1994, BAAS, 26, 987
- Stauffer & Spinrad (1979) Stauffer, J. & Spinrad, H. 1979, ApJ, 231, L51
- Stickel, Fried, & Kuehr (1993) Stickel, M., Fried, J. W., & Kuehr, H. 1993, A&AS, 98, 393
- Strittmatter et al. (1972) Strittmatter, P. A., Serkowski, K., Carswell, R., Stein, W. A., Merrill, K. M., & Burbidge, E. M. 1972, ApJ, 175, L7
- Taylor (1998) Taylor, G. B. 1998, ApJ, 506, 637
- Taylor (2000) Taylor, G. B. 2000, ApJ, 533, 95
- Taylor & Myers (2000) Taylor, G. B. & Myers, S. T. 2000 VLBA Scientific Memo 26, National Radio Astronomy Observatory
- Taylor, Hough & Venturi (2001) Taylor, G. B., Hough, D. H. & Venturi, T. 2001, ApJ, 559, 703
- van Moorsel, Kemball, & Greisen (1996) van Moorsel, G., Kemball, A., & Greisen, E. 1996, in Astronomical Data Analysis Software and Systems V, ed. G. H. Jacoby & J. Barnes (San Francisco: ASP), 37
- Udomprasert et al. (1997) Udomprasert, P. S., Taylor, G. B., Pearson, T. J., & Roberts, D. H. 1997, ApJ, 483, L9
- Vermeulen et al. (1995) Vermeulen, R. C., Ogle, P. M., Tran, H. D., Browne, I. W. A., Cohen, M. H., Readhead, A. C. S., Taylor, G. B., & Goodrich, R. W. 1995, ApJ, 452, L5
- Wehrle et al. (2001) Wehrle, A. E., Piner, B. G., Unwin, S. C., Zook, A. C., Xu, W., Marscher, A. P., Teräsranta, H., & Valtaoja, E. 2001, ApJS, 133, 297
- Zavala & Taylor (2002) Zavala, R. T. & Taylor, G. B. 2002, ApJ, 566, L9
- Zavala & Taylor (2001) Zavala, R. T. & Taylor, G. B. 2001, ApJ, 550, L147
- Zensus (1997) Zensus, J. A. 1997, ARA&A, 35, 607
| Source | Name | Identification | MagnitudeaaNote that many sources are highly variable. | z | |
|---|---|---|---|---|---|
| (1) | (2) | (3) | (4) | (5) | (6) |
| 0133+476 | DA 55 | Q | 18.0 | 0.86 | 2.22 |
| 0212+735 | Q | 19.0 | 2.37 | 2.69 | |
| 0415+379 | 3C 111 | G | 18.0 | 0.05 | 5.98 |
| 0420014 | Q | 17.8 | 0.92 | 4.20 | |
| 0430+052 | 3C 120 | G | 14.2 | 0.03 | 3.01 |
| 0528+134 | Q | 20.0 | 2.06 | 7.95 | |
| 0923+392 | 4C 39.25 | Q | 17.9 | 0.70 | 10.84 |
| 1228+126 | M87 | G | 9.6 | 0.00 | 2.40 |
| 1253055 | 3C 279 | Q | 17.8 | 0.54 | 21.56 |
| 1308+326 | BL | 19.0 | 1.00 | 3.31 | |
| 1611+343 | DA 406 | Q | 17.5 | 1.40 | 4.05 |
| 1803+784 | BL | 17.0 | 0.68 | 2.05 | |
| 1823+568 | BL | 18.4 | 0.66 | 2.31 | |
| 2005+403 | Q | 19.5 | 1.74 | 2.51 | |
| 2021+614 | G | 19.5 | 0.23 | 2.21 | |
| 2200+420 | BL Lac | BL | 14.5 | 0.07 | 3.23 |
| 2251+158 | 3C 454.3 | Q | 16.1 | 0.86 | 8.86 |
Note. — Col. (1): B1950 source name. Col. (2): Alternate common name. Col. (3): Optical identification from the literature (NED) with Q = quasar, G = radio galaxy, BL = BL Lac object. Col. (4): Optical magnitude from NED. Col. (5) Redshift. Col. (6): Total flux density at 15 GHz measured by Kellermann et al. (1998).
| Frequency | Bandwidth |
|---|---|
| 8.114, 8.209, 8.369, 8.594 | 8 |
| 12.115, 12.591 | 16 |
| 15.165 | 32 |
Note. — Frequencies in GHz, bandwidths in MHz
| Source | Peak | Integ | PeakPOL | |||||
|---|---|---|---|---|---|---|---|---|
| (1) | (2) | (3) | (4) | (5) | (6) | (7) | (8) | (9) |
| 0133+476 | 3736 | 3802 | 50 | -1410 | 0.983 | 1.32 | -4878 | 0.68 |
| 0212+735 | 1844 | 2445 | 41 | -542 | 0.754 | 2.22 | -6155 | -0.14 |
| 3C111 | 1537 | 2263 | 1.8 | -730 | 0.679 | 0.1 | -804 | 1.21 |
| 0420014 | 2644 | 2872 | 6 | 0.921 | 0.23 | 0.59 | ||
| 3C120 | 797 | 2519 | 4 | 2082 | 0.316 | 0.48 | 2209 | -0.26 |
| 0528+134 | 3100 | 3439 | 32 | -163 | 0.901 | 1.03 | -1526 | 0.46 |
| 0923+392 | 7179 | 8959 | 175 | -218 | 0.801 | 2.44 | -630 | 0.003 |
| M87 | 1029 | 1920 | 1.8 | 9563 | 0.536 | 0.2 | 9640 | 0.24 |
| 3C279 | 14650 | 21335 | 1457 | -91.00 | 0.687 | 9.95 | -216 | 0.42 |
| 3C279aaTaylor (1998) | 14070 | 21980 | 1238 | -140 | 0.641 | 8.80 | -332 | 0.31 |
| 3C279bbTaylor (2000) | 19895 | 24766 | 1344 | -310 | 0.803 | 6.76 | -735 | 0.58 |
| 3C279ccZavala & Taylor (2001) | 17500 | 22336 | 700 | -1280 | 0.783 | 4.00 | -3035 | 1.10 |
| 1308+326 | 667 | 1079 | 20 | 113 | 0.618 | 3.00 | 452 | -0.14 |
| 1611+343 | 2692 | 3880 | 58 | -519 | 0.694 | 2.17 | -2989 | 0.29 |
| 1803+784 | 1716 | 2179 | 86 | -201 | 0.788 | 5.03 | -567 | 0.19 |
| 1823+568 | 647 | 829 | 45 | -128 | 0.780 | 6.97 | -353 | 0.32 |
| 2005+403 | 1403 | 2327 | 21 | 668 | 0.603 | 1.50 | 5015 | 1.38 |
| 2021+614 | 1557 | 2187 | 1.5 | 0.712 | 0.1 | 0.60 | ||
| BL Lac | 2029 | 2982 | 56 | -376 | 0.680 | 2.78 | -430 | 0.33 |
| 2251+158 | 5509 | 8442 | 40 | -263 | 0.653 | 0.73 | -910 | 0.48 |
Note. — Col. (1): Source name. Col. (2): Peak flux density (mJy beam-1) Col. (3): Sum of CLEAN components (mJy) Col. (4): Polarized flux density (mJy beam-1) at location of peak Col. (5) Core or maximum jet RM (rad m-2) Col. (6): Core dominance Col. (7): Percent polarization Col. (8): Intrinsic RM Col. (9): 8.112.1 GHz spectral index
| Source | |||||
|---|---|---|---|---|---|
| 1308+326 | 161∘ | 158∘ | 47∘ | 44∘ | |
| 1803+476 | 136∘ | 115∘ | 41∘ | 20∘ | |
| 1823+568 | 33∘ | 25∘ | 15∘ | 7∘ | |
| BL Lac | 174∘ | 56∘ | 25∘ | 37∘ |
Note. — is position angle of the jet, is the EVPA of the core or jet component.