Lyman Break Galaxies and the Star Formation Rate of the Universe at
Abstract
We determine the space density of UV-luminous star-burst galaxies at using deep HST ACS SDSS- (F775W) and SDSS- (F850LP) and VLT ISAAC and band imaging of the Chandra Deep Field South. We find 8 galaxies and one star with to a depth of (an detection in each of the 3 available ACS epochs). This corresponds to an unobscured star formation rate of at , equivalent to for the Lyman break population at (, ). We are sensitive to star forming galaxies at with an effective comoving volume of after accounting for incompleteness at the higher redshifts due to luminosity bias. This volume should encompass the primeval sub-galactic scale fragments of the progenitors of about a thousand galaxies at the current epoch. We determine a volume-averaged global star formation rate of at from rest-frame UV selected star-bursts at the bright end of the luminosity function: this is a lower limit because of dust obscuration and galaxies below our sensitivity limit. This measurement shows that at the star formation density at the bright end is a factor of times less than that determined by Steidel et al. (1999) for a comparable sample of UV selected galaxies at , and so extends our knowledge of the star formation history of the Universe to earlier times than previous work and into the epoch where reionization may have occurred.
keywords:
galaxies: formation – galaxies: evolution – galaxies: starburst – galaxies: high redshift – ultraviolet: galaxies – surveys1 Introduction
How, when, and over what time-scale galaxies formed are questions at the forefront of both observational and theoretical cosmology. In recent years there has been tremendous progress in the study of galaxy formation from an observational perspective. Spectroscopic samples of star-forming galaxies have been detected at progressively higher redshifts: (Cowie et al. 1996); (Steidel et al. 1996); (Hu & McMahon 1996; Steidel et al. 1999); beyond (e.g., Spinrad et al. 1998; Weymann et al. 1998; Hu, McMahon & Cowie 1999; Dawson et al. 2001; Lehnert & Bremer 2003) and now up to (Hu et al. 2002; Kodaira et al. 2003).
Complementing this ground-based spectroscopic work there have been a number of programmes based on the Lyman break “photometric redshift” technique (e.g., Steidel, Pettini & Hamilton 1995). Hubble Space Telescope (HST) imaging with WPC2 and NICMOS has extended such studies to fainter magnitudes than accessible through ground-based spectroscopy (e.g., Madau et al. 1996; Dickinson et al. 2000; Thompson, Weymann & Storrie-Lombardi 2001). From the results of this work, great progress has been made in reconstructing “the star formation history of the Universe” – the evolution of the comoving volume-averaged star formation rate (as shown on the ‘Madau-Lilly’ diagram: Lilly et al. 1996; Madau et al. 1996) over the redshift range .
Here we describe a survey that extends such work to . A survey may be considered useful for selecting candidate star forming galaxies if it satisfies the following primary criteria: (i) it can distinguish galaxies from lower redshift objects; (ii) it is deep enough to reach star formation rates characteristic of this population; (iii) the volume is sufficient to encompass a statistically meaningful sample.
In this paper we show that public data from the Advanced Camera for Surveys (ACS, Ford et al. 2002) on HST, released as part of the public Great Observatories Origins Deep Survey (GOODS – Dickinson & Giavalisco 2002111see http://www.stsci.edu/ftp/science/goods/) programme, is of sufficient depth and volume to detect very high redshift galaxies, and that colour selection should reject less distant objects. We use this data set to examine the space density of UV-luminous starburst galaxies at . Observational evidence of the Gunn-Peterson effect in QSOs (Becker et al. 2001) suggests that this is the epoch of reionization, where starlight may for the first time dominate the Universe – although recent results on the polarization of the cosmic microwave background from the WMAP satellite indicate that the onset of ionization may have been at even higher redshift (Kogut et al. 2003). Using deep imaging by ACS through its SDSS- and - filters, we identify a sample of objects which are likely to be Lyman break star forming galaxies at . From the UV continuum longward of Å detected in the -band, we place a lower limit on the global star formation rate at and hence extend the Madau-Lilly diagram to early epochs.
Throughout we adopt the now widely accepted ‘concordance’ cosmology: a -dominated, flat Universe with , and . The HST/ACS magnitudes in this paper are quoted in the AB system (Oke & Gunn 1983).
2 Observations
2.1 The ACS data
We have analysed the first three epochs of GOODS data from the Chandra Deep Field South (CDFS) taken with HST/ACS222available from ftp://archive.stsci.edu/pub/hlsp/goods/. Each epoch of data comprises a half-orbit -band image taken through the F775W filter (1040 sec, split into 2 for cosmic ray rejection) and a full-orbit -band image observed with the F850LP filter (2010 sec, split into 4). We use the v0.5 release of the reduced data.
The released data set has been pipeline-processed for dark and bias subtraction and flat-fielding, and known hot pixels, bad columns and other cosmetic defects flagged in a data quality file. The post-pipeline images are sky-subtracted,“drizzled”(Fruchter & Hook 2002) and corrected for geometric distortion. Cosmic rays were also identified and masked.
We use the zero-points for AB magnitudes determined by the GOODS team: where the zeropoints for -band (F775W) and -band (F850LP) are and respectively. We have corrected for the small amount of foreground Galactic extinction toward the CDFS using the COBE/DIRBE & IRAS/ISSA dust maps of Schlegel, Finkbeiner & Davis (1998). The optical reddening is , equivalent to extinctions of & .
2.2 Construction of the catalogues
Candidate selection for all objects in the field was performed using version 2.2.2 of the SExtractor photometry package (Bertin & Arnouts 1996). As we are searching specifically for objects which are only securely detected in , with little or no flux in the -band, fixed circular apertures in diameter were trained in the -image and the identified apertures were used to measure the flux at the same spatial location in the -band image, running SExtractor in two-image mode. For object identification, we demanded at least 5 contiguous pixels above a threshold of per pixel () on the drizzled data (with a pixel scale of 005 pixel-1). From the output of SExtractor, we create a sub-catalogue of all objects brighter than mag, which corresponds to an detection in each epoch.
In the compilation of the catalogues a number of ‘figure-eight’ shaped optical reflections and diffraction spikes near bright stars were masked, as was the gap between the two ACS CCDs and its vicinity in each tile. This means that the survey area is non-contiguous.
Excluding the masked regions, the total survey area in the 15 tiles of CDFS is 146 arcmin2. In this region, we detect 10728 sources in the -band brighter than (our cut for the F850LP image from each individual epoch). The IRAF ‘Artdata’ package was used to create artificial objects of known magnitude and we confirmed that we recover 95 per cent of such objects at the magnitude limit of our catalogue.
3 Candidate galaxies
3.1 Redshift Discrimination
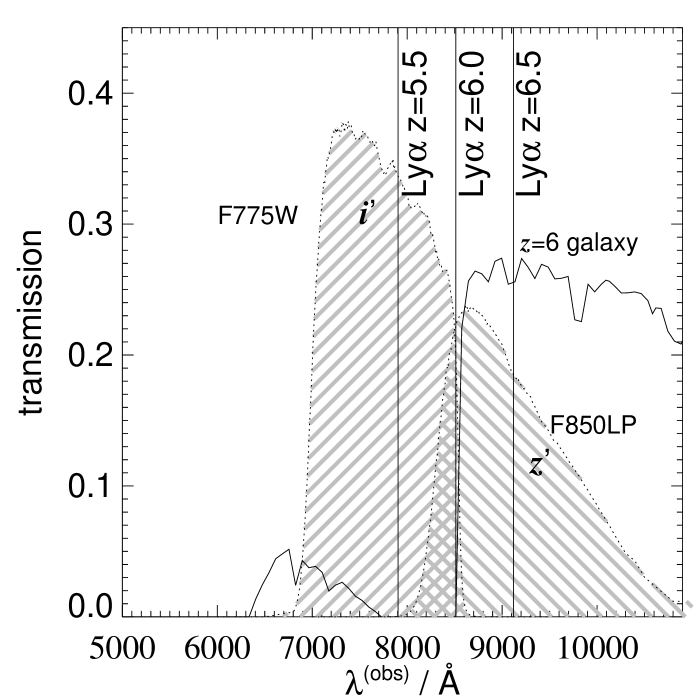
In order to select galaxies, we use the Lyman break technique pioneered at from the ground by Steidel and co-workers and using HST by Madau et al. (1996). The usual Lyman break technique at involves three filters: one below the Lyman limit ( Å), one in the Lyman forest region and a third longward of the Lyman- line ( Å). At higher redshifts, we use just two filters, since at the integrated optical depth of the Lyman- forest is . Hence the continuum break at the wavelength of Lyman- is large, as is illustrated in Figure 1, and the shortest-wavelength filter below the Lyman limit becomes redundant. Thus provided one works at a sufficiently-high signal-to-noise ratio, -band drop-outs can be safely identified through detection in a single redder band (i.e., SDSS-). This has been elegantly shown by Fan and the SDSS collaboration in the detection of quasars using the - and -bands alone (Fan et al. 2001). The sharp sides of the SDSS filters help in clean selection using the photometric redshift technique.
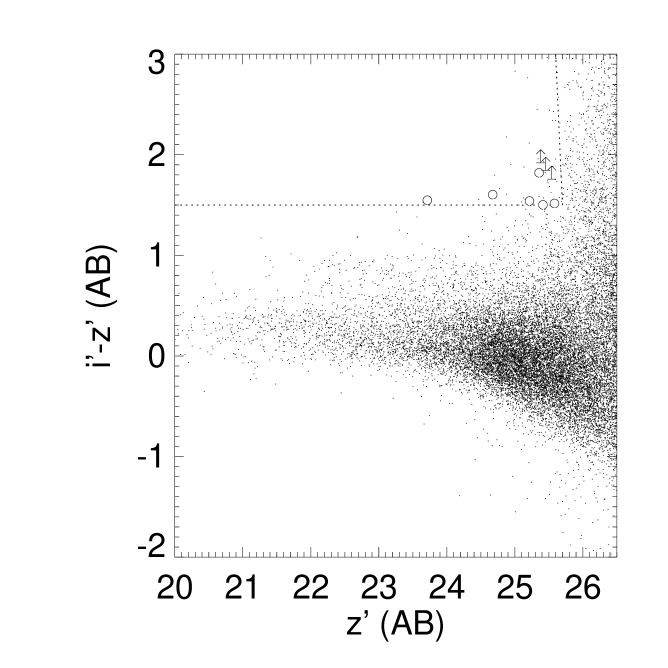
In Figures 2 & 3 we illustrate how the use of a colour cut of can be used to select objects with , and we have 9 at . Objects satisfying our selection criteria in any of the three epochs were gathered into a preliminary catalogue. The flux of these objects in the three epochs was averaged for each waveband, and those objects still satisfying the criteria and in the combined data set were selected. A number of objects appearing in catalogs generated by the SExtractor software were identified by eye as different regions of the same extended source (visible in the ACS F606W -band or F775W -band images) and eliminated from the final selection. The 9 remaining objects satisfying our selection criteria are detailed in Table 1.
3.2 Interlopers at Different Redshifts
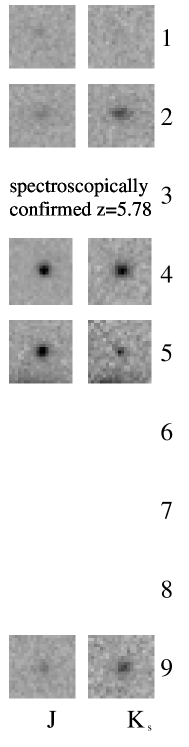
Using our colour-cut criterion alone may also select elliptical galaxies at (as shown by Figure 2), the Extremely Red Object (ERO) population (e.g., Cimatti et al. 2002). Another potential source of contamination are Galactic L- or T-dwarf low-mass stars (e.g., Hawley et al. 2002). We can guard against these lower-redshift interlopers by considering the near-infrared colours. Deep and band observations of the ACS survey field have been obtained with ISAAC on VLT, and reduced data from this ESO Imaging Survey has also been publically released as part of the GOODS programme333see http://www.eso.org/science/goods/releases/20020408/. As Figure 4 illustrates near-infrared colours effectively discriminate the ERO population from high redshift objects. Of the five candidates satisfying our selection criteria for which such data is available, one (object 2) is detected in F606W -band () and has colours consistent with being an ERO contaminant. All other candidates have (our detection limit), although object 9 also has red near-IR colours. Object 5 has a colours which suggests that it is likely to be a low mass star: & (an L- or T-dwarf). Comparison with the sample in Hawley et al. (2002) indicates a spectral type around T3. However, of the remaining objects for which no reduced infrared data is yet available, one is now confirmed as a high redshift object (see ‘Note Added in Proof’) and the others are all fully resolved as shown in Figure 5. The contamination rate would thus appear to be about 25 per cent.


3.3 Limiting Star Formation Rates
We are sensitive to objects above and in principle could identify objects out to where the Lyman- line leaves the filter. The rapid falloff in sensitivity of the ACS detectors above 9000 Å, however, combined with the transition of the Lyman- break through the filter and the resulting incomplete coverage of that filter, means our sensitivity to star formation drops rapidly past , and renders us unlikely to detect anything past (Figure 6). The effect of luminosity-weighting of the redshift range also affects our effective survey volume, and we quantify this in Section 4.1.
The observed luminosity function of Lyman break galaxies (LBGs) around Å is at and at , from Steidel et al. (1999), with a faint end slope and normalization . If there is no evolution in the luminosity function from (as is found to be the case at ) this would predict an apparent magnitude of for an at . Thus our complete catalogue of would include galaxies down to at if there is no evolution in the LBG luminosity function.
The relation between the flux density in the rest-UV around Å and the star formation rate ( in ) is given by from Madau, Pozzetti & Dickinson (1998) for a Salpeter (1955) stellar initial mass function (IMF) with . This is comparable to the relation derived from the models of Leitherer & Heckman (1995). However, if the Scalo (1986) IMF is used, the inferred star formation rates are a factor of higher for a similar mass range. From Steidel et al. (1999), the characteristic star formation rate at the knee of the luminosity function, , is for . Figure 6 shows our limiting star formation rate as a function of redshift, inferred from the rest-frame UV flux in the -filter. We account for the filter transmission, and the blanketting effects of the intervening Lyman- forest. We introduce small -corrections to Å from the observed rest-wavelengths longward of Lyman- redshifted into the -band: we consider both a spectral slope (where ) which is appropriate for an unobscured starburst (flat in ), and also a redder slope of (approriate for mean reddening of the Lyman break galaxies, Meurer et al. 1997). At limiting magnitude of , we can detect unobscured star formation rates as low as at and at for spectral slope . Our colour cut should remove most galaxies at .

3.4 Candidate Objects
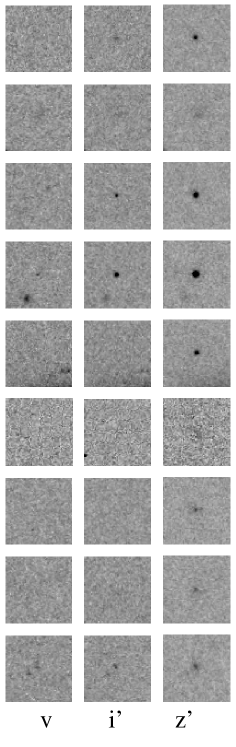
Using the selection criteria described above we have identified 7 candidate galaxies photometrically selected to lie at . These (along with the probable star and ERO included for comparison) are described in Table 1 and cut-out images of each object in the , , (F606W) and (where available) and bands are presented in Figure 7.
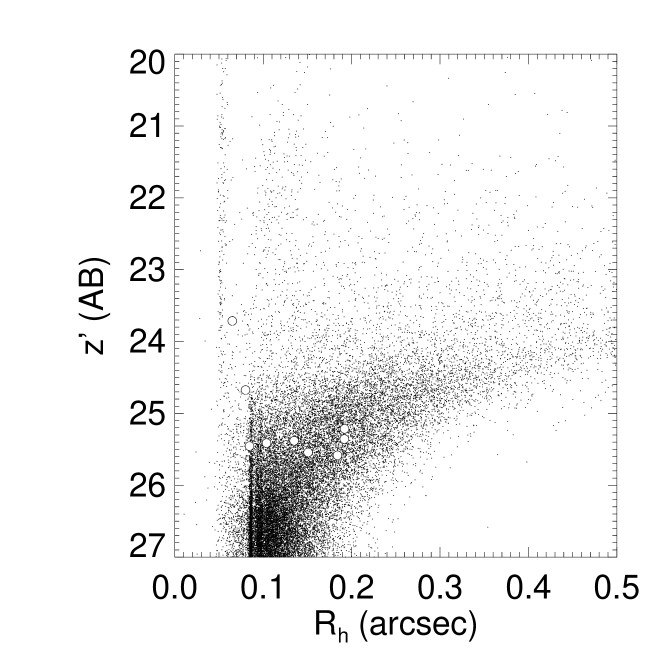
As Figure 5 illustrates most of our objects are spatially resolved in the HST/ACS images (6 of the 9). Of the three compact objects, object 5 has the colours of an L- or T-dwarf star. We note that object 4 is almost 1 magnitude brighter than the next brightest object and lies close to the FWHM stellar locus, and is thus likely to be an AGN.
| ID | RA | Declination | SFR | ||||||
|---|---|---|---|---|---|---|---|---|---|
| (J2000) | (J2000) | arcsec | |||||||
| 1 | 3h32m4000 | 27°48′150 | 25.41 0.07 | 26.91 0.22 | 1.50 0.23 | 0.90 0.15 | 0.72 0.25 | 010 | 17.1 |
| 2 | 3h32m3464 | 27°47′209 | 25.58 0.08 | 27.09 0.26 | 1.51 0.27 | 1.94 0.10 | 1.82 0.07 | 018 | 14.7 |
| 3 | 3h32m2559 | 27°55′484 | 24.67 0.03 | 26.27 0.13 | 1.60 0.13 | — | — | 007 | 33.8 |
| 4 | 3h32m1818 | 27°47′465 | 23.71 0.01 | 25.26 0.05 | 1.54 0.05 | 1.72 0.02 | 1.33 0.03 | 006 | 82.0 |
| 5 | 3h32m3880 | 27°49′536 | 25.45 0.08 | 3.12 0.09 | 0.22 0.02 | 007 | 16.5 | ||
| 6 | 3h32m0648 | 27°48′466 | 25.35 0.07 | 27.17 0.28 | 1.82 0.29 | — | — | 019 | 18.1 |
| 7 | 3h32m3319 | 27°39′492 | 25.38 0.07 | — | — | 013 | 17.7 | ||
| 8 | 3h32m2377 | 27°40′378 | 25.54 0.08 | — | — | 015 | 15.2 | ||
| 9 | 3h32m1818 | 27°46′161 | 25.21 0.06 | 26.75 0.19 | 1.54 0.20 | 1.88 0.11 | 2.15 0.10 | 019 | 20.6 |

4 Global Star Formation at
4.1 The Survey Volume
Galaxies in the range would be selected by our colour-cut provided they are sufficiently luminous. However, in practice we are sensitive over a smaller range of redshifts, because galaxies become progressively fainter at higher redshift, and so an ever smaller fraction of them are able to satisfy the magnitude limit of . There are three main reasons for this:
-
1.
The selected galaxies lie primarily on the steep exponential cut-off of the luminosity function (brighter than for a no-evolution model), so small changes in the absolute magnitude limit with redshift will greatly affect the number of galaxies brighter than the limit.
-
2.
Another effect is the -correction (Section 3.3): as redshift increases, the -band samples light in the rest-frame of the galaxies at wavelengths that are increasingly far to the blue of 1500 Å, where the LBGs’ luminosity function was calculated. This -correction makes higher redshift galaxies fainter (as LBGs are red, with ), and therefore less likely to satisfy the magnitude limit.
-
3.
At redshifts , Lyman- absorption from the forest enters the -band and makes galaxies fainter still, as there is incomplete coverage of the filter by the continuum longward of Lyman-.
We have followed the approach of Steidel et al. in calculating the effect of this luminosity bias on our sample of LBGs. We compute an effective survey volume using
where is the probability of detecting a galaxy at redshift and apparent magnitude , and is the comoving volume per unit solid angle in a slice at redshift . We integrate over the magnitude range we are sensitive to, and over the redshift range from our colour selection. We calculate that for a spectral slope of (i.e., flat in ) the effective comoving volume is 40 per cent the total volume in the range (i.e., equivalent to ). For our 146 arcmin2 survey area (after excluding the unreliable regions close to the CCD chip gaps) this is a comoving volume of . For a redder spectral slope of (the average of the LBGs, Meurer et al. 1997) the effective volume is 36 per cent of the total.
Since our aim is to investigate the high-redshift progenitors of present-day normal galaxies we must survey a comoving volume at sufficient to encompass many galaxies by the current epoch, in order to reduce the effects of cosmic variance. From local surveys, the number-density of galaxies is (Loveday et al. 1992). Hence, the comoving volume occupied by the progenitors of a present-day galaxy is . Our colour selection surveys an effective comoving volume of . Thus in principle, assuming the data reaches sufficient depth, we could detect the progenitors of present-day galaxies in the CDFS survey field.
Since significantly fewer objects than this have been identified in this work we are able to conclude that at the ancestors of galaxies have continuous unobscured star formation rates lower than per galaxy over .
4.2 The Star Formation Rate at : Lower limits and Caveats
Our selection criteria have identified 6 candidate star-forming galaxies with 5.6, (excluding the probable star, the ERO and the potential AGN with nominal SFRs of 17, 15 and 82 respectively). These have an integrated star formation rate of (where the error is based on Poisson statistics), giving a comoving volume-averaged star formation density between and of .
This value is compared to global star-formation rates found at lower redshift in Figure 8, reproduced from Steidel et al. (1999) and recalculated for our cosmology and higher limiting luminosity. It appears that the comoving star formation rate (based on the bright end of the UV luminosity function) was 6 times less at than at . The interpretation of this result, however, depends on several considerations.
Firstly, the star formation densities plotted have not been corrected for dust extinction within the galaxies in question. Although this will reduce the observed UV flux, and hence the implied star formation rate, the method used to select galaxies (the Lyman break technique) has been consistently applied at all redshifts above . Thus equivalent populations should be observed at all redshifts and the resulting dust correction will alter the normalization of all the data points in the same way if there is no evolution in the extinction.
Secondly, previous authors have integrated the star formation density over the luminosity function for their objects down to star formation rates of 0.1 even if these SFRs have not been observed. We prefer to plot what we actually observe and not to extrapolate below the limit of our observations. If the luminosity function is extended down to then the global SFR is increased by a factor of for .
Furthermore, Lanzetta et al. (2002) note that at high redshifts the effects of cosmological surface dimming of objects can lead to failure to detect dispersed regions of low star formation and thus to an underestimation of the total star formation density when calculations are based purely on compact and intense regions of high star formation.
Since these potential corrections to our data are expected to increase the volume-averaged star formation density, the value quoted above should be considered a firm lower limit rather than an absolute determination. Combining this work with planned deeper HST/ACS observations in the - and -filters, such as the Ultra Deep Field, will enable fainter magnitudes to be probed and allow the slope of the luminosity function to be determined (e.g., Yan et al. 2003), further constraining the integrated star formation rate and associated contribution to the UV background.
5 Conclusions
We have determined the space density of UV-luminous star-burst galaxies at using deep HST ACS SDSS- (F775W) and SDSS- (F850LP) and VLT ISAAC - and - band imaging of the Chandra Deep Field South from the GOODS survey. The Lyman Break technique was used to identify 7 candidate high redshift objects, of which one may be an AGN. We reach an unobscured star formation rate of at , equivalent to for the Lyman break population at over a comoving volume of – which should encompass the progenitors of about a thousand galaxies at the current epoch. It appears that the comoving star formation rate (based on the bright end of the UV luminosity function above ) was 6 times less at than at . These results have used to determine a lower bound on the integrated volume averaged global star formation rate at . Hence we have been able to extrapolate the star formation history of the Universe to earlier epochs than the existing Madau-Lilly diagram. These observations provide an important lower limit on contribution of galaxies to the UV background over a redshift range that some recent observational evidence suggests is the epoch of reionization.
Note Added in Proof
We have recently obtained spectroscopy on a subset of the objects described in this paper using the DEIMOS instrument on the Keck II telescope, in collaboration with Prof. Richard Ellis (Caltech) and Dr. Patrick McCarthy (OCIW). While analysis of this data is ongoing, one of the objects (Object 3) shows Ly- in emission at a redshift of , and we report this spectrum in Bunker et al. (2003, astro-ph/0302401) submitted to MNRAS (Letters).
ACKNOWLEDGMENTS
ERS acknowledges a Particle Physics and Astronomy Research Council (PPARC) studentship supporting this study. We are extremely grateful to the referee, Kurt Adelberger, for his constructive comments (particularly on the issue of the luminosity-weighted effective volume of the survey). We thank Richard Ellis, Andrew Firth, Simon Hodgkin, Ofer Lahav, Pat McCarthy and Rob Sharp for useful discussions. This paper is based on observations made with the NASA/ESA Hubble Space Telescope, obtained from the Data Archive at the Space Telescope Science Institute, which is operated by the Association of Universities for Research in Astronomy, Inc., under NASA contract NAS 5-26555. These observations are associated with proposals #9425 & 9583 (the GOODS public imaging survey). We are grateful to the GOODS team for making their reduced images public – a very useful resource. The archival GOODS/EIS infrared images are based on observations collected at the European Southern Observatory, Chile, as part of the ESO Large Programme LP168.A-0485(A) (PI: C. Cesarsky), and ESO programmes 64.O-0643, 66.A-0572 and 68.A-0544 (PI: E. Giallongo).
References
- [Becker et al. 2001] Becker R. H. et al., 2001, AJ, 122, 2850
- [Bertin & Arnouts 1996] Bertin E., Arnouts S., 1996, A&AS, 117, 393
- [Bunker et al. 2003] Bunker A. J., Stanway E. R., Ellis R. S., McMahon R. G., McCarthy P. J., 2003, preprint (astro-ph/0302401), submitted to MNRAS (Letters)
- [Cimatti et al. 2002] Cimatti A. et al., 2002, A&A, 381, L68
- [Coleman, Wu & Weedman 1980] Coleman G. D., Wu C.-C., Weedman D. W., 1980, ApJS, 43, 393
- [Connolly et al. 1997] Connolly A. J., Szalay A. S., Dickinson M., SubbaRao M. U., Brunner R. J., 1997, ApJ, 486, L11
- [Cowie et al. 1996] Cowie L. L., Songaila A., Hu E. M., Cohen J. G., 1996, AJ, 112, 839
- [Dawson et al. 2001] Dawson S., Stern D., Bunker A., Spinrad H., Dey A., 2001, AJ, 122, 598
- [Dickinson et al. 2000] Dickinson M. et al., 2000, ApJ, 531, 624
- [Dickinson & Giavalisco 2002] Dickinson M., Giavalisco M., 2002, in Bender R., Renzini A., eds., ESO Astrophysics Symposia Series, The Mass of Galaxies at Low and High Redshift, Springer-Verlag, Berlin, p. 324
- [Fan et al. 2000] Fan X. et al., 2000, AJ, 122, 2833
- [Ford et al. 2002] Ford H. C. et al., 2002, BAAS, 200.2401
- [Fruchter & Hook 2002] Fruchter A., Hook R., 2002, PASP, 114, 144
- [Hawley et al. 2002] Hawley S. L. et al., 2002, AJ, 123, 3409
- [Hu & McMahon 1996] Hu E. M., McMahon R. G., 1996, Nature, 382, 281
- [Hu, McMahon & Cowie 1999] Hu E. M., McMahon R. G., Cowie L. L., 1999, ApJ, 522, L9
- [Hu et al. 2002] Hu E. M., Cowie L. L., McMahon R. G., Capak P., Iwamuro F., Kneib J.-P., Maihara T., Motohara K., 2002, ApJ, 568, L75
- [Kodaira et al. 2003] Kodaira K. et al., 2003, preprint, (astro-ph/0301096)
- [Kogut et al. 2003] Kogut A., et al., 2003, preprint (astro-ph/0302213)
- [Koornneef 1983] Koornneef J., 1983, A& A, 128, 84
- [Lanzetta et al. 2002] Lanzetta K. M., Yahata N., Pascarelle S., Chen H.-W., Fernández-Soto A., 2002, ApJ, 570, 492
- [Lehnert & Bremer 2003] Lehnert M. D., Bremer M., 2003, preprint (astro-ph/0212431)
- [Leitherer & Heckman 1995] Leitherer C., Heckman T. M., 1995, ApJS, 96, 9
- [Lilly et al. 1996] Lilly S. J., Le Fèvre O., Hammer F., Crampton D., 1996, ApJ, 460, L1
- [Loveday et al. 1992] Loveday J., Peterson B. A., Efstathiou G., Maddox S. J., 1992, ApJ, 390, 338
- [Madau et al. 1996] Madau P., Ferguson H. C., Dickinson M. E., Giavalisco M., Steidel C. C., Fruchter A., 1996, MNRAS, 283, 1388
- [Madau, Pozzetti & Dickinson 1998] Madau P., Pozzetti L., Dickinson M., 1998, ApJ, 498, 106
- [Meurer et al. 1997] Meurer G, R., Heckman T. M., Lehnert M. D., Leitherer C., Lowenthal J., 1997, AJ, 114, 54
- [Oke & Gunn 1983] Oke J. B., Gunn J. E., 1983, ApJ, 266, 713
- [Salpeter 1955] Salpeter E. E., 1955, ApJ, 121, 161
- [Scalo 1986] Scalo J. M., 1986, Fund. Cosmic Phys., 11, 1
- [Schlegel, Finkbeiner & Davis 1998] Schlegel D. J., Finkbeiner D. P., Davis M., 1998, ApJ, 500, 525
- [Spinrad et al. 1998] Spinrad H., Stern D., Bunker A., Dey A., Lanzetta K., Yahil A., Pascarelle S., Fernández-Soto A., 1998, AJ, 116, 2617
- [Steidel, Pettini & Hamilton 1995] Steidel C. C. Pettini M., Hamilton D., 1995, AJ, 110, 2519
- [Steidel et al. 1996] Steidel C. C., Giavalisco M., Pettini M., Dickinson M. E., Adelberger K. L., 1996, ApJ, 462, L17
- [Steidel et al. 1999] Steidel C. C., Adelberger K. L., Giavalisco M., Dickinson M. E., Pettini M., 1999, ApJ, 519, 1
- [Thompson, Weymann & Storrie-Lombardi 2001] Thompson R. I., Weymann R. J., Storrie-Lombardi L. J., 2001, ApJ, 546, 694
- [Weymann et al. 1998] Weymann R. J., Stern D., Bunker A. J., Spinrad H., Chaffee F. H., Thompson R. I., Storrie-Lombardi L. J., 1998, ApJ, 505, L95
- [Yan, Windhorst & Cohen 2003] Yan H., Windhorst R. A., Cohen S., 2003, preprint (astro-ph/0212179)