More lead stars††thanks: Based on observations carried out at the European Southern Observatory (La Silla, Chile; Program 65.L-0354) and at the Observatoire de Haute Provence (operated by CNRS, France)
The standard model for the operation of the s-process in asymptotic giant branch (AGB) stars predicts that low-metallicity ([Fe/H] ) AGB stars should exhibit large overabundances of Pb and Bi as compared to other s-elements. The discovery of the first three such ‘lead stars’ (defined as stars enriched in s-elements with [Pb/hs] , hs being any of Ba, La or Ce) among CH stars has been reported in a previous paper (Van Eck et al., Nature 2001, 412, 793). Five more CH stars (with [Fe/H] ranging from to ) are studied in the present paper, and two of them appear to be enriched in lead (with [Pb/Ce]). The Pb I line at Å is detected and clearly resolved thanks to high-resolution spectra (). The abundances for these two stars (HD 198269 and HD 201626) are consistent with the predictions for the s-process operating in low-metallicity AGB stars as a consequence of the ‘partial mixing’ of protons below the convective hydrogen envelope. Another two stars (HD 189711 and V Ari) add to a growing number of low-metallicity stars (also including LP 625-44 and LP 706-7, as reported by Aoki et al., 2001, ApJ 561, 346) which do not conform to these predictions, however. Variations on the canonical proton-mixing scenario for the operation of the s-process in low-metallicity stars, that could account for these discrepant stars, are briefly discussed.
Key Words.:
Nucleosynthesis, nuclear reactions, abundances – Stars: carbon – Stars: evolution – Stars: Population II1 Introduction
The overabundances of elements heavier than iron observed at the surface of Asymptotic Giant Branch (AGB) stars (Smith & Lambert 1990) clearly indicate that the s-process takes place during the AGB phase in the evolution of low- and intermediate-mass stars (). It is now widely accepted that the neutron exposure required to produce s-elements originates in some partial mixing of protons (PMP) from the envelope down into the C-rich layers resulting from the former intermittent operation of He-burning during thermal pulses. PMP activates the chain of reactions . The s-elements thus produced in the deep interior by successive neutron captures are subsequently brought to the surface by the third dredge-up (3DUP). The mixing scenario has recently received a new impetus from the inclusion in AGB models of mechanisms like overshooting (Herwig et al. 1997) or rotation (Langer et al. 1999) that trigger simultaneously the 3DUP and the PMP. Unfortunately, model predictions at the present time do not agree, neither on the mechanism responsible for the 3DUP or PMP, nor on their physical characteristics, such as their extent into the C-rich layers or the number of pulses required for the 3DUP and PMP to set in (see e.g., Lattanzio 1998). It is therefore of prime importance to devise predictions that may be tested against abundance observations. One such prediction is that stars with metallicities [Fe/H] (where loglog) should exhibit large overabundances of Pb–Bi as compared to lighter s-elements (Pb/Ba ratios as large as 70 are predicted in AGB stars with [Fe/H]; Goriely & Mowlavi 2000). Therefore, if the standard PMP scenario holds, low-metallicity Pb-stars should exist. Such an observation would provide strong support to the state-of-the-art s-process models, provided that a possible r-process origin of Pb be excluded from the absence of overabundances for r-process elements.
The first three such lead stars (HD 187861, HD 196944 and HD 224959, with metallicities in the range to ) have been reported among CH stars by Van Eck et al. (2001, hereafter Paper I). At the same time, Aoki et al. (2001) found that the slightly more metal-deficient stars LP 625-44 and LP 706-7 are enriched in carbon and s-elements, and yet, with [Pb/Ce] , cannot be considered as lead stars, in disagreement with the standard PMP predictions. To clarify this situation, it is important to derive heavy element abundances for more metal-deficient stars. The present paper adds 5 more stars to this set.
2 The stellar sample
CH stars (Keenan 1942, 1993) are good candidates to investigate the properties of the s-process at low metallicities, since these C-rich stars have very weak lines of the iron-group elements but enhanced lines of the heavy elements (Vanture 1992c).
Late-type and early-type CH stars, that may be distinguished from their spectral types and 12C/13C ratios (late-type CH stars have 12C/13C as compared to for early-type CH stars; Kipper et al. 1996; Aoki & Tsuji 1997), probably form two distinct families, with possibly different evolutionary histories. It has been suggested that the same dichotomy as that observed between intrinsic and extrinsic S stars (Van Eck & Jorissen 2000) may be present among CH stars. In that framework, late-type CH stars would be identified with intrinsic stars (i.e., genuine low-metallicity AGB stars, as confirmed by their relatively bright absolute visual magnitudes; see Table 1), whereas early-type CH stars would be identified with extrinsic stars (i.e., post-mass-transfer binaries, as confirmed by McClure & Woodsworth 1990).
Late-type CH stars might thus be considered as the Population II analogues of N-type carbon stars, and as such, are ideal targets for the present purpose of studying the operation of the s-process at low metallicity. However, not many are known, so that our sample has been extended to early-type CH stars. Being post-mass-transfer binaries, these stars may be considered as the Population II analogues of barium stars. The mass-function distribution of these binaries is consistent with the invisible companion being a white dwarf. The envelope of the giant star has been polluted by C-rich matter transferred from the companion when it was an AGB star. The chemical composition of early-type CH stars should therefore bear the signature of the nucleosynthesis processes operating in low-metallicity AGB stars, provided that chemical fractionation processes similar to those operating in post-AGB stars (Van Winckel et al. 1992; Waters et al. 1992) did not alter the composition of the accreted matter.
| Name | Sp. type | C/O | Obs. | S/N | JD | Rad. vel. (km/s) | Rem. | |||||
| (K) | (-2 451 000) | this work | literature | |||||||||
| Late-type CH | ||||||||||||
| HD 13826 | C4,4 CHa | 8.52 | 3580o,y | 1.07w; | ESO | 44 | 804.739 | |||||
| = V Ari | 2o | |||||||||||
| HD 189711 | C4,3 CHa | 8.37 | 3500d | 1.26n | ESO | 27 | 805.541 | |||||
| Early-type CH | ||||||||||||
| HD 26 | C0,0 CHa | 8.25 | +0.3a | 5170x | 2.2x | 1.1t | ESO | 86 | 804.828 | binary?u | ||
| HD 187861 | C1p,1 CHa | 5320x | 2.4x | 8.0t | ESO | 67 | 804.589 | binary?d | ||||
| HD 198269 | C1,0 CHa | 8.23 | +0.73f | 4800x | 1.3x | 2.0t | OHP | 117 | 779.438 | orbitu | ||
| HD 196944 | wk line GK | 8.4 | 5250m | 1.7m | 0.87m | ESO | 140 | 804.479 | ||||
| str. CHs | ||||||||||||
| HD 201626 | C1,1 CHa | 8.13 | ; 0:c | 5190x | 2.25x | 4.0t | OHP | 102 | 780.449 | orbitu | ||
| HD 224959 | C1,1 CHa | 9.5 | ; | 5200x | 1.9x | 5.0t | ESO | 38 | 804.546 | orbitu | ||
a. Šleivyte & Bartkevičius (1990) and references therein; b. Eggen (1972); c. Wallerstein (1969); d. This work (see Sect. 3); f. Wallerstein & Knapp (1998): Hipparcos parallax; l. Vanture & Wallerstein (1999); m. Zacs et al. (1998); n. Kipper et al. (1996); o. Aoki & Tsuji (1997); q. Knapp et al. (2001); s. Bidelman (1981); t. Vanture (1992b); u. McClure & Woodsworth (1990); v. Duflot et al. (1995); w. Kipper & Kipper (1990); x. Vanture (1992a); y. Ulla et al. (1997); z. Luck & Bond (1982).
3 Observations and data reduction
The present project was conducted during two separate observing runs. A first run at the Observatoire de Haute Provence (August 21–23, 2000) explored at medium resolution two spectral windows containing Pb lines in the optical domain. A subsequent run at the European Southern Observatory (September 16–17, 2000) then secured high-resolution spectra of what appeared to be the most promising – albeit blended on the medium-resolution OHP spectra – Pb line (Pb I nm).
The OHP spectra were obtained on the AURELIE spectrograph (Gillet et al. 1994) mounted on the 1.52m-telescope equipped with a 20481024 EEV CCD (13.5 m pixels). Two different spectral settings were used. The 1200 rules/mm grating (with filter OG 515) delivering a resolution 85 000 in the second order at 720.0 nm was used to explore the 722.897 nm Pb I line detected by Gonzalez et al. (1998) in FG Sge. The 3000 rules/mm holographic grating was then used to explore the 401.963, 405.781 and 406.214 nm Pb I lines with a resolution of 45 000.
The ESO spectra were obtained on the Coudé Echelle Spectrometer (CES) fed by the 3.6 m-telescope using the Very Long Camera (f/12.5) in the blue path, the high-resolution image slicer and the thinned, back-side illuminated CCD#61 (EEV, 2K 4K pixels). A resolution of 135 000 was achieved at the central wavelength of 405.8 nm. The spectra approximately cover the wavelength range 404.5–407.1 nm.
The reduction of the CCD frames followed the usual steps (bias and flat-field corrections, optimal extraction of the stellar spectrum, wavelength calibration) which were performed within the ‘long’ context of the MIDAS software package. The signal-to-noise (S/N) ratio (per pixel) achieved in the extracted spectrum is listed in Table 1 along with the heliocentric radial velocities. Our radial velocities agree with the orbital ephemeris for HD 198269 and HD 201626, but they differ by about 5 km s-1 for HD 224959, for an unknown reason. The newly determined velocity of HD 187861 strongly suggests that this star is a binary since the two available velocities differ by more than 12 km s-1. On the contrary, there is no clear evidence so far that HD 196944 is a binary star. The radial-velocity variations observed for V Ari are not unusual for a SRb variable, and do not necessarily hint at the binary nature of V Ari.
4 Abundance analysis
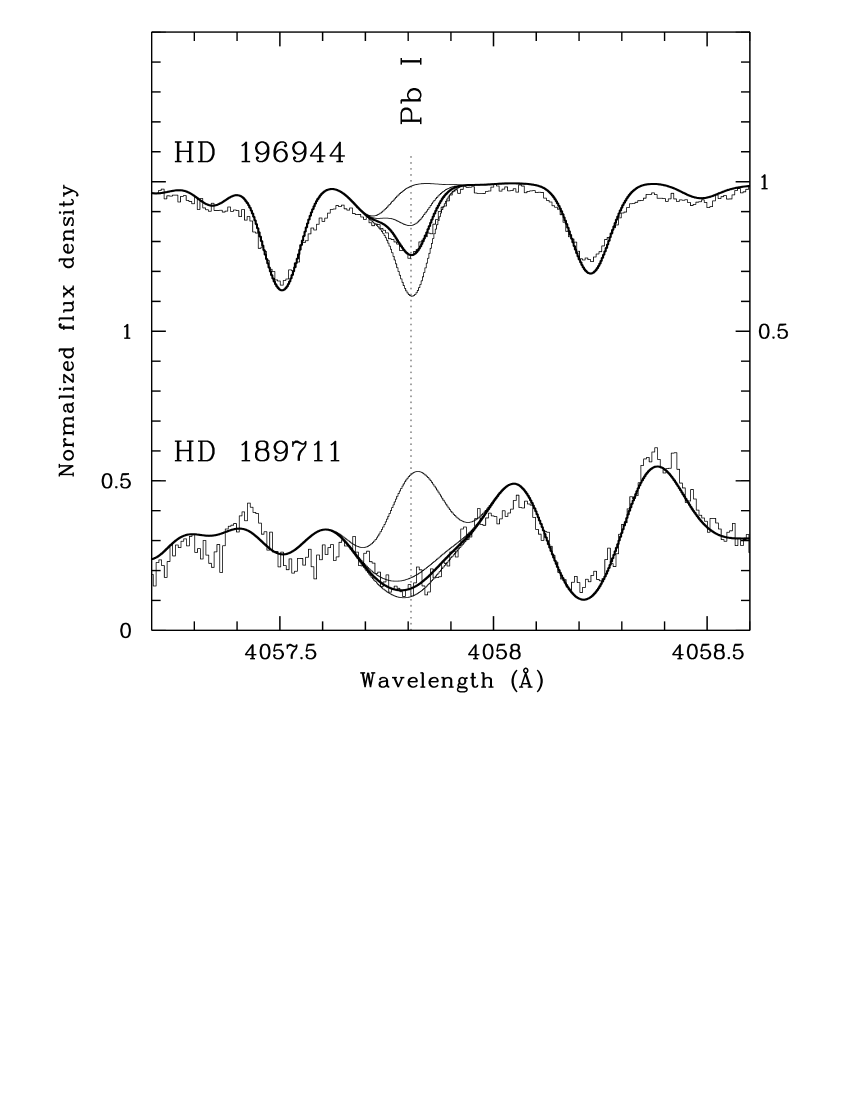
Abundances were derived using the Turbospectrum spectral synthesis package (Alvarez & Plez 1998). MARCS model atmospheres (Gustafsson et al. 1975; Plez et al. 1992 and subsequent updates) matching the atmospheric parameters ( and as listed in Table 1), metallicity and C/O ratio have been used. A microturbulent velocity km s-1 has been adopted for all stars (the available spectral window is too narrow to allow a firm determination of the microturbulence). Larger values for the microturbulence of the two late-type CH stars of our sample (HD 189711 and V Ari) were adopted by Tsuji et al. (1991, respectively 4 km s-1 and 6 km s-1). Such large microturbulent velocities yield, however, a much worse fit of the observed spectrum than the smaller value of 2 km s-1 (see Fig. 1). In any case, Fig. 1 shows that the intensity of the Pb I 405.78 nm line used in the abundance analysis (see below) is almost not altered by a change in the microturbulence velocity from 2 to 6 km s-1. More precisely, if the value of the microturbulence velocity were to be 6 km s-1, the lead abundance would be diminished by less than 0.05 dex.

The C, N and O abundances play an important role in the strength of CN and CH lines present in our spectra. Since the C/O ratios taken from the literature and listed in Table 1 did not provide satisfactory fits to the data, a better match was seeked by adjusting the C abundance on the CN and CH lines present in the considered spectral window. Since the strength of CH lines is also sensitive to O through CO (more than through C/O), an independent estimate of the oxygen abundance is needed. It is provided by the assumption that [O/Fe] = in halo stars. Since our C/O ratios are thus dependent upon this assumed O abundance, they are not listed in Table 1 since they contain some degree of arbitrariness. Estimates of the C, N and O abundances were in fact just needed to provide satisfactory fits to the molecular lines blending the atomic lines of interest. Some mismatch persist, despite our efforts to improve upon existing line lists for CN and CH (Luque & Crosley 1999).
For the star HD 189711, no satisfactory fit whatsoever could be obtained for K as adopted by Kipper et al. (1996). It seems necessary to adopt instead a somewhat larger temperature. The and indices of HD 189711 from Mendoza V & Johnson (1965) further support that conclusion, since the observed indices are not consistent with the values derived from synthetic models at 3100 K, but rather point towards K, as listed in Table 1. Note, however, that the gravity listed Table 1 is not well constrained.
Since the 406.214 nm and 722.897 nm Pb I lines are not visible on our spectra, the Pb abundance was derived using the 405.781 nm Pb I line only, including the contributions from the isotopes 204Pb, 206Pb, 207Pb, 208Pb as well as the hyperfine structure due to 207Pb. The corresponding wavelengths and values are listed in the Appendix. To derive the Pb abundance in the presence of such an isotopic and hyperfine structure requires to make an a priori assumption of the isotopic ratios. Nucleosynthesis calculations predict that the operation of the s-process in a low-mass, low-metallicity AGB star results in highly non-solar isotopic ratios. In a ([Fe/H] = ), M⊙ AGB star, 204Pb: 206Pb: 207Pb: 208Pb = 0.001: 0.026: 0.049: 0.924, and these values have been adopted in the present analysis. Adopting the solar isotopic ratio instead (204Pb: 206Pb: 207Pb: 208Pb = 0.015: 0.236: 0.226: 0.523) typically decreases the Pb abundance by about 0.1 dex, in agreement with the conclusions of Aoki et al. (2002). Fig. 2 presents the effect of changing the Pb abundance by dex on the intensity of the 405.781 nm Pb I line in different stars.
An attempt has been made to derive as well abundances for a few other elements (Fe, Zr, La, Ce, Nd and Sm) with useful lines falling in the 404.5 – 407.1 nm spectral window. The oscillator strengths of these lines have been taken from the VALD library (Kupka et al. 1999). Whenever possible, these oscillator strengths have been confirmed from a fit to the solar spectrum. The comparison with the models presented in Sect. 5 requires the Pb abundances to be normalized by the abundance of an element of the hs group (Ba, La or Ce, where hs stands for ‘heavy-s’), as well as an estimate of the metallicity. Despite the difficulty of this endeavour on a spectral window covering only 3 nm in the violet spectrum of carbon stars, such abundance ratios derived in a homogeneous manner (and thus less prone to systematic errors) are probably preferable over ratios obtained from La or Ce abundances taken from the literature. As it will be shown in Sect. 5, the distribution of low-metallicity, s-process-rich stars in diagrams like ([Pb/La], [Fe/H]) and ([Pb/Ce], [Fe/H]) exhibits interesting properties, whose identification is the main asset of the present paper. Of course, the abundance analysis will have to be redone on a firmer basis when UVES/VLT spectra covering the full optical domain will become available to us. A comparison with existing abundance data (see below and Table 2) makes us confident, however, that the present abundance ratios111The abundance ratios listed in Table 2 are normalized by the meteoritic abundances of Grevesse & Sauval (1998), with , albeit preliminary, should not be too far off. As stressed above, the abundance ratios listed in Table 2222The differences between the abundances obtained in this paper and those from Paper I for the three stars in common may be ascribed to the different metallicities adopted in the two papers. must be considered as tentative, since, except for Ce, only few lines are available for each element, and they lie in a very crowded region of the spectrum, veiled by molecular lines. Since Ce has quite a few lines available, its abundance is probably more reliable than that of the other heavy elements.
The uncertainties mentioned in Table 2 are estimated from the range of abundances derived from the various available lines, although these uncertainties are not the standard deviation of the abundances from the various lines, to account subjectively for the different qualities of the different lines. Errors caused by the uncertainties on the atmospheric parameters have been estimated for HD 26 and V Ari, and are listed in Table 3 (see Paper I for a similar error analysis in the case of HD 196944).
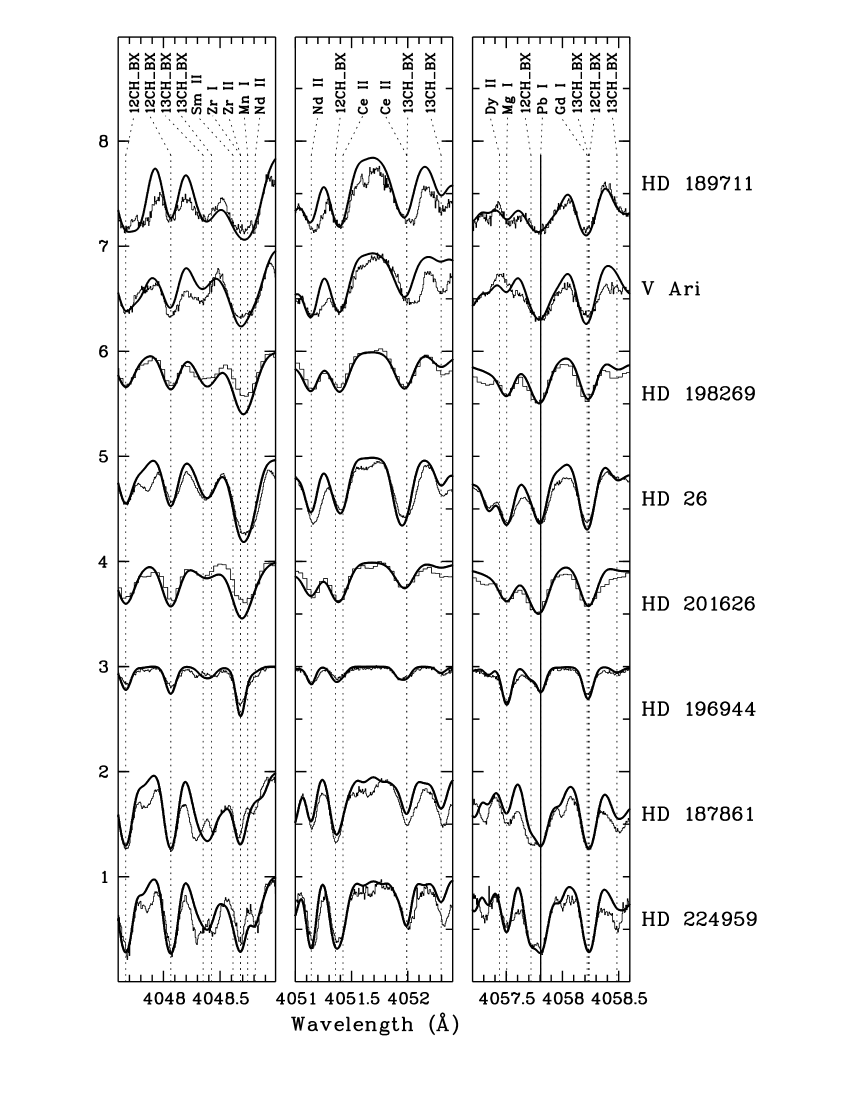
The large uncertainties on the abundances for all the carbon stars (i.e., all stars but HD 196944) are mainly due to remaining inaccuracies in the CN line list. The general quality of the fit between the synthetic and observed spectra may be judged from Fig. 3.
Table 2 compares as well our abundances with those from the literature. Our metallicities are systematically lower by 0.6 to 1 dex as compared to those of Vanture (1992c), although the agreement with other authors is better (see HD 196944 and V Ari). It is worth noting in this respect that the metallicities derived in this paper are based on Fe lines falling in the Bond-Neff depression present in CH stars (Bond & Neff 1969). This depression grossly covers the range 400–440 nm, and has a depth of about 10% around 400 nm (Gow 1976). Luck & Bond (1982) showed that the metallicity derived from Fe lines falling in the Bond-Neff depression may be too low by as much as 1 dex. This strengthens the importance of deriving the Fe, hs and Pb abundances from the same spectral window, and to discuss abundance ratios relative to Fe rather than relative to H.
For the heavy elements, the agreement between the different determinations appears to be much better, however, giving some confidence to the abundances derived here. Despite the various difficulties encountered in the determination of the abundances listed in Table 2 (narrow wavelength range, contaminating CN and CH lines), the remarkable agreement between our abundances and those obtained by Aoki et al. (2002) for HD 196944 is very encouraging.
| Star | [Fe/H] | [Zr/Fe] | [La/Fe] | [Ce/Fe] | [Nd/Fe] | [Sm/Fe] | [Pb/Fe] | Ref. |
|---|---|---|---|---|---|---|---|---|
| V Ari | 1.6 | 1.9 | – | 1.0 | (1) | |||
| – | – | – | – | – | – | (3) | ||
| HD 224959 | (1) | |||||||
| – | – | (2) | ||||||
| HD 26 | 2.3 | 1.7 | 1.3 | (1) | ||||
| – | (2) | |||||||
| – | – | – | – | – | – | (7) | ||
| – | 1.99 | 0.40 | – | (8) | ||||
| HD 187861 | 2.3 | 2.2 | (1) | |||||
| – | 0.7 | – | (2) | |||||
| HD 196944 | (1) | |||||||
| – | – | 1.5 | – | – | (6) | |||
| (9) | ||||||||
| HD 189711 | 1.0 | 1.7 | 1.9 | – | 0.7 | (1) | ||
| – | (5) | |||||||
| HD 198269 | (1) | |||||||
| – | (2) | |||||||
| HD 201626 | (1) | |||||||
| – | (2) |
| (HD 26) | (V Ari) | ||||
|---|---|---|---|---|---|
| Element | km s-1 | K | K | ||
| Fe | +0.1 | 0.0 | +0.1 | 0.0 | 0.0 |
| Zr | +0.15 | +0.1 | +0.05 | 0.0 | +0.2 |
| La | +0.1 | +0.1 | +0.05 | 0.0 | +0.0 |
| Ce | +0.2 | +0.1 | +0.1 | -0.05 | +0.1 |
| Nd | +0.2 | +0.1 | +0.05 | 0.0 | 0.0 |
| Sm | +0.1 | +0.1 | +0.1 | 0.0 | +0.1 |
| Pb | +0.2 | -0.05 | +0.2 | -0.1 | +0.2 |
5 Discussion
Detailed heavy-element abundance patterns are available in the literature for all the stars studied in this paper [Paper I: HD 187861, HD 196944 and HD 224959; Vanture (1992c): HD 26, HD 187861, HD 198269, HD 201626 and HD 224959; Kipper et al. (1996): HD 189711; Kipper & Kipper (1990): V Ari; Aoki et al. (2002): HD 196944] and they reveal that it is the s- rather than the r-process which is responsible for the observed overabundances. The situation is somewhat less clear for V Ari, since Kipper & Kipper (1990) obtain [Eu/hs] and [Gd/hs], which cannot be accounted for by the s-process. These authors obtain, however, extremely large overabundance factors ([hs/Fe] of the order of 3 to 4 dex!), and caution the reader about the large uncertainties affecting their results.
Fig. 4 reveals that HD 187861, HD 196944, HD 198269, HD 201626 and HD 224959 all belong to the class of ‘lead stars’, since their [Pb/Ce] ratios comply with the predictions for the standard model for PMP operating in low-metallicity AGB stars. The two stars HD 189711 and V Ari deviate from the expected trend, however, since they have Pb/Ce ratios far too small with respect to these predictions (the large uncertainty on the metallicity of HD 26 makes the situation unclear for that star). HD 189711 and V Ari are the two coolest CH stars studied in the present paper, and abundance determinations in cool carbon stars represent a real challenge to the spectroscopist. Nevertheless, these two late-type CH stars add to similar (albeit much warmer) cases of metal-poor, s-process-rich, non-lead stars uncovered by Aoki et al. (2001, 2002). All low-metallicity, s-process-rich stars studied so far (Paper I; this paper; Aoki et al. 2001, 2002; Johnson & Bolte 2002) are displayed in the ([Pb/Ce],[Fe/H]) diagram displayed in Fig. 4. Clearly, not all low-metallicity, s-process-rich stars comply with the predictions of the standard PMP theory. The large uncertainty on the metallicity (see the discussion in Sect. 4 and Fig. 4), does not alter this conclusion, especially since the [Pb/Ce] does not appear to be very sensitive to the adopted metallicity. This can be judged from the [Pb/Ce] ratios obtained in this paper and in Paper I for two different choices of the metallicity for the stars HD 187861 and HD 224959. Decreasing the metallicity by about 0.5 dex resulted in a decrease of the [Pb/Ce] ratio of only 0.15 dex.
Some low-metallicity, s-process-rich stars deviate as well from the standard PMP predictions in the ([Pb/La], [Fe/H]) diagram (Fig. 5), indicating that this behaviour is not dependent upon the normalizing element (Ce or La). The agreement with the model predictions is, however, not as good for [Pb/La] as it is for [Pb/Ce], the observed La abundances being systematically larger than the predicted ones.
The scatter in [Pb/Ce] and [Pb/La] at a given metallicity observed in Figs. 4 and 5 is reminiscent of the situation prevailing among the (intrinsic, non-binary) post-AGB stars studied by Van Winckel & Reyniers (2000), who found a large scatter of [hs/ls] also for s-process-rich stars with metallicities typical of the disk ().


It should be stressed here that the predictions of the standard PMP scenario are rather robust (see the discussion by Goriely & Mowlavi 2000), in the sense that they do not depend upon the details of the diffusive mixing (like its depth) as long as the proton profile assumes a monotonic evolution with depth. In the framework of the standard PMP scenario, there is thus no obvious degree of freedom that could be used to reduce the lead production in low-metallicity AGB stars, as seems to be required by the results presented in Figs. 4 and 5. The situation may change when AGB models will include the effect of rotation, but such models are currently very preliminary and do not include s-process calculations (Langer & Herwig 2001). We do not endorse therefore the claim by Aoki et al. (2001) that the Pb abundance observed in LP 625-44 could be accounted for by reducing the 13C abundance in the 13C pocket by a factor 20, since there is no freedom to do so in the framework of the PMP scenario, where the 13C profile is fixed by the proton profile. The 13C pocket required for the operation of the s-process will form at that location in the intershell layer where the proton to 12C ratio is just slightly below unity. Above unity, the CN chain would set in, producing a large amount of the 14N neutron poison; too far below unity, the 13C abundance will be very low and its contribution to the s-process will be largely overidden by the contribution from the upper layers where 13C is far more abundant. Such a layer with p/12C necessarily exists in the framework of the PMP scenario, since p/12C in the outer hydrogen envelope, and goes down to 0 at the bottom of the proton diffusion layer. Finally, the 13C abundance in the layer where p/12C is fixed by the 12C abundance (see for instance Eq. 8 in the analytical description provided by Jorissen & Arnould 1989), which is in turn fixed by the properties of He-burning in the thermal pulse, leading inevitably to C) to 0.5. On the other hand, if no dredge-up occurs, PMP takes place in He-rich layers depleted in 12C (typically C) ) and the 13C production is too small to trigger any s-process.
A scenario to account for the low-metallicity, [Pb/hs] stars has been promoted by Iwamoto et al. (2002) and invokes the sudden mixing of protons from the envelope directly into the thermal pulse. Detailed simulations remain, however, to be performed in that framework.
For some of the stars from Fig. 4, the comparison of the observed abundances with predictions from AGB nucleosynthesis may even be questionable since some of them are subgiant stars with no evidence for binarity (LP 706-7; Norris et al. 1997). Their s-process enrichment can therefore not be ascribed to pollution by mass transfer from a former AGB companion. To make the situation even more obscure, this conclusion cannot be generalized to all the non-lead stars in Fig. 4, since some are indeed binaries (LP 625-44, CS 22942-019; Preston & Sneden 2001; Aoki et al. 2000, 2002), and might be relevant to the mass-transfer scenario. Similarly, lead stars include bona fide post-mass-transfer binaries (like CS 29526-110 and the classical CH binaries HD 198269, HD 224959; McClure & Woodsworth 1990; Aoki et al. 2002) as well as presumably single stars (CS 22898-027, CS 22880-074; Preston & Sneden 2001; Aoki et al. 2002). A whole new class of nucleosynthesis processes must be at work in the non-binary stars, or at least, their abundance peculiarities must have their origin in a very tricky scenario. One such scenario has recently been promoted by Thoul et al. (2002). It assumes that these peculiar stars have evaporated from a globular cluster, where they acquired their s-process enrichment from the pollution by the wind from a nearby AGB star.
6 Conclusion
We presented in this paper lead abundances for 8 low-metallicity, s-process-rich stars. Although 5 among these conform with the predictions of the partial proton-mixing operating in low-metallicity AGB stars (and may therefore be tagged ‘lead stars’), two do not since their [Pb/La] and [Pb/Ce] ratios are too low by at least one order of magnitude with respect to the predictions. These two stars add to similar cases uncovered by Aoki et al. (2001, 2002). A large scatter is observed in the ([Pb/hs],[Fe/H]) diagrams collecting all low-metallicity, s-process-rich stars studied so far. Lead stars conforming to the [Pb/hs] predictions from the standard PMP scenario co-exist with stars having [Pb/hs] ratios up to 2 dex lower. The existence of non-lead stars at low metallicities is especially puzzling, since no physical phenomena can at the present time be called for to explain, within the PMP scenario, the observed abundances.
Moreover, to add to the puzzle, some of the non-lead stars (especially LP 706-7 and CS 22880-027) are subgiant stars with no evidence for binarity, so that their s-process enrichment seems to call for a rather exotic scenario (new site for the operation of the s-process, or accretion from an s-process-rich wind from a nearby AGB star in a globular cluster and subsequent evaporation thereof).
Acknowledgements.
We would like to recognize G. Bihain for help with the abundance analysis of HD 26.Appendix A Hyperfine and isotopic shifts of the Pb I 405.78 nm line
The Pb I 405.78 nm line has a complex structure consisting of three components arising from the hyperfine structure due to 207Pb plus three isotopic components associated with 204Pb, 206Pb and 208Pb. We present below a derivation of the position and intensities of these various components, which differ from the line list obtained by Aoki et al. (2001)
A.1 Energy levels for pure 208Pb
The energy levels for the 208Pb isotope have been taken from Wood & Andrew (1968), and yield a difference in energy of 24636.8973 cm for the 405.78 nm transition ().
A.2 Isotopic shifts
Isotopic shifts for the 405.78 nm transition were taken from Table I of Bouazza et al. (2000).
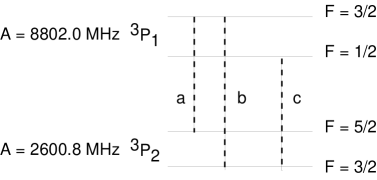
A.3 Hyperfine structure of 207Pb
The hyperfine structure of the levels involved in the 405.78 nm transition are presented in Fig. 6. The Russel-Saunders coupling of the total electronic angular momentum (orbital + spin) with the nuclear spin momentum () predicts three components and , with respective intensity weights of 9/15, 1/15 and 5/15, in agreement with the experimental results of Manning et al. (1936).
A.4 Wavelengths and oscillator strengths for the Pb I nm transition
The final results are listed in Table 4. The line structure is consistent with that observed in the laboratory by Simons et al. (1989, his Fig. 2a), but not with the line list provided by Aoki et al. (2001). The listed in Table 4 is that from Biémont et al. (2000, ), weighted by the hyperfine intensity ratios in the case of 207Pb.
| isotope/transition | log(gf) | ||
|---|---|---|---|
| (cm | (Å) | ||
| 208Pb | 24636.8973 | 4057.807 | -0.220 |
| 207Pb a | 24636.9050 | 4057.805 | -0.442 |
| 207Pb b | 24637.1219 | 4057.770 | -1.396 |
| 207Pb c | 24636.6815 | 4057.842 | -0.697 |
| 206Pb | 24636.8163 | 4057.820 | -0.220 |
| 204Pb | 24636.7443 | 4057.832 | -0.220 |
References
- Alvarez & Plez (1998) Alvarez R., Plez B. 1998, A&A, 330, 1109
- Aoki et al. (2000) Aoki W., Norris J. E., Ryan S. G., Beers T. C., Ando H. 2000, ApJ, 536, L97
- Aoki et al. (2001) Aoki W., Ryan S. G., Norris J. E., Beers T. C., Ando H., Iwamoto N., Kajino T., Mathews G. J., Fujimoto M. Y. 2001, ApJ, 561, 346
- Aoki et al. (2002) Aoki W., Ryan S. G., Norris J. E., Beers T. C., Ando H., Tsangarides S. 2002, ApJ, 580, 1189
- Aoki & Tsuji (1997) Aoki W., Tsuji T. 1997, A&A, 317, 845
- Bidelman (1981) Bidelman W. P. 1981, AJ, 86, 553
- Biémont et al. (2000) Biémont E., Garnir H. P., Palmeri P., Li Z. S., Svanberg S. 2000, MNRAS, 312, 116
- Bond & Neff (1969) Bond H. E., Neff J. S. 1969, ApJ, 158, 1235
- Bouazza et al. (2000) Bouazza S., Gough D., Hannaford P., Lowe R., Wilson M. 2000, Phys. Rev. A, 63, 012516
- Duflot et al. (1995) Duflot M., Figron P., Meyssonnier N. 1995, A&AS, 114, 269
- Eggen (1972) Eggen O. J. 1972, MNRAS, 159, 403
- Gillet et al. (1994) Gillet D., Burnage R., Kohler D., Lacroix D., Adrianzyk G., Baietto J. C., Berger J. P., Goillandeau M., Guillaume C., Joly C., Meunier J. P., Rimbaud G., Vin A. 1994, A&A, 108, 181
- Gonzalez et al. (1998) Gonzalez G., Lambert D. L., Wallerstein G., Rao N. K., Smith V. V., McCarthy J. K. 1998, ApJS, 114, 133
- Goriely & Mowlavi (2000) Goriely S., Mowlavi N. 2000, A&A, 362, 599
- Goriely & Siess (2001) Goriely S., Siess L. 2001, A&A, 378, L25
- Gow (1976) Gow C. E. 1976, AJ, 81, 993
- Grevesse & Sauval (1998) Grevesse N., Sauval A. J. 1998, Space Science Reviews, 85, 161
- Gustafsson et al. (1975) Gustafsson B., Bell R. A., Eriksson K., Nordlund A. 1975, A&A, 42, 407
- Herwig et al. (1997) Herwig F., Blöcker T., Schönberner D., El Eid M. 1997, A&A, 324, L81
- Iwamoto et al. (2002) Iwamoto N., Kajino T., Mathews G., Fujimoto M., Aoki W. 2002, J. Nucl. Sci. and Tech., in press (astro-ph/0203180)
- Johnson & Bolte (2002) Johnson J., Bolte M. 2002, ApJ, 579, L87
- Jorissen & Arnould (1989) Jorissen A., Arnould M. 1989, A&A, 221, 161
- Keenan (1942) Keenan P. C. 1942, ApJ, 96, 101
- Keenan (1993) Keenan P. C. 1993, PASP, 105, 905
- Kipper et al. (1996) Kipper T., Jörgensen U. G., Klochkova V. G., Panchuk V. E. 1996, A&A, 306, 489
- Kipper & Kipper (1990) Kipper T., Kipper M. 1990, Sov. Astron. Lett., 16, 478
- Knapp et al. (2001) Knapp G. R., Pourbaix D., Jorissen A. 2001, A&A, 371, 222
- Kupka et al. (1999) Kupka F., Piskunov N., Ryabchikova T. A., Stempels H. C., Weiss W. W. 1999, A&AS, 138, 119
- Langer et al. (1999) Langer N., Heger A., Wellstein S., Herwig F. 1999, A&A, 346, L37
- Langer & Herwig (2001) Langer N., Herwig F. 2001, Mem. Soc. Astron. Ital., 72, 277
- Lattanzio (1998) Lattanzio J. 1998, in N. Prantzos, S. Harissopoulos (eds.), Nuclei in the Cosmos, Editions Frontières, France, 163
- Luck & Bond (1982) Luck R. E., Bond H. E. 1982, ApJ, 259, 792
- Luque & Crosley (1999) Luque J., Crosley D. 1999, SRI International Report MP 99-009, available at http://www.sri.com/psd/lifbase
- Manning et al. (1936) Manning T., Anderson C., Watson W. 1936, Phys. Rev., 78, 417
- McClure & Woodsworth (1990) McClure R. D., Woodsworth A. W. 1990, ApJ, 352, 709
- Mendoza V & Johnson (1965) Mendoza V E. E., Johnson H. L. 1965, ApJ, 141, 161
- Norris et al. (1997) Norris J. E., Ryan S. G., Beers T. C. 1997, ApJ, 488, 350
- Plez et al. (1992) Plez B., Brett J. M., Nordlund A. 1992, A&A, 256, 551
- Preston & Sneden (2001) Preston G. W., Sneden C. 2001, AJ, 122, 1545
- Simons et al. (1989) Simons J., Palmer B., Hof D., Oldenborg R. 1989, J. Opt. Soc. America B, 6, 1097
- Sivarani et al. (2002) Sivarani T., Bonifacio P., Molaro P., Cayrel R., Spite M., et al. 2002, astro-ph/0212406
- Šleivyte & Bartkevičius (1990) Šleivyte J., Bartkevičius A. 1990, Vilnius Astronomijos Observatorijos Biuletenis, 85, 3
- Smith & Lambert (1990) Smith V. V., Lambert D. L. 1990, ApJS, 72, 387
- Thévenin & Idiart (1999) Thévenin F., Idiart T. P. 1999, ApJ, 521, 753
- Thoul et al. (2002) Thoul A., Jorissen A., Goriely S., Jehin E., Magain P., Noels A., Parmentier G. 2002, A&A, 383, 491
- Tsuji et al. (1991) Tsuji T., Tomioka K., Sato H., Iye M., Okada T. 1991, A&A, 252, L1
- Ulla et al. (1997) Ulla A., Thejll P., Kipper T., Jorgensen U. G. 1997, A&A, 319, 244
- Van Eck et al. (2001) Van Eck S., Goriely S., Jorissen A., Plez B. 2001, Nature, 412, 793
- Van Eck & Jorissen (2000) Van Eck S., Jorissen A. 2000, A&A, 360, 196
- Van Winckel et al. (1992) Van Winckel H., Mathis J. S., Waelkens C. 1992, Nat, 356, 500
- Van Winckel & Reyniers (2000) Van Winckel H., Reyniers M. 2000, A&A, 354, 135
- Vanture (1992a) Vanture A. D. 1992a, AJ, 103, 2035
- Vanture (1992b) Vanture A. D. 1992b, AJ, 104, 1986
- Vanture (1992c) Vanture A. D. 1992c, AJ, 104, 1997
- Vanture & Wallerstein (1999) Vanture A. D., Wallerstein G. 1999, PASP, 111, 84
- Wallerstein (1969) Wallerstein G. 1969, ApJ, 158, 607
- Wallerstein & Knapp (1998) Wallerstein G., Knapp G. R. 1998, ARA&A, 36, 369
- Waters et al. (1992) Waters L. B. F. M., Trams N. R., Waelkens C. 1992, A&A, 262, L37
- Wood & Andrew (1968) Wood D., Andrew K. 1968, J. Opt. Soc. America, 58, 818
- Zacs et al. (1998) Zacs L., Nissen P. E., Schuster W. J. 1998, A&A, 337, 216