22institutetext: Department of Theoretical Astrophysics, Ioffe Physico-Technical Institute, Politechnicheskaya Str. 26, 194021 St. Petersburg, Russia
Early stages of Nitrogen enrichment in galaxies :
Clues from measurements in damped Lyman
systems††thanks: Based on observations made with the ESO 8.2 m Kueyen
telescope operated on Paranal Observatory, (Chile). ESO programmes 65.O-0474(A) and 66.A-0594(A).
We present 4 new measurements of nitrogen abundances and one upper limit in damped Ly absorbers (DLAs) obtained by means of high resolution (FWHM 7 km s-1) UVES/VLT spectra. In addition to these measurements we have compiled data from all DLAs with measurements of nitrogen and -capture elements (O, S or Si) available in the literature, including all HIRES/Keck and UVES/VLT data for a total of 33 systems, i.e. the largest sample investigated so far. We find that [N/] ratios are distributed in two groups: 75% of the DLAs show a mean value of [N/] = –0.87 with a scatter of 0.16 dex, while the remaining 25% shows ratios clustered at [N/] = –1.45 with an even lower dispersion of 0.05 dex. The high [N/] plateau is consistent with the one observed in metal-poor H ii regions of blue compact dwarf (BCD) galaxies ([N/] = –0.73 0.13), while the [N/] –1.5 values are the lowest ever observed in any astrophysical site. These low [N/] ratios are real and not due to ionization effects. They provide a crucial evidence against the primary production of N by massive stars as responsible for the plateau at –0.9/–0.7 dex observed in DLAs and BCD galaxies. The transition between the low-N ([N/] –1.5) and high-N ([N/] –0.9) DLAs occurs at a nitrogen abundance of [N/H] , suggesting that the separation may result from some peculiarity of the nitrogen enrichment history. The [N/] –1.5 values and their low dispersion are consistent with a modest production of primary N in massive stars; however, due to the limited sample, specially for the low-N DLAs, we cannot exclude a primary origin in intermediate mass stars as responsible for the low N abundances observed.
Key Words.:
Cosmology: observations — Galaxies: abundances — Galaxies: evolution — Quasars: absorption lines — Quasars: individual (PKS 0528–250, Q0841+129, HE 0940–1050, Q1232+0815)1 Introduction
Nitrogen is an important element when attempting to understand the chemical evolution of galaxies. The synthesis of N in the CNO cycle during hydrogen burning is reasonably well understood, but the characteristics of the stars which produce this element (range of masses, stage of evolution, etc.) are not completely clear. N is mostly a secondary element, produced in the CNO cycle from seed C and O nuclei created in earlier generation of stars. Primary N is produced when freshly synthesized C in the helium-burning shell penetrates into the hydrogen-burning shell where it will be converted in primary N by means of the CNO cycle. In evolution models of intermediate mass stars, thermal pulses occurring during the asymptotic giant branch AGB phase are responsible for the transport of the He-burning products to the H-burning shell producing primary N (Marigo 2001).
For massive stars a general consensus on the transport mechanism is lacking, and the primary N production is strongly dependent on the assumed treatment of convection in stellar interiors. Primary N might be produced in massive stars of low metallicities by adjusting convective overshooting (Woosley & Weaver 1995). In addition, stellar models which include rotation and its effects on the transport of elements show that massive stars with high rotational velocity produce primary N at low metallicities (Meynet & Maeder 2002).
In simple models of galactic evolution, if nitrogen has a secondary production, the increase of its abundance is proportional to the metal content of the galaxy. On the other hand, if nitrogen has a primary origin, then its abundance is expected to increase in lockstep with that of other primary elements. In the classical N/O versus O/H diagram, the secondary nitrogen production would be represented by a straight line at 45o slope, while in the case of a primary origin of N a horizontal line is expected in this diagram (Talbot & Arnett 1974).
In order to obtain clues on the nucleosynthetic origin of nitrogen, a considerable number of works has been devoted to the comparison of the chemical evolution model predictions with the behavior of the observed N/O ratios as a function of metallicity measured by oxygen abundance (Edmunds & Pagel 1978; Pilyugin 1992; Marconi et al. 1994; Izotov & Thuan 1999; Henry et al. 2000; Chiappini et al. 2002; Calura et al. 2002; Pilyugin et al. 2002; among others).
Since determination of nitrogen abundance in stars is relatively difficult to obtain, the bulk of the N/O data used for this purpose are measurements in H ii emitting regions of dwarf irregulars (Thuan et al. 1995; Kobulnicky & Skillman 1996; Izotov & Thuan 1999) and spiral galaxies (see Henry et al. 2000, and Pilyugin et al. 2002, for a compilation of data).
In metal-poor H ii regions of dwarf galaxies ([O/H]111Using the customary definition [X/H] = log (X/H) – log (X/H)☉. –1), N/O ratios are roughly constant and independent of metallicity — a behavior which is interpreted as an evidence for primary production of N. However, at higher metallicities, N/O ratios increase with O/H, suggesting the secondary origin of N. In the low metallicity regime the observed N/O plateau in blue compact dwarf (BCD) galaxies, has been interpreted as either due to the primary production of N by massive stars (Izotov & Thuan 1999, Izotov et al. 2001) or due to primary production of N by intermediate mass stars (Henry et al. 2000; Chiappini et al. 2002).
Determinations of N abundance in sites of low metallicities play an important role in understanding the origin of N production. In this framework N measurements in high redshift damped Ly absorbers (DLAs) — the quasar absorbers with the highest neutral hydrogen column densities (H i) cm-2 (Wolfe et al. 1986) — are of great importance since their metallicities extend over a much lower range than those of metal-poor H ii regions in dwarf galaxies, allowing to probe the early phases of galactic chemical enrichment.
After the very first studies of nitrogen in DLAs (Pettini et al.1995; Green et al. 1995; Vladilo et al. 1995), systematic measurements and compilations of extant data have been presented by Lu et al. (1998), Centurión et al. (1998) and, more recently, by Pettini et al. (2002) and Prochaska et al. (2002). In these two latter works a total of 10 and 19 nitrogen measurements have been presented, respectively. Only in the data base of Pettini and collaborators, oxygen abundances have been considered, and are available for 6 DLAs. Oxygen measurements, which are difficult to obtain, have been often replaced by measurements of other -capture elements for the purpose of investigating trends of the nitrogen abundances. N/O (or N/) ratios in DLAs show, in general (see, however, Prochaska et al. 2002), a large scatter, at variance with the near to constant value observed in BCD galaxies at comparable metallicities.
The N/O scatter observed in DLAs has commonly been ascribed to the time delay between the release of O by short-lived, massive stars and the release of N by intermediate mass stars, which takes place over larger time scales (Lu et al. 1998; Pettini et al. 2002). However, as pointed out by Centurión et al. (1998), it is difficult to conciliate this interpretation with the absence of the expected enhancement of the -elements over the Fe-peak elements in the lowest N/ DLAs. In order to probe the validity of the time delay interpretation, it is therefore important to add further observational constraints based on the relative abundances of other elements.
In this paper we describe new abundance determinations in 6 DLAs located in the direction of 4 QSOs. It was possible to determine the N abundance in only 4 of these systems. The measurements are generally based on the six lines of the N i multiplets at rest wavelengths 1134 and 1200 Å redshifted to the optical spectral region (the redshifts of the absorbers lie in the range 1.9 to 2.8). Our results, together with the rest of the published data, are discussed in the framework of the time delay model of chemical evolution. We compare the trends of N/ ratios with /Fe — a well known indicator of chemical evolution in galaxies. The comparison between the trends observed in different abundance ratios should yield significant constraints on the nucleosynthetic processes at work in DLAs and, eventually, on the nature of the associated galaxies.
The paper is organized as follows. In Sects. 2 and 3 we present our observations and column density measurements, respectively. In addition to N we present new measurements of the -capture elements S and Si as well as of the iron-peak elements Fe and Zn. A compilation of abundance measurements for all DLAs with nitrogen detections, based on our data and on data from the literature, is presented in Sect. 4. The behavior of the ratios N/ and /iron-peak as well as the implications for understanding the nature of DLAs are discussed in Sect. 5. We draw our conclusions in Sect. 6.
2 Observations and Data Reduction
Information on the targets and on the observations is given in Table 1. The quasars PKS 0528–250 and HE 0940–1050 were observed in the framework of our own programmes for the study of chemical abundances at high redshifts, while the data for QSO 0841+129 and QSO 1232+0815 were taken from the UVES archive. Spectra of these QSOs were obtained with the Ultraviolet-Visual Echelle Spectrograph (UVES; see Dekker et al. 2000) on the Nasmyth focus of the 8.2m Kueyen telescope, second unit of the VLT at Paranal, Chile. For each target repeated exposures were taken in order to attain the spectral coverage of interest and to increase the final signal-to-noise ratio. A total of 93 spectra were collected and analyzed.
All the observations were carried out using dichroic filters to simultaneously observe two spectral ranges with the two arms of the spectrograph. Different setups allowed us to cover the spectral ranges listed in the column of Table 1. The slit widths of both arms of UVES were set to 1 arcsec and the CCDs were read out in 2 x 2 binned pixels. The full width half maximum of the instrumental profile (), measured from the emission lines of the arcs, gives a mean resolving power of R = / 42500 corresponding to a velocity resolution of 7 km s-1.
The data reduction was performed using the ECHELLE context routines implemented in the ESO MIDAS package. The flat-fielding, cosmic-ray removal, sky subtraction, extraction, and wavelength calibration were performed separately on the different spectra of each QSO. Internal errors in the wavelength calibrations lie in the range from 0.6 to 0.9 mÅ. After calibration, the observed wavelength scale was transformed into a vacuum, heliocentric wavelength scale. At this point the spectra of each QSO with same exposure time and spectral coverage were averaged using the continuum level as a weighting factor. The spectra of PKS 0528-250, obtained in different observing runs and with overlapping spectral regions issued from different spectrograph configurations, were added using the signal-to-noise ratio, S/N, as a weighting factor.
Finally, for each spectral range under study the local continuum was determined in the average spectrum by using a spline function to smoothly connect the regions free from absorption features. The final spectrum used for the analysis was obtained by normalizing the average spectrum to these continua. The signal-to-noise ratios of the final spectra, estimated from the scatter of the continuum near the absorptions under study are given in the last column of Table 1.
| QSO | V | date | Exp. time | Number | Coverage | S/N | ||
|---|---|---|---|---|---|---|---|---|
| Mag | d/m/y | (s) | of spectra | (Å) | ||||
| PKS 0528–250 | 17.7 | 2.765 | 2.141 | 2–4/2/2001 | 33930 | 6 | 3000–3739.5 | 16 |
| 2.811 | 6,10,12/2/2001 | 45240 | 8 | 3739.5–3864 | 41 | |||
| 12,14/3/2001 | 45240 | 8 | 3739.5–3864 | 31 | ||||
| 39585 | 7 | 3864–4522 | 31 | |||||
| 11310 | 2 | 4522–4790 | 30 | |||||
| 46560 | 9 | 4790–4983 | 37 | |||||
| 35250 | 7 | 4983–5764 | 47 | |||||
| 35250 | 7 | 5846–6715 | 77 | |||||
| 46560 | 9 | 6715–6813 | 100 | |||||
| 11310 | 2 | 6813–8530 | 36 | |||||
| 11310 | 2 | 8677–10400 | 36 | |||||
| 0841+129 | 17.0 | 2.200 | 2.375 | 29,30/4/2000 | 5400 | 2 | 3453–4776 | 10 |
| 2.476 | 5400 | 2 | 6715–8530; 8677–10400 | 20–15 | ||||
| HE 0940–1050 | 16.6 | 3.054 | 1.917 | 26–29/3/2000 | 13500 | 4 | 3300–3864 | 25 |
| 3/4/2000 | 4 | 4790–5763; 5763–5846 | 45–35 | |||||
| 13500 | 4 | 3740–4983 | 19 | |||||
| 4 | 6715–8530; 8677–10400 | 40–35 | ||||||
| 1232+0815 | 18.4 | 2.567 | 2.337 | 6,8/4/2000 | 10800 | 3 | 3260–4555 | 10–20 |
| 18000 | 3 | 4584–5644; 5644–6686 | 17–15 |
The slit was and the CCD binning
for all the observations.
Dates given in Table 1 correspond to the complete set of data for
a single QSO.
Intervals in the dates indicate that the spectra were obtained
during all nights included in the interval.
3 Column densities
Column densities were obtained by fitting theoretical Voigt profiles to the observed absorption lines via minimization. This was done using the routines FITLYMAN (Fontana & Ballester 1995) included in the MIDAS package. To reproduce the observed profiles, the theoretical profiles are convolved with the instrumental point-spread function modeled using the emission lines of the arcs. Portions of the profiles recognized as contaminated by intervening Ly clouds were excluded from our analysis. The FITLYMAN routines determine the redshifts, column densities, and broadening parameters ( values) of the absorption components, as well as the formal fit errors for each of these quantities. The laboratory wavelengths of the transitions investigated are listed in Table 2 together with the oscillator strengths adopted for the computation of the theoretical profiles.
In the case where the absorber was fitted with a single component and several unsaturated transitions were detected for a given ion, the column density was estimated by applying the fit procedure both to the individual transitions and to the full set of available lines. No significant differences were found between the column densities of individual fits and the column density obtained from the simultaneous fit of all the lines. In these cases we adopted the dispersion of individual measurements as the estimate of the column density error. When a metal absorption was fitted with multiple components, errors in the total column density were estimated by taking the difference between the value obtained from the fit and a ”maximum” and a ”minimum” total column density computed by adding the (X) and (X), respectively, of each component.
For saturated transitions, lower limits to the column density were estimated from the equivalent width obtained from the best fit to the absorption. For undetected transitions, upper limits were derived from 3 upper limits of the equivalent width. In both cases the conversion from equivalent widths to column densities was performed in the optically thin regime (linear part of the curve of growth).
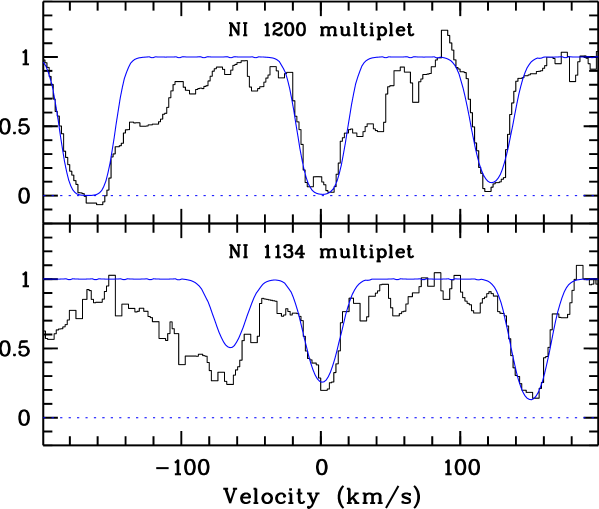
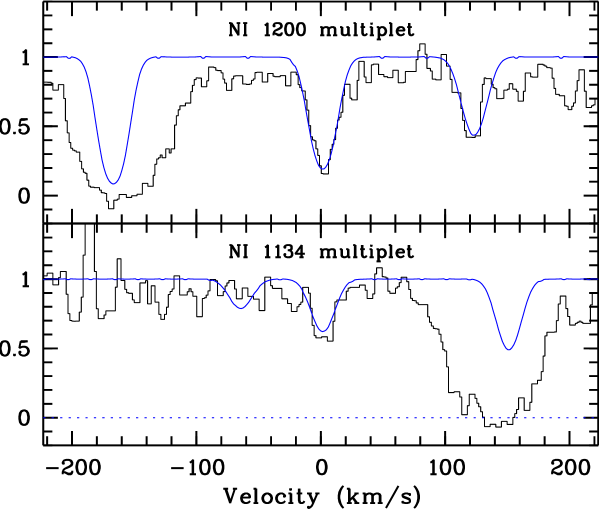
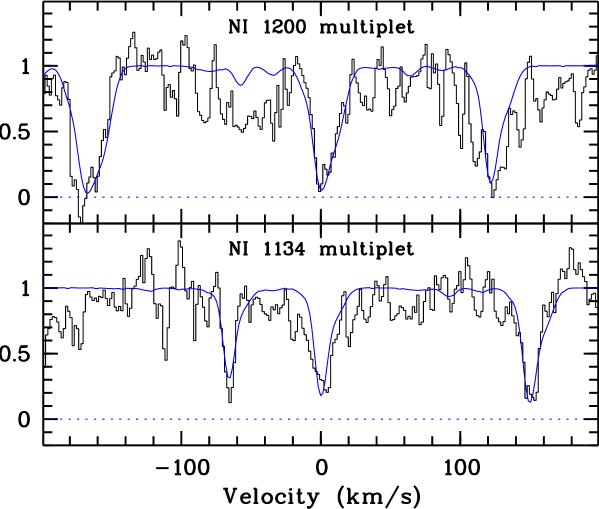
Nitrogen column densities were determined studying the six transitions of the two N i multiplets at 1134 and 1200 Å (see Table 2). These lines are located in the Ly forest, but the identification of the absorptions is reliable because it is unlikely that each one of the six transitions is blended with a Ly interloper. The oscillator strengths span about one order of magnitude offering a large dynamical range for the measurement of the column density. The detection of the faintest transitions of the 1134 Å multiplet is particularly important to avoid saturation effects.
Comparison of N abundance with the one of other elements is necessary in order to give an insight into the nucleosynthetic origin of nitrogen. We therefore searched for transitions of important species such as O i, Si ii, S ii representative of -capture elements, as well as Fe ii, and Zn ii, representative of Fe-peak elements. The comparison of Zn and Fe abundances is also important to assess possible effects of dust depletion (Vladilo 1998, 2002a).
Oxygen is particularly important as a reference for nitrogen abundances. As nitrogen, this element is believed to be essentially undepleted onto dust grains. Unfortunately, accurate oxygen column density estimates are rare in DLAs since traditionally estimates are based on the strongly saturated O i 1302.2 Å absorption and on the extremely weak O i 1355.6 Å line (never detected). These measurements yield lower and upper limits, respectively, usually differing by over one order of magnitude. Only recently, and mainly thanks to the high resolution and the ultraviolet-visual coverage of the UVES spectrograph, accurate O i column densities have been obtained in DLAs by using O i lines which fall shortward of the Ly absorption and have a large dynamical range in oscillator strengths (Lopez 1999; Molaro et al. 2000, 2001; Dessauges-Zavadsky et al. 2001; Prochaska et al. 2001; Levshakov et al. 2002; Pettini et al. 2002; Prochaska et al. 2002). Unfortunately, the O i transitions at 1302 Å have not been detected for any of the DLAs studied here.
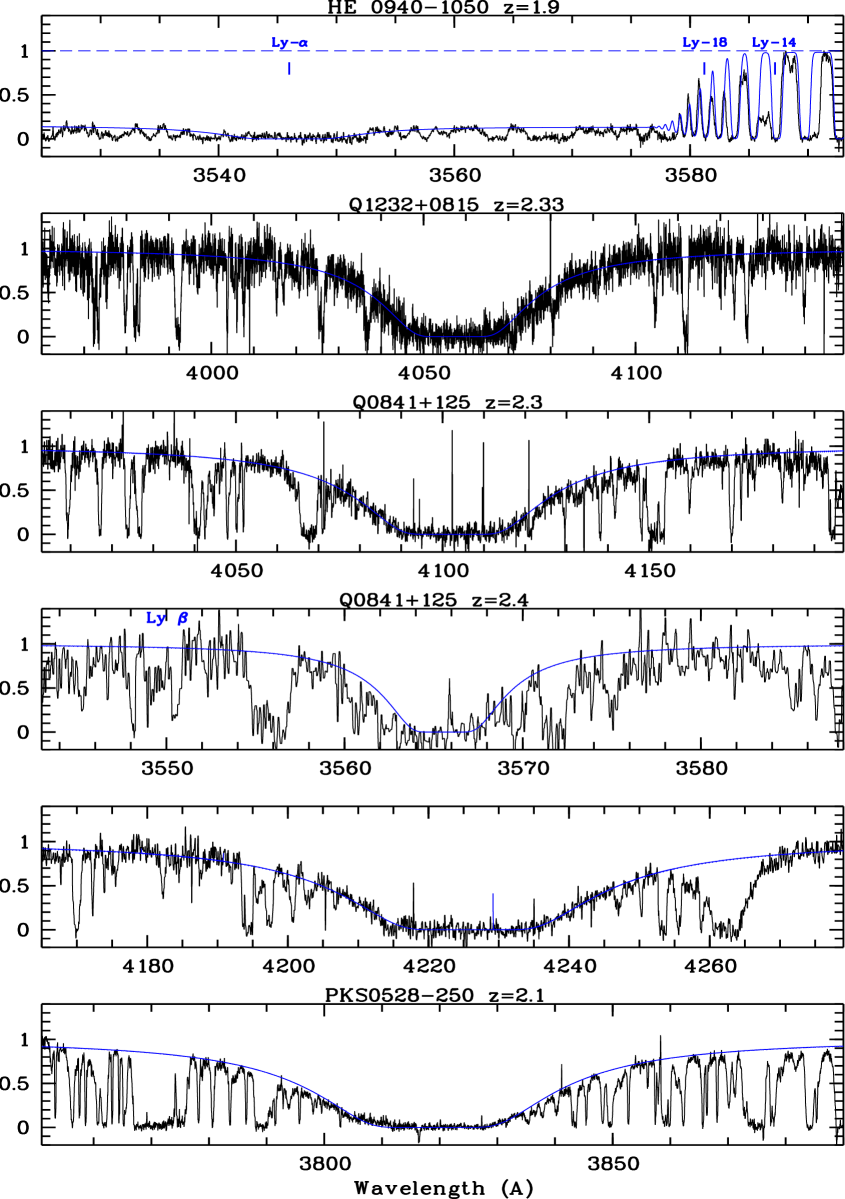
In order to estimate the absolute abundances of the elements, we also derived the H i column densities of the systems by fitting the Ly absorptions and possibly other lines of the Lyman series, as shown in Fig. 1. The resulting column densities and abundances ((X), [X/H]) are given in Tables 3 to 8. Through this paper we use N and O phostospheric solar values given by Holweger (2001), and for the remaining elements the meteorite values from Grevesse & Sauval (1998).
More details on the measurements performed in individual systems are given in the following sections.
3.1 DLAs towards PKS 0528–250
PKS 0528-250 has an emission redshift of = 2.779 determined from C iv and Si iv emission lines (Foltz et al. 1988). Due to the presence of a damped Ly absorption at =2.811, the Ly emission of the quasar is partially absorbed. There is an additional DLA at =2.141 in the spectrum of this quasar. Metal abundances in both DLAs have been previously studied by Lu et al. (1996) using HIRES/Keck spectra. Our UVES/VLT spectra have higher S/N and extended wavelength coverage (see Table 1). By means of these UVES data a study of the molecular hydrogen H2 in the =2.811 DLA has been presented in Levshakov et al. (2003a). The detailed study of metal abundances of both DLAs is given in Péroux et al. (2003). Here we present the total column densities of nitrogen, -capture elements (S, Si) and Fe-peak element (Fe, Zn), in order to discuss the abundance ratios involving nitrogen.
3.1.1 The =2.1410 system
The Ly profile of the DLA is used to determine the neutral hydrogen column density, (H i) = 20.950.05. The fit to the observed profile is shown in Fig. 1. No other absorptions of the Lyman series are observed since the quasar flux is completely absorbed at 3500 Å. Our derived H i column density is 0.25 dex larger than the one estimated by Morton (1980) and adopted by Lu et al. (1996).
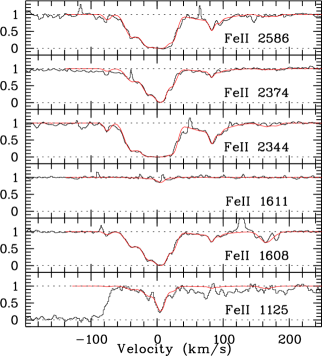
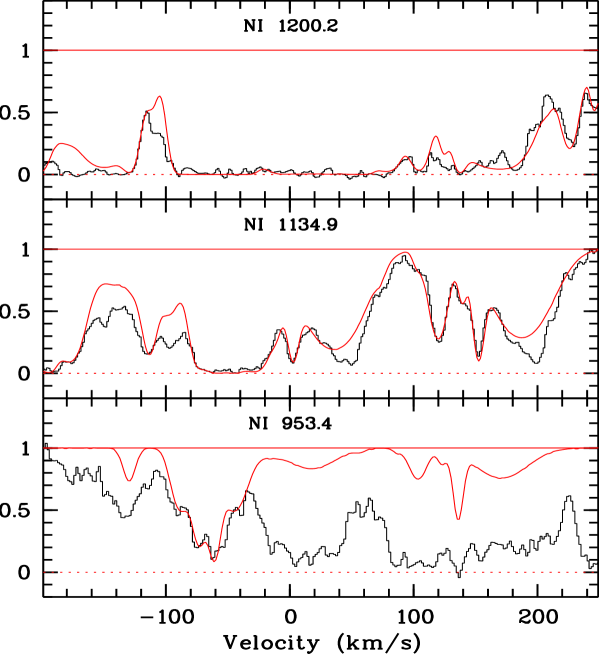
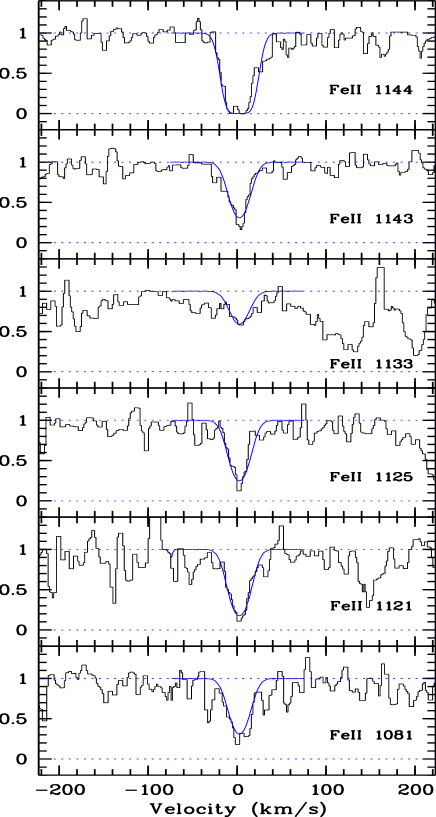
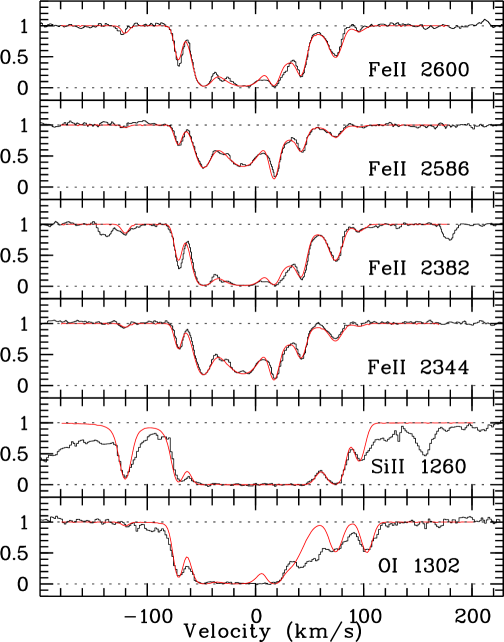
The metal lines associated with this system are fitted with 10 components. In this case, we use the numerous Fe ii lines to fix the redshift and Doppler parameter of each component. The derived and values are further used to fit N i, Si ii, and S ii. The fitted profiles are shown in Fig. 2 and the resulting total column densities are given in Table 3.
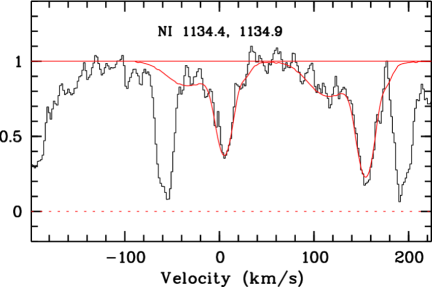
The nitrogen abundance is derived for the first time in this system. Only two lines out of the two triplets are suitable for column density determination: 1134.4 and 1134.9 Å. The N i triplet around 1200 Å is totally blended. The resulting fits are shown in Fig. 2, corresponding to a total column density (N i) = 14.580.08.
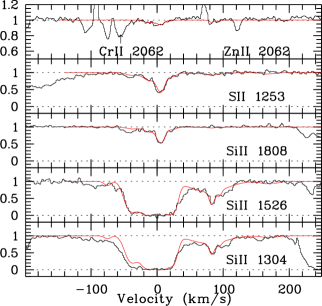
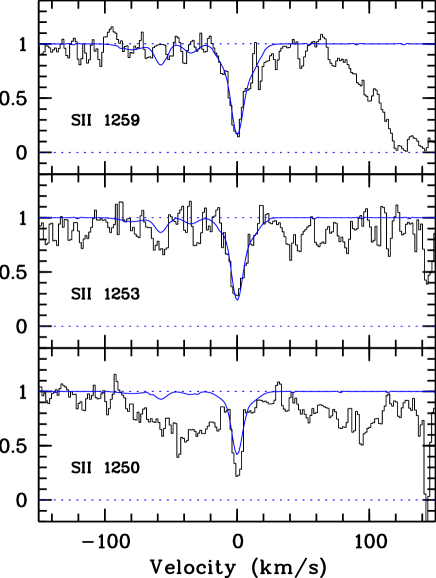
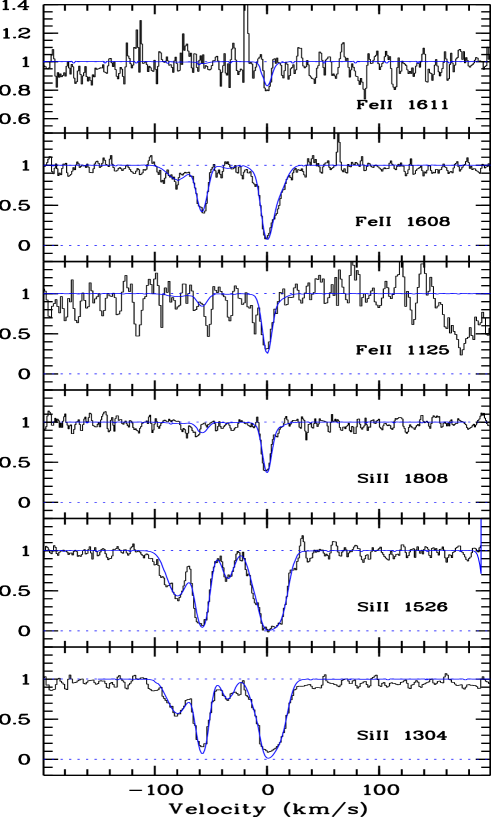
The O i abundance cannot be derived since the 1302 Å line is heavily saturated and blended. On the contrary, we can derive a reliable Si ii column density measurement from the 1808 Å transition. The Si ii 1304 and 1526 Å lines are heavily saturated. We obtain a total column density of (Si ii) = 15.220.05, slightly lower than the one derived by Lu et al. (1996). In addition, we derive the column density of S ii from the 1253 Å line, since the S ii 1250, and 1259 Å transitions are completely blended. The last components fitted in Fe ii and other elements are too weak to be detected in S ii 1253 Å. We derive for the first time the S ii column density in this system obtaining (S ii) = 14.830.04. Several Fe ii lines are at our disposal to derive the column density of this element. We use the 1125, 1608, 1611, 2344, 2374, and 2586 Å to deduce a total column density of (Fe ii) = 14.850.09. Taking into account differences in the adopted oscillator strengths, this result is in agreement with the one of Lu et al. (1996). Finally, Zn ii 2026 Å is heavily blended with Al ii 1670 Å from the DLA at =2.812. At the expected position for Zn ii 2062 Å in the =2.141 system, we observe a weak absorption extended over the three strongest components detected in the other metals. However, extra absorptions are located at both sides of this feature due to the Cr ii 2062 Å and other unidentified lines (see Fig. 2). In this case we conservatively adopt the result of the fit as an upper limit since we cannot exclude that the fitted absorption is also contaminated.
3.1.2 The =2.8120 system
In our UVES spectra, several lines down the Lyman series are available for determination of neutral hydrogen column density. We refer to Levshakov et al. (2003a) where a simultaneous analysis of the whole Ly and the red wings of the Ly , Ly 5 – Ly 8 leads to the column density determination: (H i) = 21.110.04.
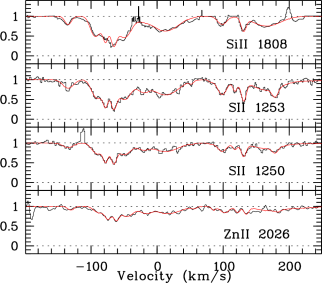
The velocity profiles of the metals are extremely complex but well fitted with 16 components for most species as it can be seen from Fig. 3. We constrain the number of components by fitting simultaneously the profiles of S ii 1250 Å and 1253 Å absorptions and Ar i 1048 and P ii 1152 (see Péroux et al. 2003 and Vladilo et al. 2003). As in the case of the =2.141 DLA, we then fix the redshift and Doppler parameter of each component using S ii and Ar i to be equal for all elements. The resulting total column densities are presented in Table 4.
We determine a conservative upper limit to the N i column density by considering the most constraining regions of the profiles of N i 953.4 Å, together with the 1134 and 1200 Å multiplets. In this way we estimate the maximum N i column density (N i) 15.66, consistent with the observed profiles (see upper panel of Fig. 3).
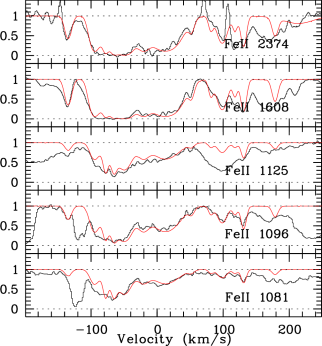
Unfortunately, the column densities of O i can not be determined in this absorber due to saturation and blending of the lines. However, accurate column densities of S ii have been derived thanks to the absorptions of two different transitions ( 1250 and 1253 Å). The resulting total column density is (S ii) = 15.560.02. For Si ii only the 1808 Å transition is not heavily saturated, but it is contaminated by few atmospheric absorption lines. We use the spectrum of a fast rotator standard star to correct from the telluric absorptions and we obtain (Si ii) = 16.010.03 in perfect agreement with the value reported by Lu et al. (1996). Five Fe ii lines are used to measure the Fe ii abundance: 1081, 1096, 1125, 1608 and 2374 Å leading to (Fe ii) = 15.470.02. Finally, the Zn ii column density is estimated only from the transition 2026 Å, since 2062 Å is blended, giving (Zn ii) = 13.270.03. This column density is significantly larger than the value (Zn ii) = 13.090.07 given by Lu et al. (1996) and the difference is likely due to the different tracement of the continuum.
3.2 DLAs towards QSO 0841+129
The two damped systems in the spectrum of QSO 0841+129 have been previously studied at high resolution by Prochaska & Wolfe (1999) with HIRES/Keck spectra, by Pettini et al. (1997) and Centurión et al. (2000) with ISIS/WHT spectra of much lower resolution (R 2500 and 5000, respectively). Here we present the first N i measurements obtained for these systems and much more accurate column density determinations of S ii (in both systems) and Fe ii (in the bluest one), than previously determined from low resolution data (Centurión et al. 2000).
3.2.1 The =2.3745 system
Column densities and metal abundances are listed in Table 5. Metal lines from which abundances are obtained are shown in Fig. 4.
The Ly absorption is used to derive the H i column density, (H i) = 21.000.10, which is in agreement with the value (H i) = 20.950.10 previously published by Pettini et al. (1997), and Centurión et al. (2000).
For N i we restrict the analysis to the 1134.4, 1134.9 Å lines, the only unsaturated and uncontaminated ones, and we obtain (N i) = 14.620.03. In Fig. 4 we show the synthetic spectrum built with the parameters obtained from the fit of these two N i transitions. The synthetic spectrum is in excellent agreement with the observed profiles of all the six N i absorptions.
The Si ii transitions 1190,1193,1260,1304 Å present in our spectrum are heavily saturated. The most stringent lower limit we can obtain from the weakest 1304 Å transition is (Si ii) 14.65. This is consistent with the measurement from Prochaska et al. (1999), (Si ii) = 15.240.03, obtained from the unsaturated Si ii 1808 Å transition, that we adopt in the rest of this paper.
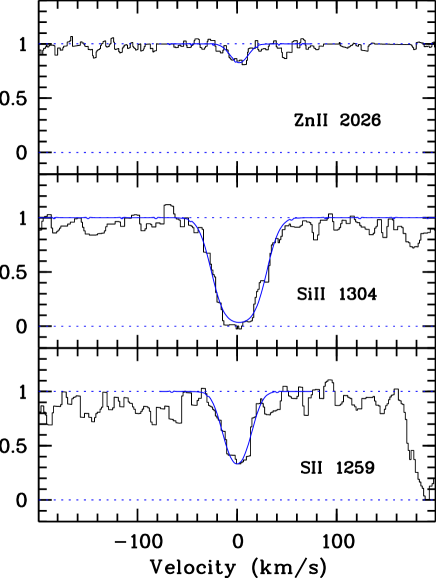
The S ii column density is obtained from the S ii 1259 Å transition which lies in the red wing of the = 2.4762 Ly absorption. The presence of this Ly profile precludes the detection of the other two bluer absorptions of the = 2.3745 S ii triplet. The present result, (S ii) = 14.770.03, is one order of magnitude more accurate than the one previously obtained from ISIS/WHT data, (S ii) = 14.92.
The Fe ii transitions used to obtain the iron column density are shown in Fig. 4. The redder Fe ii transitions at 2260, 2344, 2374, 2382 Å, not shown in the figure, are all saturated. The derived column density, (Fe ii) = 14.870.04 is in perfect agreement with the one obtained from ISIS/WHT spectra, (Fe ii) = 14.830.15, but again has an order of magnitude higher accuracy.
The Zn ii column density obtained here from the 2026 Å transition — (Zn ii) = 12.20 — is in agreement, within the errors, with the result (Zn ii) = 12.12 obtained by Prochaska & Wolfe (1999). We can not use the Zn ii 2062 Å absorption because it is contaminated by a sky emission line. The [Zn/Fe] abundance ratio are about solar, indicating the absence of dust depletion in this system (see Vladilo 2002a, and references therein).
3.2.2 The =2.4762 system
Column densities and metal abundances in this system are given in Table 6. The metal absorption lines from which elemental abundances are derived are shown in Fig. 5.
The damped Ly and Ly absorptions are used to derive the H i column density, (H i) = 20.780.08, in perfect agreement with (H i) = 20.790.10 reported by Pettini et al. (1997).
The N i column density is obtained from the analysis of the 1134.2, 1200.2 and 1200.7 Å transitions. The resulting parameters are used to build the synthetic spectrum for the six N i transitions shown in Fig. 5.
The Si ii transitions 1190, 1193, 1260, 1304 Å are saturated. The weakest transition 1020 Å has an asymmetric red wing which is not observed in any other feature of this absorber. In this case we fix the central wavelength at the redshift observed in the S ii triplet and we obtain (Si ii) = 14.950.10. Prochaska & Wolfe (1999) conservatively adopt the lower limit (Si ii) 14.46, obtained from the saturated 1526 Å line, arguing that the unsaturated Si ii 1808 line is blended with the Al iii 1862 line of the = 2.3745 system. However, these two transitions are separated by about 1 Å and they appear to be resolved in the spectrum of Prochaska & Wolfe (1999). We therefore adopt our Si ii column density, which is in perfect agreement with the result obtained by Prochaska & Wolfe (1999) from the 1808 Å line, (Si ii) = 14.960.02.
In the UVES spectrum, the lines of the sulphur triplet are clear from blending with other absorptions present in the spectrum. The derived column density, (S ii) = 14.590.03 is in agreement, within the errors, but much more accurate than the (S ii) = 14.810.21 value obtained from the ISIS/WHT spectrum, where the S ii triplet was not fully resolved.
The Fe ii column density, (Fe ii) = 14.550.07, is based on the analysis of the unsaturated and uncontaminated 1081 and 1096 Å transitions. Our value is consistent within the errors with the range of values 14.52 (Fe ii) 14.54 obtained by Prochaska & Wolfe (1999) from the saturated 1608 Å and the undetected 1611 Å transitions. Prochaska & Wolfe (1999) estimated a more stringent upper limit to the Zn ii column density than the one obtained here (see Table 6). The abundances of Zn ii and Cr ii derived by Prochaska & Wolfe, [Zn/H] –1.67 and [Cr/H] = –1.63, compared with that of iron obtained here, [Fe/H] = –1.69, indicate the absence of depletion of the refractory elements onto dust grains.
3.3 DLA at =1.9184 towards HE 09401050
The Ly profile of this absorber is located blueward of a strong Lyman limit system (LLS) at = 2.917, in a part of the spectrum which is thus strongly absorbed. A detailed analysis of this LLS is given in Levshakov et al. (2003b), where the H i column density of the DLA at =1.918 is also estimated. The Lyman series of the = 2.917 LLS allows to establish a local continuum shortward of Å and therefore to the damped Ly profile at = 1.918 (see upper panel of Fig. 1). This local continuum has then been used to derive the H i column density of the DLA system of (H i) . This system is strictly speaking a sub-DLA (Péroux et al. 2002), nevertheless, for completeness, we present the results of the abundance determinations of metals associated with this absorber.
In this system at = 1.9184, the N i 1134 Å multiplet falls near the atmospheric cutoff and the N i 1200 Å multiplet is heavily blended with Ly interlopers. Therefore the column density determination of nitrogen is not possible.
O i and Si ii column densities are constrained by 11 components whose and have been priorly determined from the joint fit of four Fe ii unsaturated lines (Fig. 6). O i 1302 Å is saturated and we only derive an upper limit: (O i) 16.89, by using the redshift and -parameters of the 11 components obtained from the Fe ii transitions. The same procedure is applied to the saturated Si ii 1260 Å transition since the weaker Si ii 1808 Å transition is contaminated on its right wing, and we find (Si ii) 15.42. S ii transitions ( 1250, 1253, 1259 Å) are all heavily blended with numerous Ly interlopers. Several Fe ii unsaturated lines are detected and have been used for the column density determination: 2344, 2382, 2586 and 2600 Å. The resulting column density is (Fe ii) = 14.440.02. The Zn ii 2026, 2062 Å transitions are not detected and from the stronger 2026 transition we estimate for each component a 3 limit to the column density of (Zn ii) 11.44. Table 7 provides a summary of the fitting parameters and column density results.
The metallicity of this system as measured by iron is [Fe/H] = –1.060.20. Furthermore the over Fe-peak ratio is high: we find [O/Fe] 1.21 and [Si/Fe] 0.92. Dust depletion may enhance the ratios involving iron, but not to the extent at which they are observed here (see Vladilo 2002a). Considering the low H i column density of the system ((H i) = 20.000.20), it is possible that the observed abundances are also affected by ionization corrections. If that is the case, the true [O/Fe] is expected to be lower than the observed one (e.g., Dessauges-Zavadsky et al. (2003). This could therefore explain our observational result. On the contrary, the true [Si/Fe] ratio, is expected to be higher than the one observed in the case where ionization is important. Nevertheless, it can be seen from Fig. 6, that the Si ii profile is likely contaminated by interlopers. Indeed, several absorptions to the blue and the red of the profile are observed. Additional contaminations inside the profile itself can not be excluded, although it looks saturated at first sight.
3.4 DLA at =2.3377 towards QSO 1232+0815
This DLA has been previously studied by Srianand et al. (2000) with the same UVES data, but they did not analyse the column densities of N i and S ii which are measured here for the first time.
Our derived neutral hydrogen column density, (H i) = 20.800.10 obtained from the Ly absorption is slightly lower than (H i) = 20.900.10 given by Srianand et al. (2000).
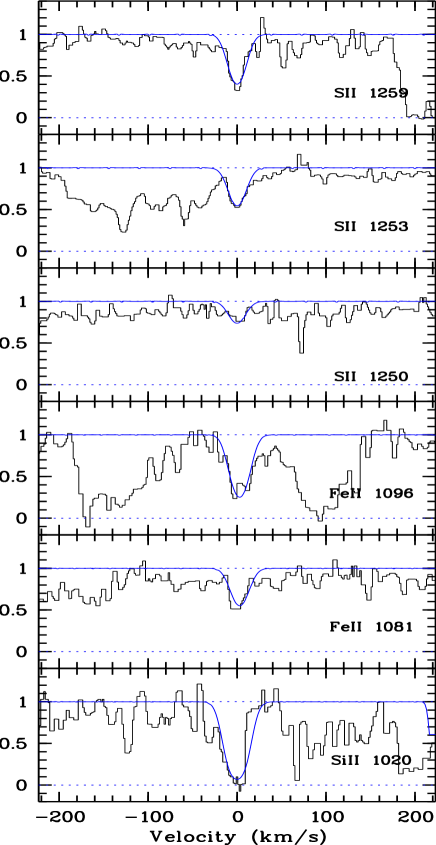
The metal profiles are well fitted by 6 components, three of them composing the main absorption around = 0 km s-1(relative to ), while the remaining three components are weaker and only observed in the strongest metal absorptions towards the blue, around = –60 km s-1 (see Fig. 7). The simultaneous fit to the Fe ii and Si ii absorptions, shown in the right panel of Fig. 7, is used to fix the redshift and -parameters of the six components. The derived and -values are further used to fit the N i and S ii absorptions. The resulting parameters of the fit for each component are given in Table 8 along with the total column densities and abundances.
The total column densities of Si ii and Fe ii are in agreement, within the errors, with those obtained by Srianand et al. (2000). For nitrogen we determine a total column density (N i) = 14.630.08 only taking into account the components around = 0 km s-1, since the components at –60 km s-1 are found to contribute at maximum 2% of the total column density (well inside the uncertainty interval of the column density). It is the first time that the S ii column density is measured by means of high resolution data, and we obtain (S ii) = 14.830.10 which is significantly larger (by 0.35 dex) than the value obtained by Ge et al. (2001) from low resolution spectra (FWHM 60 km s-1). In this work they measure the Zn ii column density and determine (Zn ii) = 12.710.14 which we adopt with some caution, since the Zn ii absorptions of this DLA fall outside the wavelength coverage of the UVES spectra analysed here. Using this Zn ii column density and our S ii column density, we obtain [S/Zn] = –0.410.17 which would be the lowest value ever measured in a DLA. It is worth noting that iron (from our analysis of the UVES data) is significantly underabundant with respect to Zn, [Fe/Zn] = –0.83, which would in turn indicates that iron is significantly depleted on dust. On the other hand, from our analysis of the UVES data we obtain a solar [Si/S] = –0.01 abundance ratio. If dust depletion is severe in this DLA, as indicated by the [Fe/Zn] abundance ratio, then we should expect an underabundance of Si with respect to S which is not observed. The apparent contradiction between these two results may reside in the Zn ii column density determination derived from low resolution spectra. For instance, if the Zn ii 2026 Å absorption analysed by Ge et al. (2001) is contaminated by atmospheric features, then the derived Zn ii column density will be overestimated and consequently the [S/Zn] and [Fe/Zn] ratios underestimated. A new determination of Zn ii column density by means of high resolution data is required in order to assess the degree of dust depletion and the abundance ratios in this DLA.
4 The N/ abundance ratio in DLAs
In order to study the behaviour of the N/ abundance ratios in DLAs, we have collected all abundance measurements obtained from high resolution spectra. In addition to the 5 new systems investigated here, we have compiled the DLAs with nitrogen and -capture element measurements available in the literature, from both HIRES/Keck and UVES/VLT. Our compilation, containing 33 systems, is listed in Table 8.
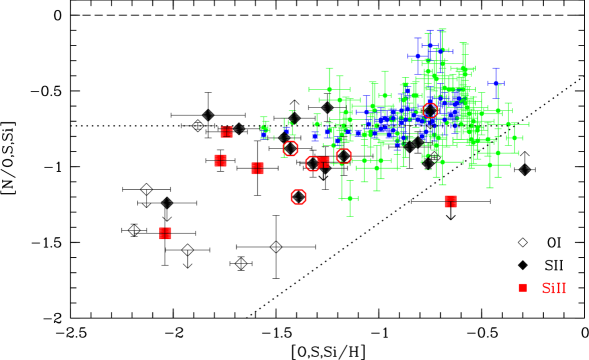
In Fig. 8 (upper panel), we plot the [N/] versus [/H] ratios. The figure contains 29 DLAs, since 4 systems with poorly stringent upper limits have been omitted for clarity. We consider O, S and Si as three possible estimators of abundance measurements in DLAs. In Fig. 8, abundance ratios are indicated with empty diamonds for [N/O] (7 cases), filled diamonds for [N/S] (16 cases) and filled squares for [N/Si] (6 cases). Our new measurements are indicated with additional circles.
When possible, we use O as the preferred -capture element. An important advantage of this element is that the N/O and O/H ratios are unaffected by ionization corrections since they are derived from the observed N i/O i and O i/H i ratios, i.e. from ratios between column densities of neutral species which are not altered by an intervening H ii region, if present. In addition, oxygen, similarly to nitrogen, is not affected by dust depletion. The drawback is the difficulty in measuring accurate O i column densities from unsaturated lines, as we mentioned in Section 3. Unsaturated O i transitions lie inside the Ly forest, where it is necessary to detect at least two of them in order to ascertain that they are not Ly interlopers.
The 5 N/O measurements, shown in Fig. 8, have been derived using accurate column densities of O i obtained from unsaturated or unblended transitions. Two stringent upper limits are also shown (see Table 8 for references).
When reliable O data are not available, we use sulphur or, alternatively, silicon as -element indicators. Both are produced in the same massive stars which produce oxygen and they track each other over a wide range of metallicities in Galactic stars (Chen et al. 2002; Nissen et al. 2002, and refs. therein) and in dwarf galaxies, including blue compact galaxies (Garnettt 1989; Skillman & Kenicutt 1993; Skillman et al. 1994; Izotov & Thuan 1999). One potential problem with S and Si in DLAs is that their abundances are obtained from S ii and Si ii ions which are dominant ionization states in H i clouds, but can also arise in intervening H ii gas.
Izotov et al. (2001) argue that intervening H ii gas is inherent to the DLAs ionization structure, yielding an increase of the S ii and Si ii column densities without affecting the N i column densities. As a consequence, the low [N/S,Si] ratios observed in some DLAs could be an artifact of ionization effects rather than a genuine nucleosynthetic effect. However, the model proposed by Izotov et al. (2001) predicts an overabundance of [Si/O] which is not observed in DLAs and this gives a strong evidence against the general presence of intervening H ii regions (Vladilo et al. 2003). In fact, relative abundances of low ionization species in DLAs, including those of Al iii, can be explained without invoking intervening H ii regions, in which case ionization correction for S ii and Si ii are in general negligible (Vladilo et al. 2001). As noted by Molaro (2003), the existence of very low values of the [N/O] ratio — for which negligible contribution from intervening H ii gas is expected — indicates that the low [N/Si,S] ratios are not due to ionization effects. In fact, all the DLAs with low [N/O] have also low [N/Si] values (see Fig. 8 and 9), confirming that Si ii ionization corrections are not relevant.
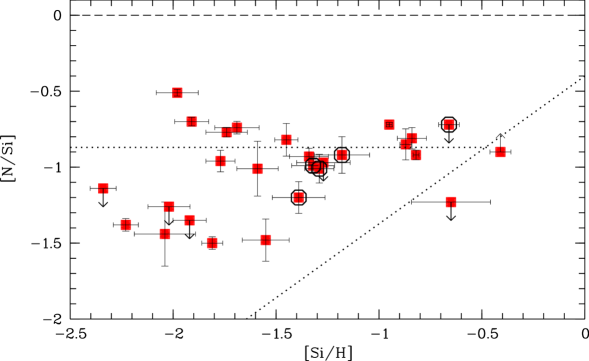
In addition to ionization, dust depletion could alter the observed abundance ratios. Silicon can be mildly depleted in DLAs (Vladilo 2002b). Sulphur is not depleted on dust and for this reason is preferred to silicon as an indicator of -elements. If Si is depleted, the observed [N/Si] ratios are larger than the intrinsic ones. Unfortunately, only one of the six DLAs of the [N/Si] sample has iron and zinc abundances, which are required to estimate the effect of dust depletion. For this system, the DLA towards QSO 1223+178, we obtain a minimum possible intrinsic ratio of [N/Si] = –1.12 by using different dust-correction models considered in Vladilo (2002a). The correction is inside the 1 error of the observed ratio [N/Si] = –1.010.18. By applying the same method to all DLAs with Si, Zn and Fe measurements, we find that the Si/H depletion correction is generally small, with a mean value dex and even lower median value. Therefore the Si depletion should not affect dramatically the [N/Si] plot.
In the bottom panel of Fig. 8, we show the data based on Si (20 measurements and 7 useful limits), the -capture element most widely measured in DLAs. By comparing the top and bottom panel of Fig. 8 (only 6 N/Si data points in common) one can see that the use of Si instead of O and S does not significantly change the overall behaviour of the ratios, confirming that depletion effects for Si are not important for the majority of the DLAs shown in the figure.
The nitrogen ratios in DLAs are concentrated in two groups. The majority of the [N/] values (22 out of 29) are distributed around –0.9 dex, with typical metallicities [/H] –0.8 dex (hereafter ‘high-N DLAs’), while the remaining 7 ratios have a relatively constant value around [N/] dex and metallicities [/H] dex (hereafter ‘low-N DLAs’). The distribution of N/ ratios in two sub-samples was first suggested by Prochaska et al. (2002), a result to be confirmed at that time, given the low number of DLAs with low [N/] values in their sample (only two HIRES/Keck measurements). One of our [N/] measurements (z=2.4 DLA in QSO 0841+129) shows an intermediate value between the low-N and high-N subsamples. However, as it can be seen in Fig. 9 this DLA has a N abundance 2.5 times larger than the highest N abundance observed in the low-N group, and for that reason we include it in the high-N subsample.
We use the homogeneous sample of [N/Si] data to perform an analysis of the two groups. Considering only the 20 N/Si measurements, we find 16 high-N DLAs, with a mean value [N/Si] = –0.87 0.16 (i.e., a standard deviation of 18% around the mean ([N/Si] = –0.84 0.14, if we exclude the z=2.4 DLA in QSO 0841+129), and 4 low-N DLAs with [N/Si] (i.e., a standard deviation of 3%). Therefore, the two groups differ in their [N/Si] ratios by 0.6 dex on the average. Both sub-samples are characterized by a low scatter of the [N/Si] ratios and, in particular, the scatter of the low-N DLAs sub-sample is essentially equal to the typical dispersion due to measurements errors. Even if the number of low-N DLAs is still small, it is worth noting that the increase from 2 measurements plus 1 upper limit (in Prochaska et al. 2002) to 4 measurements plus 3 upper limits (in the compilation presented here) still shows the [N/Si] ratios clustered around –1.5 dex with very low dispersion, confirming the existence of the low-N DLA sub-sample. We stress that with the available instrumentation (Keck+HIRES and VLT2+UVES) one should have been able to detect N i features at an abundance level [N/H] lower than that typical of low-N DLAs. For instance, the detection limit is [N/H] –3.9 at the average H i column density of the low-N DLAs for a S/N 25. This [N/H] limit is nearly a factor 2 times lower than the lowest value observed so far (the =2.8 system in QSO 1946+765). Therefore the the lack of detection of DLAs at [N/H] 3.6 dex probably reflects an intrinsic paucity of the population of DLAs at very low values of [N/H].
5 Discussion
To investigate the origin of N in DLAs we compare the observed abundance ratios involving this element with those measured in extragalactic metal-poor H ii regions and with predictions of galactic chemical evolution models.
Small dots in the top panel of Fig. 8 indicate [N/O] vs. [O/H] measurements in metal-poor H ii regions of dwarf galaxies which show a plateau with a mean value of [N/O] = –0.73 0.13 for metallicities [O/H] –0.8, we used this value in correspondence with the matallicities of the DLAs with [N/Si] measurements, (grey dots: Kobulnicky & Skillman 1996; van Zee et al. 1996; van Zee et al. 1997; black dots: measurements in BCD galaxies by Izotov & Thuan 1999).
The horizontal dashed line in Fig. 8 represents the average [N/O] ratio observed in BCD galaxies at low metallicities and is considered an empirical representation of the N/O level due to the primary production of N, since the N/O ratios are independent of metallicity. The tilted dashed line in the figure follows the [N/O] behaviour observed at [O/H] –0.5 in dwarves and spiral galaxies extrapolated to lower metallicities. This tilted line, is an empirical representation of the [N/O] rise due to the secondary production of N.
In our sample the high-N DLAs (22 out of 29 systems) are distributed around [N/] –0.9, comparable to the [N/] plateau of BCD galaxies, although DLAs extend to lower metallicities. Also the [N/] scatter in DLAs is comparable with the one observed in BCD galaxies. On the other hand, the low-N DLAs have [N/] , a factor of 5 lower than those measured in BCD galaxies and, in fact, the lowest ever observed in any astrophysical site.
5.1 The high-N subsample of DLAs
In the framework of chemical evolution models the plateau at [N/O] –0.7/–0.9 is considered as an evidence of the primary production of N at low metallicities, since the N abundance increases in lockstep with that of the primary oxygen. Most chemical evolution models (Pilyugin 1999; Henry et al. 2000; Maynet & Maeder 2002; Chiappini et al. 2002; Calura et al. 2002) supports the idea that the intermediate mass stars () are the dominant sites of this primary production of N (see, however, Izotov et al. 1999, 2001). In these models galaxies with continuous, low star formation rates (Henry et al. 2000) as well as galaxies with star formation occuring in bursts separated by quiescent periods (Pilyugin 1999) can both reproduce the N/ ratios observed in high-N DLAs and BCD galaxies. In galaxies with low star formation rate (SFR), the O and N abundance can increase in lockstep, if the time required to achieve the low metallicity observed is comparable to the lag time of intermediate mass stars to eject N. In galaxies with bursts, the intermediate mass stars have enough time to deliver primary N in the same proportion as O delivered by massive stars, if the quiescent periods between bursts are significantly longer than the lag time of the intermediate mass stars for the ejection of N.
In the framework of these models, the high-N plateau can be interpreted as an indication that the intermediate mass stars have already ejected the primary nitrogen synthesized by them. Even if the above models can reproduce the [N/] –0.9 plateau observed in DLAs, they predict a very steep increase of the N/ ratios, passing through the low-N DLAs ratios, but do not give a plateau at [N/] –1.5.
5.2 The low-N subsample of DLAs
In previous works on N abundances in DLAs where few measurements of low N/ ratios were available, (Pettini et al. 1995; Lu et al. 1998; Centurión et al. 1998; Pettini et al. 2002), the range between the few low N/ ratios and several high N/ values was considered to be a scatter due to the time-delay between the ejection of O by massive stars and the one of primay N by intermediate mass stars. The compilation of DLAs data presented here supports the idea of the existence of a sub-sample of DLAs with [N/] values clustered around –1.5 dex with a very low scatter, as suggested by Prochaska et al. (2002). As discussed in Sect. 4, we are now confident that the low N/ ratios in DLAs are real and not due to ionization effects.
These very low N/ ratios, only observed in DLAs, are a crucial evidence against the argument of Izotov et al. (1999, 2001), who proposed the primary production of N by massive stars to explain the plateau [N/] –0.7/–0.9 dex observed in BCD galaxies and the majority of DLAs. In the case of primary N from massive stars, the measured N/O values must constitute a lower envelope to any N/O ratio observed in galaxies, because the intermediate mass stars can only increase the N/O at a later time (Pilyugin 1999; Pilyugin et al. 2002). The present data suggest that the observational lower envelope is at [N/] , the values found in low-N DLAs. Therefore, the primary production by massive stars cannot explain the values [N/] –0.7/–0.9 dex measured in BCD galaxies and high-N DLAs, favouring the idea that this plateau is due to the primary production of N by intermediate mass stars.
In order to reproduce the low [N/] values for these DLAs, Prochaska et al. (2002) invoked a truncated initial mass function (IMF) at the low mass end (). With such IMF, the galaxies would experience an initial burst of star formation where only massive stars are formed. Chiappini et al. (2002) have pointed out that a top-heavy IMF as proposed by Prochaska et al. (2002) should cause a strong enhancement of the /Fe-peak ratios in these low-N DLAs, which in general is not observed (see below).
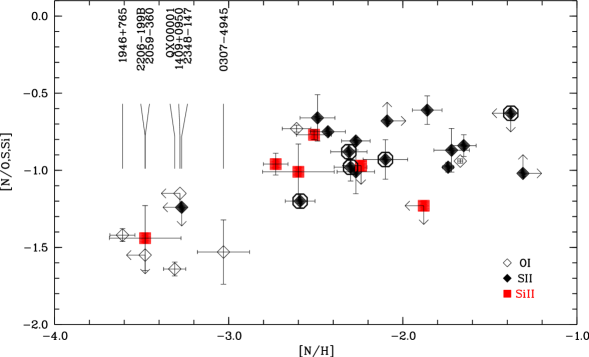
5.3 The [N/] values versus nitrogen abundances
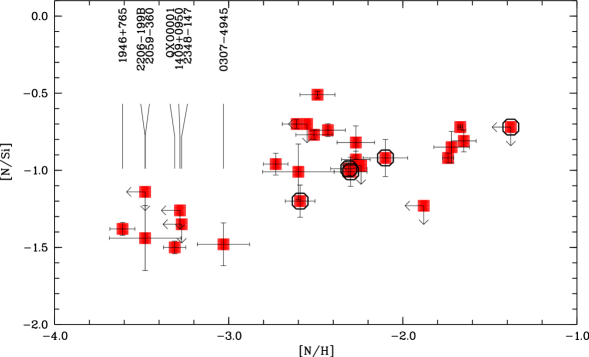
From the classical plot [N/] versus [/H] (see Fig. 8 ), one can see that low and high values of [N/] co-exist at a given [/H]. This result, if confirmed by further data, apparently suggests the presence of a bimodal distribution of [N/] ratios in DLAs, as proposed by Prochaska et al. (2002). As shown by Molaro (2003), the separation between the two groups of DLAs appears more clearly by plotting [N/Si] versus the nitrogen abundance, [N/H]. This can be seen in Fig. 9, where we plot [N/] (top panel) and [N/Si] (bottom panel) versus [N/H] for the full, combined sample. Systems with nitrogen abundances [N/H] appears to be separated from those with [N/H] . Thus there is no overlap between low and high [N/] ratios at a given [N/H], suggesting that the transition of the [N/] ratios appears at a particular value of the N abundance. To our knowledge, the separation of DLAs in two groups is not seen in other abundance measurements in these absorbers. The fact that the division between low- and high-N DLAs appears at a particular value of nitrogen abundance suggests that the separation may result from some peculiarity of the nitrogen enrichment history.
The very low ratios ([N/] ) observed in DLAs, together with their small scatter ( dex), have led Molaro (2003) to propose that this lower plateau could be due to primary production of nitrogen in massive stars. If massive stars produce primary nitrogen, no time delay is expected between the injection of nitrogen and that of oxygen and, as a consequence, a plateau with a small scatter of the N/O ratios is predicted (Pilyugin 1999). The fact that the [N/] values are the lowest ever observed suggests that they may indeed represent the first observational evidence of primary production by massive stars. The low dispersion of the DLAs [N/] values favours this interpretation, even if the present number of low-N measurements is still insufficient to establish firm conclusions. Clearly if other systems with even lower values of N/ are observed the source of N in the systems at [N/] will be called into question.
As mentioned in Sect. 1, the issue of primary production of nitrogen by massive stars is not settled. However, it is worth noting that the stellar models of Maynet & Maeder (2002), predict N/O and O/H ratios in agreement with those observed in the low-N DLAs by using a simple closed-box model and taking the integrated yields of massive stars (between 8 and 120 ) with high rotational velocity over a Salpeter IMF. Stellar evolution models of Umeda et al. (2000) for massive, metal-free Population III stars, show that primary production of N may be significant. Their nitrogen yields as a function of metallicity give a [N/Mg] for a star with zero metallicity, or for a star with a metallicity of . Even if these results from the literature do not provide a conclusive evidence that massive stars are responsible for a primary production of N in the low-N DLAs, at least they indicate that primary N production in massive stars is possible at the low level observed in the low-N DLAs, [N/O] .
If primary nitrogen from massive stars is responsible for the low values [N/] measured in DLAs, then the “classic” primary nitrogen plateau at [N/] –0.7/–0.9 must be due to intermediate mass stars, as claimed by the most recent works on chemical evolution. However, in these works the primary production in intermediate mass stars cannot explain the very low values, [N/] , observed in DLAs.
If future estimates of the yields of primary N in massive stars will be able to explain the observed low ratios, it will not be necessary to invoke a top-heavy IMF to explain the low-N DLAs. In this case, as Fig. 9 suggests, we might be seeing two different phases of the N enrichment in galaxies, rather than galaxies with a different way of creating stars. DLAs with [N/] –1.5 would be very young objects, caught before the ejection of primary N by intermediate mass stars, while DLAs with [N/] –0.9 will be older ones, caught after the lag time of the intermediate mass stars for the ejection of N. The transition between the low-N and high-N DLAs could be linked to the short lag time ( 250 Myr, see, e.g., Henry et al. 2000) of the N enrichment by intermediate mass stars.
On the other hand, we cannot completely rule out the possibility that the lack of DLAs between the low-N and high-N values observed in Fig. 9, results from the limited statistics of the sample. In this case we might be seeing the steep increase of N abundance in the course of evolution, due to the primary N production in intermediate mass stars as most of the current models predict. If new measurements in DLAs at very low N abundance will yield ratios lower than [N/] –1.5 or will fill the separation between low- and high-N values, this would be a crucial evidence in favour of this interpretation. The problem with this scenario is the very short time scale ( Myrs) predicted for the increase of the [N/] ratios well above –1.5 dex (see for instance Fig. 3b in Henry et al. 2000), which would make hard to detect low-N DLAs contrary to what observed.
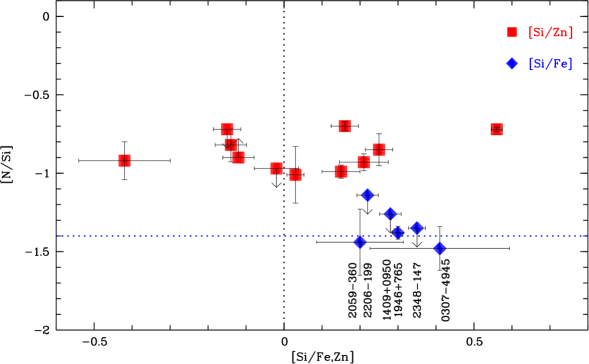
5.4 [N/] versus [/Fe] ratios
The /Fe ratios is a classical indicator of the galactic chemical evolution. The comparison of N/ versus /Fe ratios can be used to probe models of nitrogen enrichment. Qualitatively, if primary production of N in massive stars is invoked to explain the very low N/ ratios, we would expect that these DLAs show an enhancement of the -elements, — produced in the short-lived massive stars ending their lives as type-II supernovae (SNe) — relative to Fe-peak elements — ejected in longer time scales mainly by type-Ia SNe. It is worth keeping in mind that solar /Fe ratios are expected at low metallicities (comparable with those observed in DLAs) when star formation proceeds in bursts with long quiescent periods, or when star formation rates are low. In both cases the metal enrichment is so slow that SNe Ia have enough time to evolve and enrich the medium with iron-peak elements balancing the -elements previously produced by SNe II, when the overall metallicity is still low. If DLAs had a chemical evolution of this type, we could expect an enhancement lower than [Si/Fe] [S/Fe] +0.3, the value observed at [Fe/H] –1 (typically metallicity of DLAs as measured by Zn) in stars of our Galaxy (Chen et al. 2002), where the star formation has been much faster.
In analysing the /Fe ratios in DLAs care must be taken for dust depletion effects, which may alter the Fe abundance and the /Fe ratio. Unfortunately, none of the low-N DLAs have abundance determinations of Zn, the iron-peak element free from dust depletion. In Fig. 10, we plot [N/Si] versus [Si/Fe] for 6 of the low-N DLAs222The remaining low-N DLA towards QXO0001 has a poorly stringent upper limit on Fe abundance and hence [/Fe] abundance ratio (see Table 9). (diamonds) and also the [N/Si] versus [Si/Zn] ratios available for the high-N DLAs (squares). At first glance, the low-N DLAs show larger /Fe-peak ratios than the high-N DLAs. The observed enhancement, [Si/Fe] , could include some contribution due to dust depletion. However, the low-N DLAs are all characterized by very low metallicities, typically [Si/H] , in which case dust effects are expected to be less critical. Therefore, some of the enhancement of the [Si/Fe] ratios in low-N DLAs could be real. However, firm conclusions about the -enhancement cannot be drawn with the present data, and measurements of Zn abundance in low-N DLAs are required in order to clarify this issue.
6 Summary and conclusions
The Nitrogen abundances in DLAs investigated here show the following characteristics:
1. The DLAs can be tentatively divided in two groups which differ in the [N/] ratios by about 0.6 dex.
2. The high-N sub-sample contains 75% of DLAs which show a mean value of [N/] –0.87 with relatively low scatter (0.16 dex). The remaining DLAs belong to the low-N sub-sample, which shows ratios clustered at a mean value of [N/] –1.45 with an even lower dispersion (0.05 dex). The small number of low-N DLAs does not allow us to conclude whether the [N/] ratios at –1.5 dex constitute a plateau or not.
3. The low N/ values are not an effect of ionization. Direct measurements of O i and N i in DLAs for which negligible contribution from intervening H ii gas is expected, give low values of [N/O] –1.5, indicating that low [N/O] ratios are real. Moreover if ionization effects were relevant the [Si/O] ratios obtained from Si ii and O i lines should be enhanced and this is not observed in DLAs.
4. The low [N/] observed in DLAs is the lowest value ever observed in any astrophysical site. This is a crucial evidence against the primary production of N by massive stars, as responsible for the plateau at [N/] –0.7/–0.9 observed in BCD galaxies and in the majority of DLAs.
5. The origin of the two groups of DLAs appears to be related to their N abundance and therefore linked to the nucleosynthesis and enrichment history of this element. The transition between the two sub-samples occurs at [N/H] –2.8
6. Current standard models of chemical evolution can reproduce the [N/] –0.7/–0.9 plateau observed in BCD galaxies and high-N DLAs. These models pass through the low [N/] ratios, but do not give a plateau at –1.5 dex. If further measurements in DLAs will give more [N/] values clustered at –1.5 dex, the models will need to take into account this feature.
7. A top heavy IMF has been invoked to explain the observed low-N subsample of DLAs. We argue that the [N/] –1.5 ratios and their low dispersion may suggest a (modest) production of primary N in massive stars on top of which the primary production of N by intermediate mass stars is seen which rises the ratio to the value –0.9 dex observed in the majority of DLAs. In this scenario low-N DLAs would be very young objects, caught before the ejection of primary N by intermediate mass stars, while high-N DLAs will be older ones, caught after the lag time of the intermediate mass stars for the ejection of N.
Nitrogen in DLAs provides unique indications on the earlier stages of galactic evolution. The primary production of N deserves further investigation. Further constraints on our ideas of chemical evolution and origin of nitrogen could be possible thanks to a full set of abundance measurements of nitrogen, -elements and Zn in individual DLA systems. In particular, observations towards higher redshift systems will allow us to observe more DLAs at earlier stages of their evolution, probably belonging to the low-N DLA class.
Acknowledgements.
Special thanks are due to P. Bonifacio for making valuable comments on the manuscript. We have benefitted from useful discussions with F. Calura and C. Chiappini. CP is supported by a Marie Curie Fellowship. SAL is supported in part by the RFBR grant No. 00-02-16007.References
- (1) Bergeson S. D., & Lawler J. E. 1993a, ApJ, 408, 382
- (2) Bergeson S. D., & Lawler J. E. 1993b, ApJ, 414, L137
- (3) Bergeson S. D., Mullman K. L., & Lawler J. E. 1994, ApJ, 435, L157
- (4) Bonifacio P., Caffau E., Centurión M., Molaro P., & Vladilo G. 2001, MNRAS, 325, 767
- (5) Calura F., Matteucci F., & Vladilo G. 2002, MNRAS, in press (astro-ph/0211153)
- (6) Cardelli J. & Savage B. D. 1995, ApJ, 452, 275
- (7) Centurión M., Bonifacio P., Molaro P., & Vladilo G. 1998, ApJ, 509, 620
- (8) Centurión M., Bonifacio P., Molaro P., & Vladilo G. 2000, ApJ, 536, 540
- (9) Chen Y. Q., Nissen P. E., Zhao G., Asplund M. 2002, A&A, 390, 225
- (10) Chiappini C., Romano D., & Matteucci F. 2002 MNRAS, in press (astro-ph/0209627)
- (11) de la Varga, A., Reimers D., Tytler D., Barlow T., & Burles, S. 2000 A&A, 363, 69
- (12) Dekker H., D’Odorico S., Kaufer A., Delabre B., & Kotzlowski H. 2000, SPIE, 4008, 534
- (13) Dessauges-Zavadsky M., D’Odorico S., McMahon R. G. et al. 2001, A&A, 370, 426
- (14) Dessauges-Zavadsky M. et al. 2003, MNRAS submitted
- (15) D’Odorico, V. et al. 2003, in preparation
- (16) D’Odorico V., Petitjean P. & Cristiani S. 2002, A&A, 390, 13
- (17) Edmunds M.G. & Pagel B.E.J. 1978, MNRAS, 185, 77
- (18) Ellison S. L., Pettini M., Steidel C. C., & Shapley A. E. 2001, ApJ, 549, 770
- (19) Foltz C. B., Chaffee F. H., & Black J. H. 1988, ApJ, 324, 267
- (20) Fontana A., & Ballester P. 1995, The Messenger, 80, 37
- (21) Ge J., Bechtold J., Kulkarni V. P. 2001 ApJ, 547, L1
- (22) Green R. F., York D., Huang K. et al. 1995, in QSO Absorption Lines, ed. Georges Meylan (Berlin: Springer-Verlag), p. 85
- (23) Garnett D. R. 1989, ApJ, 345, 282
- (24) Grevesse N., & Sauval A. J. 1998, Space Sci Rev, 85, 161
- (25) Henry R. B. C., Edmunds M. G., & Köppen J. 2000, ApJ, 541, 660
- (26) Howk J. C., Sembach K. R., Roth K. C., Kruk J. W. 2000, ApJ, 544, 867
- (27) Holweger H. 2001, in Solar and Galactic Composition, ed. R. F. Wimmer-Schweingruber, AIP Conf. Proceed., 598, 23
- (28) Izotov Y., Schaerer D., & Charbonnel C. 2001, ApJ, 549, 878
- (29) Izotov Y. I., & Thuan T. X. 1999, ApJ, 511, 639
- (30) Kobulnicky H. A., & Skillman E. D. 1996, ApJ, 471, 211
- (31) Kulkarni V.P., Huang K., Green R.F. et al. 1996, MNRAS 279, 197
- (32) Levshakov S. A., Dessauges-Zavadsky M., D’Odorico S., & Molaro P. 2002, ApJ, 565, 696
- (33) Levshakov S. A., Centurión M., Kegel W. H., & Molaro P. 2003a, in preparation
- (34) Levshakov S. A., Agafonova I. I., Centurión M., & Molaro P. 2003b, A&A, in press (astro-ph/0210619)
- (35) Lopez S., Reimers D., Rauch M., Sargent W.L.W., Smette A. 1999, ApJ 513, 598
- (36) Lopez, S., Reimers D., D’Odorico S., Prochaska J. X. 2002, A&A 385, 778
- (37) Lu L., Sargent W. L. W., Barlow T. A., Churchill C. W., & Vogt S. 1996, ApJS, 107, 475
- (38) Lu L., Sargent W. L. W., & Barlow T. A. 1998, AJ, 115, 55
- (39) Marconi A., Matteucci F., & Tosi M. 1994, MNRAS, 270,35
- (40) Marigo P. 2001, A&A 370, 194
- (41) Meynet G. & Maeder A. 2002, A&A, 390, 561
- (42) Molaro 2003, in: C. Charbonnel D. Schaerer & G. Meynet (eds.), CNO in the Universe, ASP Conf. Ser., in press, astro-ph/0301407
- (43) Molaro P., Bonifacio P., Centurión M. et al. 2000, ApJ, 541, 54
- (44) Molaro P., Levshakov S. A, D’Odorico S., Bonifacio P., & Centurión M. 2001, ApJ, 549, 90
- (45) Morton D. C., Wright A. E., Peterson B. A., Jauncey D. L., Chen J. 1980, MNRAS, 193, 399
- Morton (1991) Morton D.C. 1991, ApJS, 77, 119
- (47) Nissen P. E., Primas F., Asplund M., Lambert D. L. 2002, A&A, 390, 235
- (48) Outram P. J., Chaffee F. H., & Carswell R. F. 1999, MNRAS, 310, 289
- (49) Péroux C., Petitjean P., Aracil B., & Srianand R. 2002, New Astronomy (in press), (astro-ph/0208450)
- (50) Péroux C. et al. 2003, in preparation
- (51) Pettini M., Lipman K., & Hunstead R. W. 1995, ApJ, 451, 100
- (52) Pettini M., Smith L. J., King D. L., Hunstead R. W. 1997, 486, 665
- (53) Pettini M., Ellison S., Bergeron J., & Petitjean P. 2002, A&A, 391, 21
- (54) Pilyugin L.S. 1992, A&A, 260, 58
- (55) Pilyugin L.S. 1999, A&A, 346, 428
- (56) Pilyugin L.S., Thuan, T.X., Vilchez, J.M. 2002 A&A, in press (astro-ph/0210225)
- (57) Prochaska J. X., & Wolfe A. M. 1999, ApJS, 121, 369
- (58) Prochaska J. X., Wolfe A. M., Tytler D. et al. 2001, ApJS, 137, 21
- (59) Prochaska J.X., Henry R.B.C., O’Meara J.M. et al. 2002, PASP, 114, 933
- (60) Skillman E. D., & Kennicutt R. C., 1993, ApJ, 411, 655
- (61) Skillman E. D., Terlevich R. J., Kennicutt R. C., Garnett D. R., & Terlevich E. 1994, ApJ, 431, 172
- (62) Spitzer L. Jr. & Fitzpatrick E. L. 1993, ApJ, 409, 299
- (63) Srianand R., Petitjean P., & Ledoux C. 2000, Nat, 408, 931
- (64) Talbot R. & Arnett D. 1974, ApJ, 190, 605
- (65) Thuan T., Izotov Y. I., Lipovetsky V. A. 1995, ApJ 445, 108
- (66) Umeda H., Nomoto K., & Nakamura T. 2000, in The First Stars, eds. A. Weiss, T. Abel, and V. Hill, (Springer, Heidelberg), 150
- (67) van Zee L., Haynes M. P., Salzer J, J., Broeils A. H. 1996, AJ, 112, 129
- (68) van Zee L., Haynes M. P., Salzer J. J., 1997, AJ, 114, 2497
- (69) Vladilo G. 1998, ApJ, 493, 583
- (70) Vladilo G. 2002a, ApJ, 569, 295
- (71) Vladilo G. 2002b, A&A, 391, 407
- (72) Vladilo G., D’Odorico S., Molaro P., Savaglio S., 1995, in QSO Absorption Lines, ed. G. Meylan (Springer-Verlag), 103
- (73) Vladilo G., Centurión M., Bonifacio P., & Howk, J. C. 2001, ApJ, 557, 1007
- (74) Vladilo G., Centurión M., D’Odorico V., & Peroux C. 2003, A&A, submitted
- (75) Welty D. E., Hobbs L. M., Lauroesch J. T. et al. 1999, ApJS, 124, 465
- (76) Wolfe A. M., Turnshek, D. A., Smith, H. E., Cohen, R. D. 1986, ApJS, 95, 196
- (77) Woosley S. E. & Weaver T. A. 1995, ApJS, 101, 181
| Transition | , Å | fλ | Refb | ||
|---|---|---|---|---|---|
| Ly- | 1025. | 7223 | 0. | 07912 | 1 |
| Ly- | 1215. | 6701 | 0. | 41640 | 1 |
| NI 1134.1 | 1134. | 1653 | 0. | 01342 | 1 |
| NI 1134.4 | 1134. | 4149 | 0. | 02683 | 1 |
| NI 1134.9 | 1134. | 9803 | 0. | 04023 | 1 |
| NI 1199.5 | 1199. | 5496 | 0. | 13280 | 1 |
| NI 1200.2 | 1200. | 2233 | 0. | 08849 | 1 |
| NI 1200.7 | 1200. | 7098 | 0. | 04423 | 1 |
| NI 953.4 | 953. | 4152 | 0. | 01063 | 1 |
| OI 1025 | 1025. | 7616 | 0. | 01700 | 1 |
| OI 1026 | 1026. | 4757 | 0. | 00246 | 1 |
| OI 1039 | 1039. | 2303 | 0. | 00920 | 1 |
| OI 1302 | 1302. | 1685 | 0. | 04887 | 1 |
| OI 1355 | 1355. | 5977 | 1. | 248E-06 | 1 |
| SiII 989 | 989. | 8731 | 0. | 13300 | 1 |
| SiII 1020 | 1020. | 6989 | 0. | 02828 | 1 |
| SiII 1190 | 1190. | 4158 | 0. | 25020 | 1 |
| SiII 1193 | 1193. | 2897 | 0. | 49910 | 1 |
| SiII 1260 | 1260. | 4221 | 1. | 00700 | 1 |
| SiII 1304 | 1304. | 3702 | 0. | 08600 | 2 |
| SiII 1526 | 1526. | 7065 | 0. | 11000 | 2 |
| SiII 1808 | 1808. | 0126 | 0. | 00218 | 3 |
| SII 947 | 946. | 9780 | 0. | 00498 | 4 |
| SII 1250 | 1250. | 5840 | 0. | 00545 | 1 |
| SII 1253 | 1253. | 8110 | 0. | 01088 | 1 |
| SII 1259 | 1259. | 5190 | 0. | 01624 | 1 |
| FeII 1055 | 1055. | 2617 | 0. | 00800 | 1 |
| FeII 1062 | 1062. | 1520 | 0. | 00380 | 1 |
| FeII 1063 | 1063. | 1764 | 0. | 05998 | 1 |
| FeII 1063.9 | 1063. | 9720 | 0. | 00370 | 5 |
| FeII 1081 | 1081. | 8748 | 0. | 01400 | 1 |
| FeII 1083 | 1083. | 4204 | 0. | 00406 | 1 |
| FeII 1085 | 1085. | 1381 | 0. | 00015 | 1 |
| FeII 1096 | 1096. | 8770 | 0. | 03199 | 1 |
| FeII 1106.2 | 1106. | 2208 | 0. | 00001 | 1 |
| FeII 1106.3 | 1106. | 3596 | 0. | 00150 | 1 |
| FeII 1110 | 1110. | 2803 | 0. | 00112 | 1 |
| FeII 1112 | 1112. | 0480 | 0. | 00620 | 5 |
| FeII 1121 | 1121. | 9749 | 0. | 02000 | 1 |
| FeII 1125 | 1125. | 4478 | 0. | 01600 | 5 |
| FeII 1127 | 1127. | 0984 | 0. | 00300 | 1 |
| FeII 1133 | 1133. | 6650 | 0. | 00600 | 1 |
| FeII 1142 | 1142. | 3656 | 0. | 00420 | 5 |
| FeII 1143 | 1143. | 2260 | 0. | 01331 | 1 |
| FeII 1144 | 1144. | 9379 | 0. | 10500 | 1 |
| FeII 1260 | 1260. | 5330 | 0. | 02500 | 1 |
| FeII 1588 | 1588. | 6876 | 0. | 00012 | 1 |
| FeII 1608 | 1608. | 4510 | 0. | 05800 | 6 |
| FeII 1611 | 1611. | 2004 | 0. | 00130 | 6 |
| FeII 1901 | 1901. | 7729 | 0. | 00010 | 1 |
| FeII 2249 | 2249. | 8767 | 0. | 00182 | 7 |
| FeII 2260 | 2260. | 7805 | 0. | 00244 | 7 |
| FeII 2344 | 2344. | 2141 | 0. | 11400 | 6 |
| FeII 2374 | 2374. | 4612 | 0. | 03130 | 6 |
| FeII 2382 | 2382. | 7649 | 0. | 30060 | 1 |
| FeII 2586 | 2586. | 6499 | 0. | 06840 | 8 |
| FeII 2600 | 2600. | 1729 | 0. | 22390 | 1 |
| ZnII 2026 | 2026. | 1360 | 0. | 48860 | 9 |
| ZnII 2062 | 2062. | 6641 | 0. | 25640 | 9 |
aVacuum rest wavelength
bREFERENCES — 1: Morton (1991); 2: Spitzer & Fitzpatrick (1993); 3:
Bergeson & Lawler (1993b); 4: Bonifacio et al. (2001);
5: Howk et al. (2000); 6: Welty et al. (1999); 7:
Bergeson et al. (1994); 8: Cardelli & Savage (1995); 9:
Bergeson & Lawler (1993a).
| Ion | , Å | (X), cm-2 | [X/H] |
|---|---|---|---|
| H i | 1215 | 20.950.05 | |
| N i | 1134.4 | 14.580.08 | –2.300.09 |
| 1134.9 | |||
| Si ii | 1304 | 15.220.05 | –1.290.07 |
| 1526 | |||
| 1808 | |||
| S ii | 1253 | 14.830.04 | –1.320.06 |
| Fe ii | 1125 | 14.850.09 | –1.600.10 |
| 1608 | |||
| 1611 | |||
| 2344 | |||
| 2374 | |||
| 2586 | |||
| Zn ii | 2062 | 12.13 |
| Ion | , Å | (X), cm-2 | [X/H] |
|---|---|---|---|
| H i | 1215 | 21.110.04 | |
| N i | 953.4 | 15.66 | –1.38 |
| 1134.1 | |||
| 1134.4 | |||
| 1134.9 | |||
| 1199.5 | |||
| 1200.2 | |||
| 1200.7 | |||
| Si ii | 1808 | 16.010.03 | –0.660.06 |
| S ii | 1250 | 15.560.02 | –0.750.04 |
| 1253 | |||
| Fe ii | 1081 | 15.470.02 | –1.140.04 |
| 1096 | |||
| 1125 | |||
| 1608 | |||
| 2374 | |||
| Zn ii | 2026 | 13.270.03 | –0.510.05 |
| Ion | , Å | (X), cm-2 | [X/H] |
|---|---|---|---|
| H i | 1215 | 21.000.10 | |
| N i | 1134.4 | 14.620.03 | –2.310.10 |
| 1134.9 | |||
| Si ii | 1304 | 14.65a | –1.91a |
| S ii | 1259 | 14.770.03 | –1.430.10 |
| Fe ii | 1081 | 14.870.04 | –1.630.11 |
| 1121 | |||
| 1125 | |||
| 1133 | |||
| 1143 | |||
| 1144 | |||
| Zn ii | 2026 | 12.200.05 | –1.470.11 |
aProchaska & Wolfe (1999) obtained from the unsaturated Si ii 1808 Å transition (Si ii) = 15.240.03, which yields [Si/H] = –1.320.10.
| Ion | , Å | (X), cm-2 | [X/H] |
|---|---|---|---|
| H i | 1215 | 20.780.08 | |
| 1025 | |||
| N i | 1134.4 | 14.120.03 | –2.590.09 |
| 1200.2 | |||
| 1200.7 | |||
| Si ii | 1020 | 14.950.10 | –1.390.13 |
| S ii | 1250 | 14.590.03 | –1.390.09 |
| 1253 | |||
| 1259 | |||
| Fe ii | 1081 | 14.550.07 | –1.730.11 |
| 1096 | |||
| Zn ii | 2026 | 12.13a | –1.32 |
aProchaska & Wolfe (1999) obtained a more restrictive limit
(Zn ii) 11.78, which yields
[Zn/H] –1.67
| Ion | , Å | (X), cm-2 | [X/H] |
|---|---|---|---|
| H i | 1215 | 20.000.20 | |
| O i | 1302 | 16.89 | 0.15 |
| Si ii | 1260 | 15.42 | –0.14 |
| Fe ii | 2344 | 14.440.02 | –1.060.20 |
| 2382 | |||
| 2586 | |||
| 2600 | |||
| Zn ii | 2026 | 12.48 | –0.19 |
| Ion | , Å | (X), cm-2 | [X/H] |
|---|---|---|---|
| H i | 1215 | 20.800.10 | |
| N i | 1134.1 | 14.630.08 | –2.100.13 |
| 1134.4 | |||
| 1134.9 | |||
| 1199.5 | |||
| 1200.2 | |||
| 1200.7 | |||
| Si ii | 1304 | 15.180.09 | –1.180.13 |
| 1526 | |||
| S ii | 1250 | 14.830.10 | –1.170.14 |
| 1253 | |||
| 1259 | |||
| Fe ii | 1125 | 14.710.08 | –1.590.13 |
| 1608 | |||
| 1611 |
| QSO | (H i), | (N i), | [N/] | [/H] | - | [N/Si] | [Si/H] | Refb | |
|---|---|---|---|---|---|---|---|---|---|
| cm-2 | cm-2 | elem. | |||||||
| 0000–263 | 3.390 | 21.41 0.08 | 14.73 0.02 | –0.73 0.05 | –1.88 0.09 | O | –0.70 0.03 | –1.91 0.08 | 1 |
| 0100+130 | 2.309 | 21.37 0.08 | 15.03 0.02 | –0.81 0.02 | –1.46 0.08 | S | –0.93 0.05 | –1.34 0.09 | 2,3 |
| 0201+1120 | 3.386 | 21.26 0.06 | 15.33 0.06 | –0.61 0.09 | –1.25 0.09 | S | 4 | ||
| 0201+365 | 2.462 | 20.38 0.05 | 15.00 | –1.02 | –0.29 0.05 | S | –0.90 | –0.41 0.05 | 2 |
| 0307–4945 | 4.466 | 20.67 0.09 | 13.57 0.12 | –1.53 0.21 | –1.50 0.19 | O | –1.48 0.14 | –1.55 0.11 | 5 |
| 0336–0142 | 3.062 | 21.20 0.10 | 15.04 | –0.68 | –1.41 0.10 | S | 2 | ||
| 0347–383 | 3.025 | 20.63 0.01 | 14.89 0.01 | –0.94 0.01 | –0.73 0.01 | O | –0.72 0.01 | –0.95 0.01 | 6 |
| 0528–250 | 2.141 | 20.95 0.05 | 14.58 0.08 | –0.98 0.09 | –1.32 0.06 | S | –1.01 0.09 | –1.29 0.07 | 7 |
| 0528–250 | 2.811 | 21.11 0.04 | 15.66 | –0.63 | –0.75 0.04 | S | –0.71 | –0.66 0.07 | 7 |
| 0741+4741 | 3.017 | 20.48 0.10 | 13.98 0.01 | –0.75 0.02 | –1.68 0.10 | S | –0.74 0.04 | –1.69 0.11 | 2 |
| 0841+129 | 2.374 | 21.00 0.10 | 14.62 0.03 | –0.88 0.04 | –1.43 0.10 | S | –0.99 0.04 | –1.32 0.10 | 7 |
| 0841+129 | 2.476 | 20.78 0.08 | 14.12 0.03 | –1.20 0.04 | –1.39 0.09 | S | –1.20 0.10 | –1.39 0.13 | 7 |
| 0930+2858 | 3.235 | 20.30 0.10 | 13.74 0.01 | –0.66 0.15 | –1.83 0.18 | S | –0.51 0.02 | –1.98 0.10 | 2 |
| 1055+4611 | 3.317 | 20.34 0.10 | 14.09 | –0.57 | –1.61 | Sia | –0.57 | –1.61 | 3 |
| 1117–1329 | 3.351 | 20.84 0.12 | 14.53 | –0.97 | –1.27 0.13 | Si | –0.97 | –1.27 0.13 | 8 |
| 1122–1648 | 0.681 | 20.45 0.15 | 14.50 | –1.23 | –0.65 0.19 | Si | –1.23 | –0.65 0.19 | 9 |
| 1202–0725 | 4.382 | 20.60 0.05 | 13.80 0.10 | –0.96 0.07 | –1.77 0.07 | Si | –0.96 0.07 | –1.77 0.07 | 10 |
| 1223+178 | 2.465 | 21.50 0.10 | 14.83 0.18 | –1.01 0.18 | –1.59 0.10 | Si | –1.01 0.18 | –1.59 0.10 | 2,11 |
| 1232+0815 | 2.337 | 20.80 0.10 | 14.63 0.08 | –0.93 0.13 | –1.17 0.14 | S | –0.92 0.12 | –1.18 0.13 | 7 |
| 1331+170 | 1.776 | 21.18 0.04 | 14.84 0.10 | –1.01 0.14 | –1.26 0.11 | S | –0.82 0.11 | –1.45 0.06 | 2,11,12,13 |
| 1409+0950 | 2.456 | 20.54 0.10 | 13.19 | –1.15 | –2.13 0.12 | O | –1.26 | –2.02 0.10 | 14 |
| 1425+6039 | 2.826 | 20.30 0.04 | 14.70 0.01 | –0.50 | –1.03 | Sia | –0.50 | –1.03 | 2 |
| 1759+75 | 2.625 | 20.80 0.01 | 14.99 0.03 | –0.98 0.03 | –0.76 0.10 | S | –0.92 0.03 | –0.82 0.10 | 9,12,15 |
| 1946+765 | 2.844 | 20.27 0.06 | 12.59 0.04 | –1.42 0.04 | –2.19 0.06 | O | –1.38 0.04 | –2.23 0.06 | 2,11 |
| 2059–360 | 2.507 | 20.21 0.10 | 12.66 0.18 | –1.44 0.21 | –2.04 0.15 | Si | –1.44 0.21 | –2.04 0.15 | 16 |
| 2206–199 | 2.076 | 20.43 0.06 | 12.88 | –1.55 | –1.93 0.11 | O | –1.14 | –2.34 0.06 | 14 |
| 2212–1626 | 3.662 | 20.20 0.08 | 13.58 | –0.70 | –1.85 0.08 | Sia | –0.70 | –1.85 0.08 | 3,17 |
| 2233+1310 | 3.149 | 20.00 0.10 | 14.32 | –0.56 | –1.05 | Sia | –0.56 | –1.05 | 3 |
| 2243–6031 | 2.330 | 20.67 0.02 | 14.88 0.10 | –0.87 0.14 | –0.85 0.10 | S | –0.85 0.10 | –0.87 0.03 | 18 |
| 2343+1232 | 2.431 | 20.35 0.05 | 14.63 0.05 | –0.84 0.07 | –0.81 0.07 | S | –0.81 0.07 | –0.84 0.07 | 19,20 |
| 2344+1228 | 2.537 | 20.36 0.10 | 13.78 0.03 | –0.77 0.03 | –1.74 0.10 | Si | –0.77 0.03 | –1.74 0.10 | 2 |
| 2348–147 | 2.279 | 20.56 0.08 | 13.22 | –1.24 | –2.03 0.14 | S | –1.35 | –1.92 0.08 | 2 |
| QXO0001 | 3.000 | 20.70 0.05 | 13.32 0.04 | –1.64 0.04 | –1.67 0.05 | O | –1.50 0.04 | –1.81 0.05 | 2 |
aThese values are not plotted in Figures 8,9,10
since limits are not restrictive enough
bREFERENCES — 1: Molaro et al. (2001); 2: Prochaska et al. (2002);
3: Lu et al. (1998); 4 Ellison et al. (2001);
5: Dessauges-Zavadsky et al. (2001); 6: Levshakov et al. (2002);
7: This work; 8: Péroux et al. (2002); 9: de la Varga et al. (2002);
10: D’Odorico et al. (2003);
11: Prochaska et al. (2001); 12: Prochaska & Wolfe (1999);
13: Kulkarni et al. (1996); 14: Pettini et al. (2002);
15: Outram et al. (1999); 16: Dessauges-Zavadsky et al. (2003);
17: Lu et al. (1996); 18: Lopez et al. (2002);
19: D’Odorico et al. (2002); 20: D’Odorico V. (private communication),
the N, S, and Si column densities have been recomputed using
Morton (1991) oscillator strength values.