Optical and NIR monitoring of the GRB020405 afterglow
Abstract
Optical and near-infrared (NIR) observations of GRB020405 started about 1 day after the GRB and extended over 70 days. Photometry shows that the early decay is consistent with a single power law of index = 1.540.06 in all bands. The late epoch light curves, sampled with HST and VLT, exhibit a plateau or slight rebrightening around 10-20 days after the GRB. This bump can be modeled with a SN2002ap template underlying the afterglow. Alternatively, the late-epoch data can also be fitted using a power law with index steeper ( = 1.850.15) than that of the early decay phase, in agreement with a late shell collision interpretation. Spectroscopy indicates that the GRB is at = 0.691 and that the host galaxy complex is angularly close to a system of at least two galaxies at = 0.472. -band polarimetry shows that the afterglow is polarized, with = 1.50.4 % and polarization angle = 172∘8∘.
1IASF/CNR, Bologna; 2INAF - Astron. Obs. of Trieste; 3Univ. of Bologna; 4IRA/CNR, Florence; 5INAF - Astron. Obs. of Rome and JHU, Baltimore; 6Univ. of Amsterdam; 7Univ. of Leicester; 8IAA, Granada; 9STScI, Baltimore; 10MPE, Garching; 11Univ. of Copenhagen
1. Introduction
GRB020405 was detected by the Interplanetary Network on 2002 April 5.02877 UT with a duration of 40 s (Hurley et al. 2002). Its optical afterglow was detected by Price et al. (2002a) and confirmed by subsequent observations (e.g. Covino et al. 2002). Optical spectroscopy allowed Masetti et al. (2002a) and Price et al. (2002b) to determine the redshift of the GRB, = 0.691.
Here we report on optical imaging, spectroscopy and polarimetry, and near-infrared (NIR) imaging of the GRB020405 afterglow acquired as part of our ongoing programs of optical/NIR follow-up of GRB afterglows at ESO and other telescopes. We also included the available archival HST pointings. In particular, our NIR observations allowed the first detection of this afterglow at these wavelengths. A more detailed presentation will appear in Masetti et al. (2003, in preparation).


2. Observations
Optical and NIR photometry has been accomplished at several ESO telescopes over a period of 10 days, starting on 6 April 2002. Early optical imaging was acquired also at TNG and WHT (Canary Islands, Spain) and at the 1.04-m UPSO (Naini Tal, India). The ground-based data set has been complemented by archival HST data taken at later epochs.
Optical spectra were taken at VLT-Melipal on April 6 and 7 with a dispersion of 5.5 and 2.6 Å/pix, respectively. In the second spectroscopic observation the slit was rotated of about 40∘ with respect to the North-South direction in order to include in the slit the OT and two nearby galaxies (see Sect. 3). Furthermore, a -band polarimetric measurement was acquired at VLT-Melipal on April 6.
3. Results
Light curves. In order to take into account the contribution of the host galaxy to the optical transient (OT) emission in the ground-based photometry, we followed two ways: (i) we fitted the light curves with a simple power law plus constant; (ii) we measured, on the latest available HST images, the contribution of the host galaxy complex within an aperture radius matching the ground-based telescopes PSFs. The two methods gave consistent results, and showed that the host contribution to the OT luminosity is of the order of few percent (and thus negligible within the uncertainties) in the first days of observation.

The host-subtracted ground-based optical measurements are fitted by a single power law decay, with index = 1.540.06. The host contribution in the HST images was estimated and subtracted as well by applying a PSF-based method for the OT removal. The addition of the HST data points to the light curves made it apparent the presence of a deviation from the early single power-law behaviour, i.e. a slight rebrightening followed by a decay (Fig. 1, left). In the light curves, this “bump” is equally well fitted with an emerging SN akin 2002ap, and 1.3 mag brighter, at the OT redshift ( = 0.691), and with a SN1998bw dimmed by 0.6 mag (see also Price et al. 2002b). -band data (Fig. 1, upper left) are instead poorly fitted by either SN. Alternatively, the bump may be interpreted with a shell collision re-energization scenario, as proposed by Kumar & Piran (2000) and Beloborodov (2002). This explanation would be supported by the satisfactory fit of the light curves past the bump (from day 20 to 70 after GRB) with a second power law of index = 1.850.15 (Fig. 1, right).
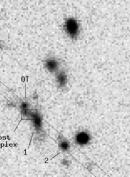
Spectra. The spectra acquired on April 6 and 7 with VLT-FORS1 show Balmer, [OII] and [OIII] lines in emission and FeII and MgII in absortion. From these, we measure a redshift = 0.6910.002 for the GRB. Both absorption and emission features in the OT spectrum are consistent with this value. To acquire both the spectrum of the OT and those of Galaxies 1 and 2 located at 2′′ and 6′′ southwest of it, on April 7 the 1′′-wide FORS1 slit was rotated by 40∘ towards East with respect to the N-S direction (Fig. 2, left panel).
From the detection of [OII] and [OIII] emission lines in their spectra, both Galaxies 1 and 2 appear to be at a substantially lower redshift, = 0.4720.002, than the OT host galaxy (Fig. 2, right). Thus, although angularly close to the host galaxy complex of GRB020405, Galaxy 1 is not interacting with the GRB host galaxy, as formerly proposed by Masetti et al. (2002b). The preliminary estimate of the redshift of Galaxy 1 was incorrect, due to an improper subtraction of the host complex contribution from its spectrum.
Optical-NIR spectral flux distribution. Using photometry data, we have constructed 5 optical-NIR broadband spectra. The data points were corrected for the Galactic absorption ( = 0.055; Schlegel et al. 1998; Cardelli et al. 1989) and converted into fluxes according to Fukugita et al. (1995) for the optical and to Bersanelli et al. (1991) for the NIR. The spectra of the first two epochs were not corrected for the host contribution because this is known for the bands only; however, given this was quite modest at those epochs, we simply added a 5% error in quadrature to the uncertainties in the optical-NIR fluxes.
The two earliest spectra clearly show a break at 2.51014 Hz, i.e. in the band, with slopes = 0.650.2 and = 1.30.2. This break can be interpreted as the synchrotron cooling frequency in the simplest case of a spherical fireball expanding in a homogeneous medium (Sari et al. 1998) and with electron distribution index 2.6. Broadband spectra of the three following epochs, made with points, were instead plotted by subtracting the host contribution. The spectral slopes on these three epochs are consistent with the optical one on the first two epochs. The broad-band spectra of the OT emission during and after the “bump” have a steeper power law shape, = 3.50.5, in agreement with the findings of Price et al. (2002b).
Polarimetry. Our -band polarimetry data indicate for the OT a linear polarization = 1.50.4 % and a polarization angle = 172∘8∘. This result is corrected for possible instrumental and interstellar polarization by using field stars and polarization standard stars. This value for the polarization is consistent with those measured by Covino et al. (2002), but is at variance with that ( 10%) obtained by Bersier et al. (2002) from -band observations acquired nearly simultaneously with ours.
References
Beloborodov, A.M. 2002, ApJ, submitted (astro-ph/0209228)
Bersanelli, M., Bouchet, P., & Falomo, R. 1991, A&A, 252, 854
Bersier, D., et al. 2002, ApJ, submitted (astro-ph/0206465)
Cardelli, J.A., Clayton, G.C. & Mathis, J.S., 1989, ApJ, 345, 245
Covino, S., et al. 2002, A&A in press (astro-ph/0211245)
Fukugita, M., Shimasaku, K., & Ichikawa, T. 1995, PASP, 107, 945
Hurley, K., Cline, T., Frontera, F., et al. 2002, GCN #1329
Kumar, P., & Piran, T. 2000, ApJ, 532, 286
Masetti, N., Palazzi, E., Pian, E., et al. 2002a, GCN #1330
Masetti, N., Palazzi, E., Maiorano, E., et al. 2002b, GCN #1375
Price, P.A., et al. 2002a, GCN #1326
Price, P.A., et al. 2002b, ApJ, submitted (astro-ph/0208008)
Sari, R., Piran, T., & Narayan, R. 1998, ApJ, 497, L17
Schlegel, D.J., Finkbeiner, D.P., & Davis, M. 1998, ApJ, 500, 525