Thermal and Non-thermal Plasmas in the Galaxy Cluster 3C 129
Abstract
We describe new Chandra spectroscopy data of the cluster which harbors the prototypical “head tail” radio galaxy 3C 129 and the weaker radio galaxy 3C 129.1. We combined the Chandra data with Very Large Array (VLA) radio data taken at 0.33, 5, and 8 GHz (archival data) and 1.4 GHz (new data). We also obtained new HI observations at the Dominion Radio Astrophysical Observatory (DRAO) to measure the neutral Hydrogen column density in the direction of the cluster with arcminute angular resolution. The Chandra observation reveals extended X-ray emission from the radio galaxy 3C 129.1 with a total luminosity of 1.5 erg s-1. The X-ray excess is resolved into an extended central source of 2″(1 kpc) diameter and several point sources with individual luminosities up to 2.1 erg s-1. There is no evidence for a correlation between the 3C 129.1 X-ray and radio morphology. In the case of the radio galaxy 3C 129, the Chandra observation shows, in addition to core and jet X-ray emission reported in an earlier paper, some evidence for extended, diffuse X-ray emission from a region east of the radio core. The 12″36″(6 kpc 17 kpc) region lies “in front” of the radio core, in the same direction into which the radio galaxy is moving. We use the radio and X-ray data to study in detail the pressure balance between the non-thermal radio plasma and the thermal Intra Cluster Medium (ICM) along the tail of 3C 129 which extends over 15′(427 kpc). Depending on the assumed lower energy cutoff of the electron energy spectrum, the minimum pressure of the radio plasma lies a factor of between 10 and 40 below the ICM pressure for a large part of the tail. We discuss several possibilities to explain the apparent pressure mismatch.
1 Introduction
Observations of Radio Galaxies within Galaxy Clusters
Tailed radio galaxies within galaxy clusters have drawn intensive study for several decades on both theoretical and observational grounds. Radio and X-ray data complement each other in that the radio data show high resolution images of the jets and more extended synchrotron features yielding information on strength and orientation of the magnetic field within the radio plasma and between the radio galaxy and the observer, while the X-ray data gives information about the temperature, chemical composition, density, and pressure of the Intracluster Medium (ICM). Thus, the jets propagate into a well defined medium, which greatly facilitates the interpretation of the radio images. It becomes possible to study, for example, the pressure balance between the radio-plasma and ICM, and thus to search for hidden pressure components in the radio plasma. Various authors have studied the radio plasma/ICM pressure balance for FR I and FR II radio galaxies, in most cases finding the minimum synchrotron pressure lower than the ICM pressure by approximately one order of magnitude (e.g. Feretti et al. 1990, Hardcastle & Worrall 2000 and references therein). Furthermore, the long tails of radio galaxies carry the imprint of relative motion between the non-thermal plasma and the ambient hot gas. In the parlance of the field, they reflect the weather conditions in the ICM. The potential of such observations to reveal details of cluster mergers such as subsonic and transonic bulk flows, shocks, and turbulence has been investigated on theoretical grounds by a number of authors (Loken et al. 1995, Burns et al. 2002). On the observational side, Gómez at al. (1997) studied a large number of Wide Angle Tail (WAT) radio galaxies inside Abell clusters. They found a strong correlation between the orientation of the radio tails and the elongations of the ICM surface brightness profiles, and interpreted it as evidence for bulk plasma motion that follows cluster mergers. Bending of radio tails has often been explained by invoking motion of the radio galaxy in combination with “stormy ICM weather” (e.g. Feretti et al. 1985, Sakelliou, Merrifield and McHardy 1996) but this interpretation does not work for all bent radio tails (e.g. Eilek et al. 1984).
In addition to facilitating studies of radio galaxies and the ICM themselves, observations of radio galaxies in galaxy clusters make it possible to study the interaction of the radio galaxies with the ICM and vice versa. The radio plasma can interact with the ICM and form so-called cavities devoid of ICM that show up as depressions in the X-ray surface brightness maps. Cavities have been observed in the Perseus cluster Böhringer et al. (1993), in the Cygnus A cluster by Carilli et al. (1994); more recently, CHANDRA observations revealed cavities in the clusters Hydra A, A 2597, A 2052, and A 4059 (McNamara et al. 2000, 2001, Blanton et al. 2001b, Heinz et al. 2002). It is not yet clear whether these cavities are merely curiosities or, whether they influence the ICM in an important way by supplying a dynamically important amount of heat and/or magnetic field to the ICM (Brüggen et al. 2002, Quilis, Bower, & Balogh 2001, Reynolds, Heinz, & Begelman 2002, Fabian et al. 2002). The relative motion of the ICM and the Interstellar Medium (ISM) of the radio galaxy’s host galaxy can result in a modification of the ISM and in a bow shock forming “in front” of the radio galaxy (e.g. Stevens, Acreman, Ponman 1999, Toniazzo & Schindler 2001, and references therein). Although these interactions can also be observed in normal galaxies, the radio maps of radio galaxies can be used to better interpret the data by constraining the motion of the galaxies in the plane of the sky as well as the ICM magnetic field.
The Cluster 3C 129 and Outline of the Paper
In this paper we present Chandra data on the nearby galaxy cluster 3C 129 ( 0.0223). Owing to its low Galactic latitude ( = 160∘.5, = 0.3∘) it has not been studied extensively at optical wavelengths. In addition to velocity measurements of 3C 129 and 3C 129.1 (Spinrad, 1975), we are aware of only one other velocity-verified cluster galaxy: WEIN 048 (Nilsson et al. 2000). Optically, the galaxy 3C 129 has been described as a weak elliptical galaxy without peculiar features [Colina & Perez-Fournon 1990]. X-ray observations with the Einstein, EXOSAT, and ROSAT satellites [Edge & Stewart 1991, Leahy & Yin 2000] yielded a cluster luminosity of 2.7 ergs s-1 in the 0.2-10 keV energy band, a central gas density of 6 and an ICM mass of . Based on Einstein IPC data Leahy & Yin (2000) found evidence for a cooling flow with . However, reanalyzing the same data, Taylor et al. (2001) derived an upper limit of 1.2 M. Based on the Chandra imaging spectroscopy data we performed a spectroscopic deprojection analysis, taking into account the asymmetry of 3C 129’s X-ray surface brightness by using a set of elliptical ICM shells (Krawczynski 2002, called Paper I in the following). This analysis did not show a decrease of the ICM temperature toward the cluster center, as expected for a cooling flow.
The cluster contains two radio galaxies. The radio source 3C 129 is a well studied galaxy in the radio wavelength range as a prototype head-tailed (HT) galaxy with a strongly curved, 15′ long (426 kpc), two armed tail [Miley 1973, van Breugel & Jagers 1982, Kassim et al. 1993, Feretti et al. 1998]. In an earlier paper (Harris, Krawczynski & Taylor, 2002, called Paper II in the following) we presented evidence for X-ray emission from the inner northern jet of 3C 129. Near the projected center of the X-ray galaxy cluster is the weaker and smaller radio source 3C 129.1. This galaxy also has dual radio jets which extend over 2 arcmin (57 kpc) [Downes 1984, Jägers 1987, Kassim et al. 1993].
In this paper we describe X-ray and radio observations of this cluster. We complement the Chandra X-ray data with archival 0.33 GHz, 5 GHz and 8 GHz and with new 1.4 GHz Very Large Array (VLA)111The National Radio Astronomy Observatory is a facility of the National Science Foundation operated under cooperative agreement by Associated Universities, Inc. radio data. We use the radio and X-ray data to search for evidence of interactions between the radio plasma and the ICM and to study the pressure balance between the two plasmas. Since the cluster lies at low Galactic latitude we expect substantial variations of the neutral Hydrogen column density NH over the field of view of the Chandra observations. We therefore obtained HI observations with the DRAO telescope. Tables 1 and 2 summarize the data sets used in our analysis.
The remainder of the paper is structured as follows. We introduce observations and data sets in Sect. 2. Results of radio observations are presented in Sect. 3, while in Sect. 4 we discuss radial profiles of the ICM surface brightness distribution together with the geometry of the ICM. We describe the search of the X-ray data for signatures of radio galaxy/ICM interactions in Sect. 5, and examine the pressure balance between the plasma of 3C 129 and the ICM in Sect. 6. Finally, we summarize our results in Sect. 7.
We use 100 km s-1 Mpc-1 with throughout, setting the cluster at a distance of 100 Mpc; 1 arcsec corresponds to 474 pc. We quote all errors on 90% confidence level. All coordinates are given for equinox 2000. Distances from the radio core of 3C 129 are given as point to point distances, and not as distances along the radio tail.
2 Data Sets and Data Analysis
HI Observations with the Dominion Radio Astrophysical Observatory
Since the 3C 129 area lies close to the Galactic plane it is included in the 21 cm line and continuum observations planned as part of the second phase of the Canadian Galactic Plane Survey (CGPS; see Taylor 1999 for an overview of its goals). The DRAO Synthesis telescope HI observations of this part of the sky were completed early in the second phase of the survey. They were reduced following the standard HI reduction procedure for the CGPS, described by Higgs (1999). This work includes the insertion of “short spacing data” collected with the DRAO 26 m telescope and corrected for stray radiation effects. So the HI data are fully sampled out to an interferometer spacing of approximately 2900 wavelengths. The resulting images have a resolution of 1 arcmin (Full Width Half Maximum, FWHM) in right ascension and 1 arcmin cosec() in declination . We used a method similar to that described by Normandeau (1999), to determine the optical depth in the direction toward the 3C 129 cluster. Briefly, HI spectra in the direction of the heads of the radio galaxies 3C 129 and 3C 129.1, which show absorption, were compared with spectra toward nearby “off source” positions. The comparisons indicate that the optical depth along the line of sight to these two strong sources averages to less than 1. We assume that this optically thin condition holds anywhere in the direction toward the 3C 129 cluster, so we can derive the HI column density from the expression:
| (1) |
Here, NH is given in atoms cm-2, the sum runs over all velocities which contain Galactic hydrogen, is the radio brightness temperature in degree Kelvin, and is the width of the th velocity interval in km s-1.
Radio Observations with the Very Large Array
The 330 MHz VLA data were acquired during 175 snapshot observations made over several years in the late 1990’s. The data were taken in A, B, and C configurations. The final image has 8″resolution (FWHM). The Root Mean Square (RMS) noise in the map is mJy beam-1, and the Dynamic Range (DR, the signal-to-noise ratio of the peak brightness) is . A detailed description of these observations has been given by Lane et al. (2002).
Data for the 1400 MHz image were obtained at the VLA on August 16, 2001
(4 hrs, C-configuration), and December 6, 2001 (1.5 hrs, DnC-Configuration).
Short observations of 3C 48 were used for amplitude
calibration, and the data were combined and mapped with the package
AIPS (Astronomical Imaging Processing System) using standard imaging techniques.
The image has a FWHM resolution of 18″ 14″at a position angle of -15o, an RMS noise of 100 Jy beam-1,
and a DR.
The primary aim of the VLA observations at L-band was to derive
accurate 0.33 GHz - 1.4 GHz spectral indices. The 330 MHz data have a
minimum UV-spacing of 40, and a maximum of 40.65k
(k stands for kilo); for the 1400 MHz data, the minimum
spacing is 180 and the maximum is 16.5k.
To make the spectral index maps, both datasets were limited to a maximum
UV of 15k and a Gaussian taper was applied during imaging to match
the measured beam sizes as closely as possible.
A circular restoring beam of 18” x 18” was used in the final maps.
We estimated the errors on the spectral indices by adding/subtracting 5
sigma to fluxes at one frequency and subtracting/adding 5 sigma from
the other. This method gives conservative 5 sigma errors of 0.01 near the
radio core and 0.25 at the end of the radio tails.
Finally we used several VLA maps of 3C 129 and 3C 129.1 with various effective angular resolutions that G. Taylor kindly provided. The pressure determination of the 3C 129 radio plasma uses a 5 - 8 GHz spectral index map extracted from two data sets with identical angular resolutions of 1.8″(Taylor et al. 2001). The width of the 3C 129 tail was determined at distances from 0″to 20″, 0.3′to 2.5′, and 2.5′to 15′from the radio core from the 8 GHz, 0.83″ angular resolution map from Harris et al. (2002), the 8 GHz, 1.8″ angular resolution map from Taylor et al. (2001), and the 0.33 GHz, 8″ angular resolution map from Lane et al. (2002), respectively.
A high angular resolution map of 3C 129.1 (0.81″ 0.76″ FWHM) has been used for the radio contours shown in Fig. 5.
Chandra Observations
Our data consist of two pointings: a 31.4 ksec exposure taken on
December 9, 2000 with the ACIS S, 6 chip array (aimpoint close to
3C 129), and a 9.6 ksec exposure with the standard ACIS I CCD on
January 9, 2001 (aimpoint close to 3C 129.1).
The analysis uses the CIAO 2.2 software.
Filtering for major background flares reduces the ACIS S data set to
28.3 ksec and the ACIS I data set to 9.3 ksec.
We produce flat-fielded X-ray brightness maps using a soft (0.5-1 keV),
an intermediate (1-2 keV) and a hard (2-5 keV) energy band.
The brightness maps were corrected for instrumental parameters such
as the effective area etc. by dividing by the appropriate exposure maps.
The flat-fielded maps give the flux of 0.5-5 keV photons per .
We combine the flat-fielded maps of both observations by
weighting each one with the corresponding integration time.
Further details concerning these data can be found in Paper I.
Some X-ray features have only modest statistical significance. Using the number of counts in the source “ON region” , and the number of counts in the comparison “OFF region” , we compute the statistical significances based on the method of Li & Ma (1983). The method is based on Poisson probability distributions and correctly accounts for the statistical uncertainty of the counts in both the source and comparison regions. The statistical significance of an excess is given in standard deviations by:
| (2) |
where
| (3) |
and given by:
| (4) |
where and are the
solid angle areas of the source and background regions, respectively,
and is the the effective area of the detector.
We use the exposure
map produced for 1.7 keV photons as and
integrate over this map with the CIAO tool dmstat.
Although the method is based on Poisson probability distributions,
the expression for the statistical significance is only valid for
and [Alexandreas et al. 1992].
If this condition is not met, we use the equation of Alexandreas et al. (1992)
| (5) |
to compute the chance probability that counts are observed by chance, taking into account the statistical uncertainty of the “OFF” measurement. We state the significances without taking into account “trial factors” due to the search for features over an extended solid angle region.
3 Radio Maps
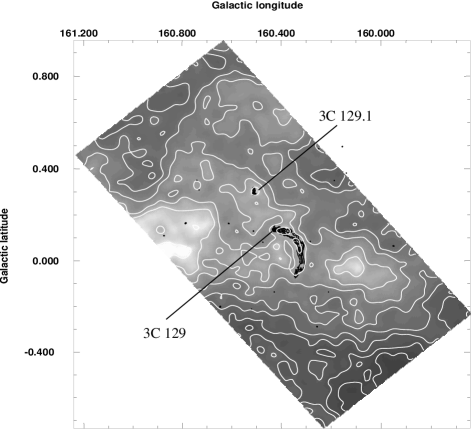
The NH-map derived from the HI observations, smoothed with a Gaussian of 2.45′ FWHM is shown in Fig. 1. Although the NH-values change by 25% over the 1.25∘2.5∘ field of view, the Chandra observations lie in a region of rather constant values of between 8.4 cm-2 and 9.2 cm-2. Strasser and Taylor (2002) studied HI absorption spectra of 273 background sources from the Canadian Galactic Plane Survey. In their Figure 2 they show that in optically thin regions the apparent off-source temperatures cover a range of about 100 K (upper bound) to 50 K (lower bound). Assuming a mean value of 75 K, these off-source data sets imply a maximum error in the HI determination of about 30%. Our results are marginally consistent with those of Leahy & Yin (2000) and Taylor et al. (2001), derived from fitting the cluster’s X-ray energy spectra: the first authors report N (5.70.3) cm-2 based on ROSAT and EXOSAT data, and the latter authors get N (6.40.4) cm-2 from ASCA data.
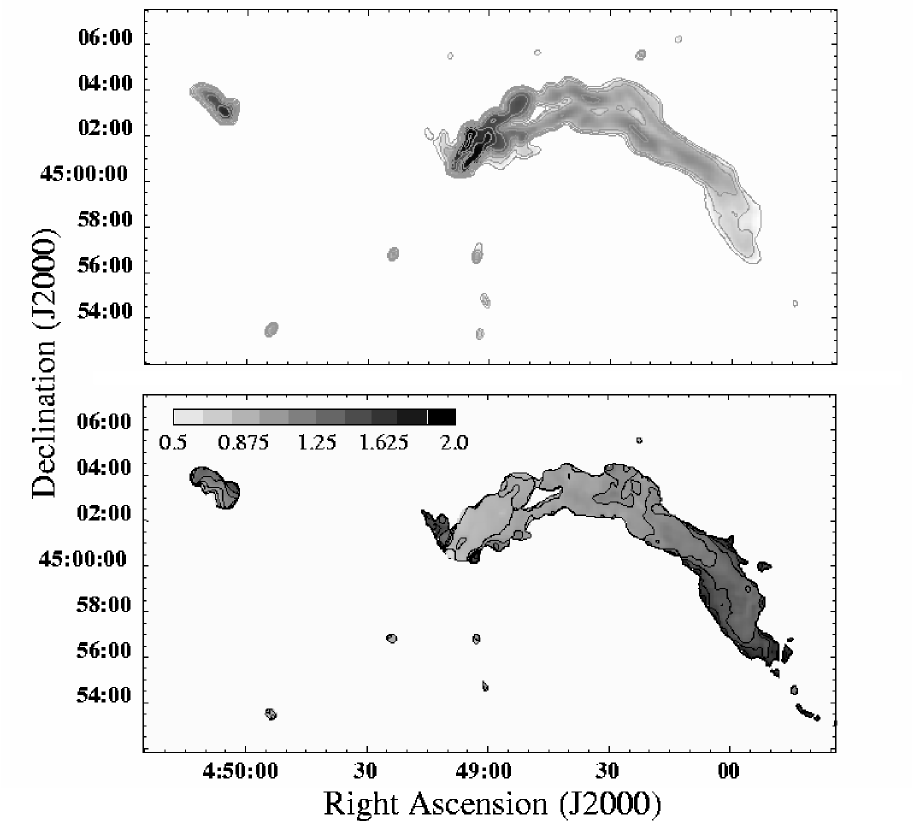
The 1.4 GHz radio surface brightness distribution of the 3C 129.1 and 3C 129 region is shown in Fig. 2, upper panel. The map shows substantially more detail than the previously published map at this frequency [Jägers 1987]. One clearly recognizes the peculiar radio feature (called “radio crosspiece” in the following) to the northeast of the radio head seen in earlier low-frequency 0.33 GHz data [Jägers & de Grijp 1983, Lane et al. 2002]. Figure 2, lower panel, shows the 0.33 GHz-1.4 GHz spectral indices ( defined by ) derived from the 0.33 GHz data of Lane et al. (2002) and our 1.4 GHz data. The spectrum is flattest at the 3C 129 radio core ( 0.5). Between 0′ and 6′ from the radio core the spectrum of both radio tails stays rather constant with spectral indices from 0.5 to 0.8; between 6′ and 11′ from the radio core it steepens to 1; and from 11′ to 15′ it varies from 1 to 1.5. The region of the radio crosspiece has spectral indices of between 1.1 and 1.5. A natural interpretation of the spectral index distribution in the tail is that the electron population has an energy spectrum ( ) with 2.0. Within a distance of 8′ from the radio core the radio spectrum steepens from 0.5 to 1.0, and thus the electron spectrum steepens from 2 to 3, as a consequence of synchrotron and Inverse Compton cooling of the radio plasma. Further cooling eventually results in 1, once the electron spectra have cooled enough so that the high energy cutoff of electrons is low enough to affect the frequency band being observed. Weakening magnetic fields further down the radio tail will also contribute to this effect.
Assuming no re-acceleration of electrons in the radio tail and using an order of magnitude magnetic field strength of 5G, we estimate the age of the electrons at 8’ from the radio core where the spectral index of the synchrotron radiation is 0.5. For this purpose, we assume an initial electron energy spectrum with 2.0, and compute the 0.33 GHz-1.4 GHz spectral index taking into account synchrotron and Inverse Compton energy losses of the electrons (see Myers & Spangler, 1985). Following Jaffe & Perola (1974) we assume that electrons are isotropized on time scales short compared with their radiative lifetimes. In this approximation, Inverse Compton cooling on the Cosmic Microwave Background can be taken into account by using an effective magnetic field with G to compute the energy losses of the electrons. The model reproduces the observed spectral index 1 for an age of 95 Myr of the electrons. This age translates into a velocity of the galaxy 3C 129 of:
| (6) |
where is the angle between the plane of motion of 3C 129 and the line of sight toward the observer. Although the equipartition magnetic field at 8′ from the radio core derived from the radio data is smaller (between 1.4 and 3.7 G for lower frequency cutoffs 330 MHz and 1 MHz, respectively) the radio plasma - ICM pressure balance argues for a stronger magnetic field, possibly up to 15 G. Since depends strongly on , a range of allowed -values tightly constrains the magnetic field (see Sect. 7).
Lane et al. (2002) interpreted the radio crosspiece as fossil non-thermal electrons re-energized by the bow-shock of the radio galaxy 3C 129, supersonically traversing the ICM. Assuming that the segment of the energy spectrum of the electrons responsible for the 0.33 to 1.4 GHz emission in the radio crosspiece has not yet steepened due to radiative cooling, the spectral index 1.3 translates into a particle spectral index of . Invoking the standard theory of diffusive particle acceleration at shocks [Drury 1983], we derive an estimate of the Mach number of 1.87. For an ICM temperature of 5 keV, the ICM sound speed is 1160 km s-1, and 1.87 corresponds to 2170 km s-1 in fair agreement with above estimate. The difference of the radial velocities of 3C 129.1 ( 0.022265) and 3C 129 ( 0.020814) is only 435 km s-1, suggesting that the galaxy’s velocity vector lies mainly in the plane of the sky.
The spectral index values and variations found across the source between data at 0.33 and 1.4 GHz are in reasonable agreement with those found between 0.612 and 1.4 GHz (van Breugels 1982; Jägers 1987), and between 1.4 and 4.1 GHz (Miley 1973). Comparing our results with the 0.074 - 0.61 GHz spectral indices of Perley & Erickson (1979), we find that the spectrum flattens at low frequencies, while comparisons with the 0.408-2.7 GHz spectral indices of Riley (1973) and the 2.7-4.8 GHz and 4.8-10.6 GHz spectral indices of Feretti et al. (1998) show that the energy spectrum steepens at higher frequencies.
4 The Geometry of the Intracluster Medium and Discrete Sources
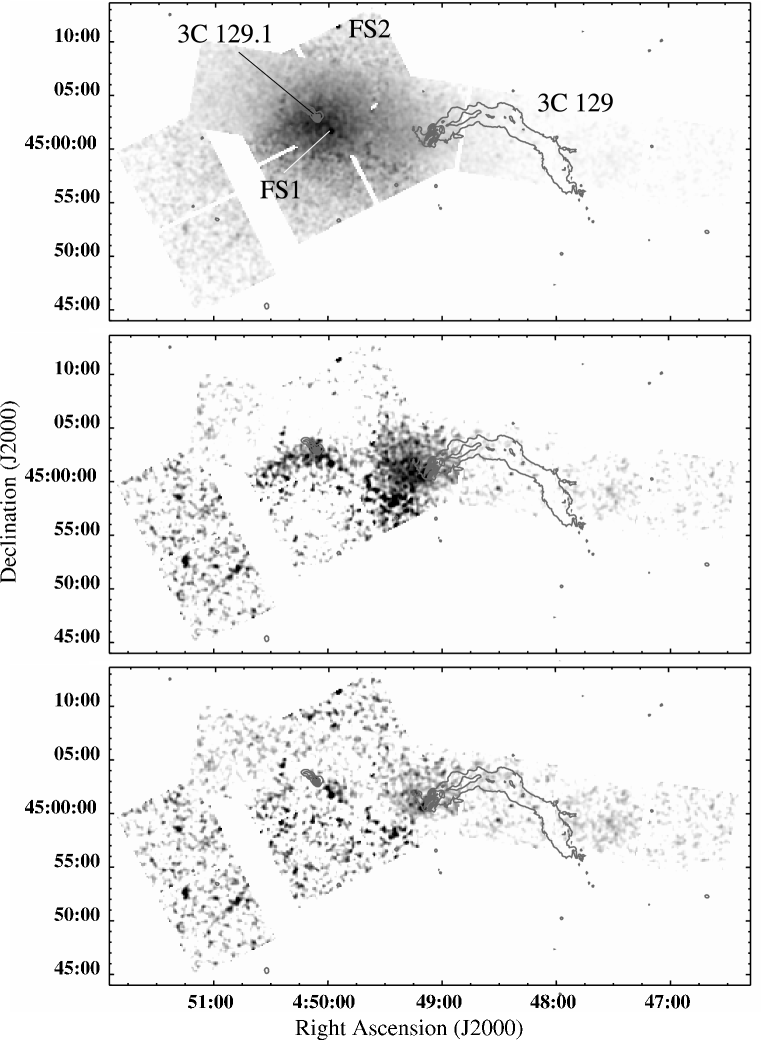
The upper panel of Fig. 3 shows the flat-fielded data of the two Chandra observations, summed with a weight proportional to the integration time and smoothed with a Gaussian of 18.8″FWHM. Neither before nor after smoothing the X-ray surface brightness do we detect obvious sharp gradients, like those found for a large number of more regular clusters (Markevitch et al. 2002) which might be produced by sloshing of the central ICM. The cluster has a considerable ellipticity. Using surface brightness iso-contours we derive ellipticities of about 0.3, being the semi-major axis, and the semi-minor axis. The surface brightness iso-contour ellipses are roughly aligned in the east-west direction which depends slightly on the diameter of the ellipses. The surface brightness peaks at and around the location of two discrete sources: an extended source near the core of the radio galaxy 3C 129.1 ( 04h50m06s.6308 and 45), and a point source, called FS1 in the following, at 2.0 arcmin toward the southwest of the center. We use the location 04h50m02s.9 and 45∘ that lies between these two sources as the cluster center. This location was determined by estimating centers of ellipses at various surface brightness levels.
Another strong point source, called FS2 in the following, is found 9.2′ from the cluster core toward its northwest. This second source had already been detected in ROSAT data by Leahy & Yin (2000). The location, X-ray flux, and information about radio counterparts of FS1 and FS2 are given in Table 3. Lacking optical spectra, we can not determine whether these two source belong to the cluster or not. The only other known radio galaxy belonging to the cluster, WEIN 048 (Nilsson et al. 2000), was not in the field of view of the two Chandra observations.
We searched for large scale irregularities of the ICM surface brightness by constructing models of the undisturbed ICM surface brightness and subtracting these model from the surface brightness map. We used two models of the undisturbed ICM. The first model is a “standard King model” that is symmetric around the cluster center:
| (7) |
with the surface brightness , the normalization constant , the distance from the cluster center , the cluster core radius , and the exponent . using the fiducial value 2/3 we fit a core radius of 7.1′with a -value of 317 for 41 degrees of freedom. Fitting also the -parameter gives 7.3′and 0.68, and does not reduce the -value substantially: 315 for 40 degrees of freedom. The surface brightness distributions after subtraction of this King model will show that the ICM distribution is quite irregular; we thus would not expect that a symmetric King model gives a good fit.
The second model allows for variations of the ICM profile with polar angle. This model assimilates some of the large scale irregularities of the ICM and allows us to search for irregularities on smaller angular scales. Dividing the cluster into 18 pie sections of 20∘ opening angle each, 18 King models are fitted to the surface brightness. As shown in Fig. 4 for two example pie sections, the fiducial value of 2/3 yields unsatisfactory results: the observed surface brightness profiles show a more pronounced turn-down at cluster core distances between 5′ and 10′ than expected for 2/3. Leaving as a free parameter, yields more satisfactory fits. For polar angle values that are odd integer multiples of 10∘, the surface brightness model is defined by the fitted King profiles. For intermediate values, we interpolate between the predicted surface brightness of the adjacent two King models. To avoid modification of the model by the radio galaxy 3C 129, we do not use the King model of the corresponding pie section (polar angle 240∘-260∘), but interpolate between the King models of the two adjacent pie sections. We use these surface brightness models only to find excess emission; the statistical significance of excess features on small angular scales is rigorously evaluated based on count statistics as described above.
The residual surface brightness distributions smoothed with a Gaussian of 18.8″FWHM are shown in Fig. 3, center and lower panels. The map derived from subtracting the symmetric King model emphasizes the east-west elongation of the ICM: two regions with excess emission can be recognized: one is located at and toward the east of the cluster center, extending over at least 7′. The second one is located west/south-west of the cluster center. Note that the relative strength of these two excess regions depends strongly on the choice of the location at which we center the symmetric King profile. Moving this location by 1.3′toward the west of the cluster, reduces the western excess substantially, especially the bright region around the head of the radio galaxy 3C 129. Based on this surface brightness distribution, it is tempting to speculate that the excess region near the cluster center shows remnants of a sub-cluster passage through the cluster center. The curvature of the 3C 129 radio tail may be caused by a sub-cluster that attracts the radio galaxy and whose dark matter center of gravity even lies in the south-west of the south-western excess region. Upcoming observations of 3C 129 with the XMM-Newton satellite will shed more light on the nature of these excess regions. The map obtained by subtracting the 18-slice pie-model from the surface brightness distribution does not show evidence for very sharp surface brightness gradients from large scale structure shocks or adjacent ICM phases of widely different X-ray emissivities.
5 X-Ray Surface Brightness Near the Two Radio Galaxies
X-Ray Emission from 3C 129.1
While the aimpoint of the ACIS I observation is located near 3C 129.1, that of the ACIS S observation lies near the head of 3C 129 at about 12′ from 3C 129.1. Thus, although the latter observation has a three times longer integration time, its angular resolution is substantially lower: 0.84″compared to 9″(FWHM) at the aimpoint of the observation and at 12′ off-axis, respectively. We therefore use only the ACIS I observation for the study of localized excess emission in the surrounding of 3C 129.1.
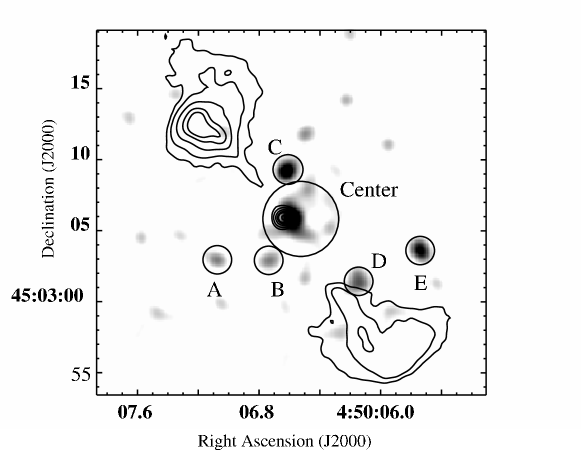
The X-ray emission near 3C 129.1 is shown in Fig. 5 together with a contour plot of the high resolution radio data. The high resolution radio map reveals a well defined northern jet, suggesting that the northern side approaches the observer. An excess of X-ray emission over that from the ICM can be recognized up to 10″ from the radio core. The excess emission corresponds to a luminosity of 1.5 erg s-1. There is clear evidence that at least some of this emission comes from localized sources rather than from diffuse gas. At about 4″ to the north of the radio core (source “C”) we detect a total 7 counts (6 counts) from a sky region of 1.1″(0.4″) radius , where 0.25 counts (0.04 counts) had been expected based on an annular comparison region of 11″inner radius and 20″outer radius. In Table 4 we list the locations, statistical chance probabilities, and fluxes for the extended “center-source” as well as for 5 potential point sources. Using the Galactic neutral Hydrogen column density, we estimate a flux of 6.9 erg s-1 for the center-source and fluxes between 8.7 and 2.1 erg s-1 for the point source candidates. The 0.5-5 keV energy spectrum of the combined excess X-ray photons can be described by a power law of spectral index 1.7 (with ). Using only the events from the point source candidates, the best-fit spectral index is 1.3. Comparing the mean source spectrum luminosity with that of resolved sources in other X-ray faint galaxies [Sarazin, Irwin & Bregman 2000, Blanton et al. 2001a, Irwin, Sarazin & Bregman 2002], the luminosity of the 3C 129.1 sources seems to be relatively high, while their energy spectrum is relatively soft. This is especially true for source C which has the highest statistical significance, the highest flux and a very soft energy spectrum (see Table 4).
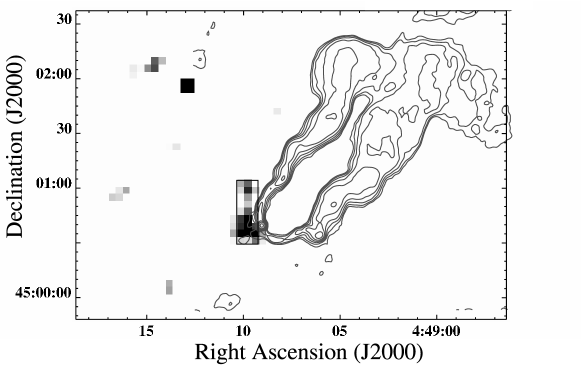
X-Ray Surface Brightness Modification Near 3C 129
The evidence for X-ray emission from the 3C 129 radio core and jet has been described in Paper II. The excess emission was well localized and came from a sky region a couple of arc-seconds in diameter, located near the 3C 129 radio core. In Figs. 3 and 6, we excluded this core and jet emission from the analysis, by setting the residual surface brightness of these sky regions to zero. The residual X-ray map of Fig. 3 (lower panel) and the enlarged view of the sky region near the radio head of 3C 129 in Fig. 6 reveal some evidence for an excess from a 12″36″(6 kpc 17 kpc) large region at about 30″ (14 kpc) toward the east of the radio core. Using an annulus of 45″inner radius and 90″outer radius centered on the radio core as comparison region, we estimate the statistical significance of the excess to be 3.7 (ON: 131 counts, OFF: 92 counts).
The residual surface brightness map of Fig. 3 (lower panel) does not show any evidence for excess or deficit emission along the tail of the radio galaxy 3C 129. Indeed, in absence of strongly emitting sheets of compressed plasma, we do not expect to detect any excess or deficit, given the small volume of the tail. Using a rectangular test region with a solid angle coverage of 1.5′ 6′ we can determine the ICM surface brightness to a 1 accuracy of between 4% and 15% near the radio head and near the extreme end of the radio tail, respectively. Assuming that (i) the tail is fully depleted of ICM, (ii) it lies in the plane of the sky, (iii) its depth along the line of sight equals its width perpendicular to the major tail extension, and (iv) that the ICM can be described by a King model with = 7.1′and 2/3 up to a cluster core distance of 40’, we expect a reduction of the ICM surface brightness of only between 3% and 4% for locations near the radio head and near the extreme end of the radio tail, respectively. Although depends strongly on the location chosen as cluster center, the inferred reductions in the ICM surface brightness do not.
6 Pressure Balance Along the Radio Tail of 3C 129
In this section we compare the thermal pressure of the ISM and ICM with the minimum non-thermal pressure of the 3C 129 radio tail. The energy density of the synchrotron plasma (including magnetic field energy) is minimized by the magnetic field (see Pacholczyk 1970):
| (8) |
The -factor is the contribution to the non-thermal pressure from relativistic protons over and above that from the relativistic electrons, is the volume filling factor for the radio emitting plasma, and is the emitting volume, well constrained by the observations. The sum runs over the considered frequency intervals of the observed radio spectrum, the value of depends weakly on the synchrotron spectral index and the lower and higher cutoffs of the frequency interval, and is the corresponding synchrotron luminosity. We compute true minimum energy estimates by assuming a magnetic field of , a volume filling factor of 1, no pressure contribution from electrons outside the energy range probed by the radio data, and no pressure contribution from relativistic protons ( 0). The finite angular resolution of the radio observations might overestimate the emission volume near the cores of the two radio galaxies and thus further lower the pressure estimate. The non-thermal particle energy density is given by:
| (9) |
and the equation for the minimum isotropic pressure of the synchrotron plasma (including magnetic field pressure) reads:
| (10) |
In the latter equation we conservatively assumed a tangled magnetic field.
Based on these standard assumptions, can be computed from the radio data alone. As a starting point we use either the 0.33 GHz, the 5 GHz, or the 8 GHz surface brightness radio map. For each point along the radio tail we compute using thin cylindrical segments, in other words: disks, seen edge on. The disk-axes are aligned with the radio tail. The width (and depth) of a disk is given by the two points at which the radio intensity drops to 10% of its peak value. For each disk we compute the mean radio flux at the frequency of the considered map, by averaging the surface brightness over the cross-section area of the disk. Given , we construct the 0.33-8 GHz radio energy spectrum, assuming the measured 0.33-1.4 GHz and 5-8 GHz spectral indices over the frequency ranges from 0.33-2.65 GHz and 2.65-8 GHz, respectively. We use the ICM pressure from the spectroscopic ICM deprojection analysis of the Chandra data [Paper I] and neglect the pressure contribution of the ICM magnetic field. Taylor et al. (2001) estimate that the ICM magnetic field might be as strong as 10 G. If this is true, the thermal and magnetic ICM pressures would be comparable at and near the head of the radio galaxy 3C 129.
The pressure profiles are shown in Fig. 7. Over the first 13″(6.1 kpc) from the nucleus of 3C 129 the minimum pressure of the radio plasma exceeds the pressure of the ICM by a factor of up to 5, suggesting either self-confinement, or, confinement by the cold disk-like remnant of the ISM that has been stripped off the galaxy by the relative motion of galaxy and cluster gas [Toniazzo & Schindler 2001]. At 2′ (57 kpc) from the radio core, the minimum pressure fell by more than one order of magnitude and shows strong wiggles, suggesting “stormy local ICM weather″. Unfortunately, low X-ray photon statistics do not allow us to determine the ICM properties with sufficient statistical accuracy to assess the imprint of this stormy weather in the X-ray surface brightness or X-ray energy spectra. Further away than 2′from the radio core, the minimum pressure levels off at roughly 1/40th of the ICM pressure.
The equipartition magnetic fields lie between 16 G and 1 G near the beginning and the end of the tail, respectively. The lower frequency cutoff of 330 MHz corresponds to Lorentz factors of 4000 . We estimate the possible pressure contribution of electrons with very low Lorentz factors by extrapolating the radio energy spectrum down to 1 MHz, corresponding to Lorentz factors of 220 . Using the lower frequency cutoff, the inferred equipartition magnetic field strength increases to between 22 G and 3 G near the beginning and the end of the tail, respectively. The corresponding pressure estimates are shown by the dashed dotted lines in Fig. 7.
For the first 10′ of the tail, the radio spectrum is sufficiently flat so that the lower cutoff frequency does not qualitatively alter the result: the minimum non-thermal pressure lies substantially below the ICM pressure. We will discuss the implications in the next section.
7 Summary and Discussion
The Chandra observations show that the radio galaxy 3C 129.1 is associated with an extended X-ray excess. The excess can be divided into 5 point sources and a central component. On the small angular scale of the central component (4″diameter) the ISM is not expected to contribute to the excess. We therefore consider it most probable that the central excess emission is produced by galactic sources and possibly also by the central AGN.
For the radio galaxy 3C 129 we find, in addition to the core and jet emission described in Paper II, some evidence for extended X-ray emission from a 12″36″(6 kpc 17 kpc) large region to the east of the radio core. If confirmed with higher statistical significance, a natural explanation of the excess would be thermal emission from plasma compressed and heated by the bow shock that precedes the galaxy.
Comparing the minimum pressure of 3C 129 radio tail with the thermal ICM pressure, the radio plasma appears to be under-pressured by a factor of between 10 and 40. Over the first 10′of the radio tail, the radio spectrum is sufficiently flat so that the results depend only weakly on the assumed minimum Lorentz factor of the non-thermal electron distribution.
Remarkably, a very similar pressure mismatch has been found for the kilo-parsec
radio features of a number of FR I and FR II radio galaxies
(see Hardcastle & Worral 2000 and references therein).
For most radio galaxies the magnetic field inside the radio plasma is
poorly constrained toward higher values and might dominate the plasma pressure.
In the case of 3C 129, we have an additional handle on the magnetic field strength from
the constraints on the radiative age of the radio-electrons:
If the missing pressure of the radio plasma is provided by the magnetic
field alone, the implied field strengths of between 15G and 30G
translate into very high lower limits on the galaxy velocity of between
11,000 km s-1 and 31,000 km s-1 (see Eq. 6).
Buoyant motion of the radio plasma would proceed with a velocity
lower or equal to the
ICM sound speed, and would thus not qualitatively alter our conclusions.
The apparent pressure mismatch thus suggests one of the following possibilities:
(i) thermal or relativistic protons and/or thermal or relativistic
low-energy electrons carry the major fraction of the radio plasma’s pressure;
(ii) the volume filling factor of the radio plasma is substantially
smaller than unity: 0.0016 - 0.018;
(iii) the -field is much larger than the
equipartition magnetic field and electrons are re-accelerated
inside the radio tail;
(iv) the radio galaxy lies behind or in front of the plane of the cluster
so that the true ambient ICM pressure is lower than assumed in our analysis.
The detection of an “ICM cavity” associated with the radio tail would make
it possible to estimate the volume filling factor. We hope to detect such a
cavity with an upcoming XMM-Newton observation of 3C 129.
Acknowledgements
We thank Lewis Knee and Charles Kerton for advice and assistance with
reduction of the DRAO HI data. The Canadian Galactic Plane
Survey is a Canadian project with international partners, and is
supported by the Natural Sciences and Engineering Research Council
of Canada. The Dominion Radio Astrophysical Observatory is a
national facility operated by the National Research Council of
Canada. We thank G. Taylor for providing FITS images of his radio maps and
for higher resolution versions of the 8 GHz data than those used in
his paper. We are grateful to the anonymous referee for very valuable comments.
The analyzes in this paper were partially supported by
NASA grants GO1-2135B (HK), GO1-2135A (DEH), and by NASA contract
NAS8-39073 (DEH). WL is a National Research Council Postdoctoral
Fellow. Basic research in astronomy at the Naval Research Laboratory
is funded by the Office of Naval Research.
References
- [Alexandreas et al. 1992] Alexandreas, D.E., Berley, D., Biller, S., et al., 1992, NIMA, 328, 570
- [Böhringer et al. 1993] Böhringer, H., Voges, W., Fabian, A. C., Edge, A. C., & Neumann, D. M. 1993, MNRAS, 264, L25
- [Blanton et al. 2001a] Blanton, E. L., Sarazin, C. L., Irwin, J. A., 2001b, MNRAS, 552, 106
- [Blanton et al. 2001b] Blanton, E. L., Sarazin, C. L., McNamara, B. R., Wise, M. W. 2001a, MNRAS, 558, L15
- [Brüggen & Kaiser 2002] Brüggen, M., Kaiser, C. R., 2002, Nature, 418, 301
- [Burns et al. 2002] Burns, J. O., Loken, C., Roettiger, K., et al., 2002, NewAR, 46, 135
- [Carilli et al. 1994] Carilli, C. L., Perley, R. A., & Harris, D. E. 1994, MNRAS, 270, 173
- [Colina & Perez-Fournon 1990] Colina, L., & Perez-Fournon, I., 1990, ApJS, 72, 41
- [Downes 1984] Downes, A. 1984, MNRAS, 211, 215
- [Drury 1983] Drury, L. O’C., 1983, Rep. Prog. Phys., 46, 973
- [Edge & Stewart 1991] Edge, A. C., Stewart, G. C. 1991, MNRAS, 252, 414
- [Eilek et al. 1984] Eilek, J. A., Burns, J. O., O’Dea, C. P., Owen, F. N., 1984, 278, 37
- [Fabian et al. 2002] Fabian, A. C., Celotti, A., Blundell, K. M., Kassim, N. E., Perley, R. A., 2002, MNRAS, 331, 369
- [Feretti et al. 1985] Feretti, L., Giovannini, G., Gregorini, L., et al. 1985, A&A, 147, 321
- [Feretti et al. 1998] Feretti, L., Giovannini, G., Klein, U., et al. 1998, A&A, 331, 475
- [Feretti et al. 1990] Feretti, L., Spazzoli, O., Gioia, I.M., Giovannini, G., Gregorini, L., 1990, A&A, 233, 325
- [Gómez et al. 1997] Gómez, P. L., Pinkney, J., Burns, J. O., et al., 1997, ApJ, 474, 580
- [Hardcastle & Worral 2000] Hardcastle, M. J., Worral, D. M., 2000, MNRAS 319, 562
- [Harris, Krawczynski & Taylor] Harris, D.E., Krawczynski, H., Taylor, G., 2002, ApJ, 578, 60 (Paper II)
- [Heinz et al. 2002] Heinz, S., Choi, Y. Y., Reynolds, C. S., Begelman, M. C., 2002, ApJ, 569, L79
- [Higgs 1999] Higgs, L. A., In: “New Perspectives on the Interstellar Medium”, eds. A. R. Taylor, T. L. Landecker and G. Joncas, 1999, ASP Conf. Ser. 168, 15
- [Irwin, Sarazin & Bregman 2002] Irwin, J. A., Sarazin, C. L., Bregman, J. L., 2002, ApJ, 570, 152
- [Jaffe & Perola 1974] Jaffe, W. J., Perola, G. C., 1974, Astr. Ap., 26, 423
- [Jägers 1987] Jägers, W. J. 1987, A&AS, 71, 603
- [Jägers & de Grijp 1983] Jägers, W. J. de Grijp, M. H. K., 1983, A&A, 127, 235
- [Kassim et al. 1993] Kassim, N. E., Perley, R. A., Erickson, W. C., Dwarakanath, K. S. 1993, ApJ 106, 2218
- [Paper I] Krawczynski, H., 2002, ApJ, 569, L27 (Paper I)
- [Lane et al. 2002] Lane, W. M., Kassim, N. E., Enßlin, T. A., Harris, D. E., and Perley, R. A., 2002, AJ, 123, 2985
- [Leahy & Roger 1991] Leahy, D. A., Roger, R. S., 1991, AJ, 101, 1033
- [Leahy & Yin 2000] Leahy, D. A., & Yin, D. 2000, MNRAS, 313, 617
- [Li & Ma 1983] Li, Tie-Pei, Ma, Yu-Qian, 1983, ApJ, 272, 317
- [Loken et al. 1995] Loken, C., Roettiger, K., Burns, J. O., Norman, M., 1995, ApJ, 445, 80
- [Markevitch et al. 2002] Markevitch, M., Vikhlinin, A., Forman, W.R., 2002, To appear in: ”Matter and Energy in Clusters of Galaxies”, Taiwan, 2002 April 23-27, ASP Conference Series, astro-ph/0208208
- [McNamara et al. 2000] McNamara, B. R., et al. 2000, ApJ, 534, L135
- [McNamara et al. 2001] McNamara, B. R., Wise, M. W., Nulsen, P. E. J., et al. 2000, ApJ, 562, L149
- [Myers & Spangler 1985] Myers, S. T., Spangler S. R., 1985, ApJ, 291, 52
- [Miley 1973] Miley, G. K. 1973, A&A, 26, 413
- [Nilsson et al. 2000] Nilsson, K., Valtonen, M. J., Zheng, J.Q., et al., 2000, In; ASP Conf. Ser. 209, “Small Galaxy Groups, IAU 174”, eds. M. J. Valtonen, C. Flynn, p. 408
- [Normandeau 1999] Normandeau, M., AJ, 1999, 117, 2440
- [Pacholczyk 1970] Pacholczyk, A. G. 1970, Radio Astrophysics, Freeman, San Francisco
- [Perley & Erickson 1979] Perley, R. A. & Erickson, W. C. 1979, ApJS, 41, 131
- [Quilis et al. 2001] Quilis, V., Bower, R. G., Balogh, M. L., 2001, MNRAS, 328, 1091
- [Reynolds et al. 2002] Reynolds, C. S.; Heinz, S., Begelman, M. C., 2002, MNRAS, 332, 271
- [Riley 1973] Riley, J. M. 1973, MNRAS, 161, 167
- [Sarazin, Irwin & Bregman 2000] Sarazin, C. L., Irwin, J. A., Bregman, J. L., 2000, ApJ, 544, L101
- [Sakelliou 1996] Sakelliou, I., Merrifield, M. R., McHardy, I. M., 1996, MNRAS, 283, 673
- [Spinrad 1975] Spinrad, 1975, ApJ 199, L1
- [Stevens, Acreman & Ponman 1999] Stevens, I. R., Acreman, D. M., Ponman, T. J., 1999, MNRAS, 310, 663
- [Taylor 1999] Taylor, A. R., 1999, In: ”New Perspectives on the Interstellar Medium”, eds. T. L. Landecker and G. Joncas, ASP Conf. Ser. 168, 3
- [Taylor et al. 2001] Taylor, G. B., Govoni, F., Allen, S. W., Fabian, A. C., 2001, MNRAS, 326, 2
- [Toniazzo & Schindler 2001] Toniazzo, T., Schindler, S., 2001, MNRAS, 325, 509
- [van Breugel & Jagers 1982] van Breugel, W., & Jägers, W. 1982, A&AS, 49, 529
| Description | Energy | Integration Time | Ang. Res. (FWHM) | Reference |
|---|---|---|---|---|
| Chandra ACIS I | 0.5-8 keV | 9.3 ksec | 0.84″(aimpoint) | Krawczynski 2002 |
| Chandra ACIS S | 0.5-8 keV | 28.3 ksec | 0.84″(aimpoint) | Krawczynski 2002 |
| Frequency | Instrument | New Data | Ang. Res. (FWHM) | Noise RMS | DR | Reference |
|---|---|---|---|---|---|---|
| HI | DRAO | Y | 1′ | — | — | this work |
| 330 MHz | VLA | N | 8″ | 0.75 | 400 | Lane et al. 2002 |
| 1.4 GHz | VLA | Y | 16″ | 0.1 | 3000 | this work |
| 4.7 GHz (3C 129) | VLA | N | 1.8″ | 0.072 | 545 | Taylor et al. 2002 |
| 8 GHz (3C 129) | VLA | N | 1.8″ | 0.04 | 925 | Taylor et al. 2002 |
| 8 GHz (3C 129) | VLA | N | 0.83″ | 0.03 | 1287 | Harris et al. 2002 |
| 8 GHz (3C 129.1) | VLA | N | 0.8″ | 0.012 | 225 | Taylor et al. 2002 |
| Name | RA (Eq. 2000) | Decl (Eq. 2000) | 0.5-5 keV Fluxa | Radio Counterpart |
|---|---|---|---|---|
| FS1 | 04:49:58.5 | 45:01:44.8 | 5.1310-14 | 0.24 mJy @4.8 GHz, 0.11 mJy @8 GHz |
| FS2 | 04:49:54.8 | 45:11:31.4 | 8.8510-14 | no |
a Observed flux.
| Name | RA (Eq. 2000) | Decl (Eq. 2000) | Chance | b | Fluxc | Luminosity d | ||
|---|---|---|---|---|---|---|---|---|
| Probab. | ||||||||
| A | 04:50:07.075 | 45:03:02.91 | 3 | 0.40 | 8.0 | 2.170.29 | 2.0 10-15 | 8.1 |
| B | 04:50:06.729 | 45:03:02.92 | 4 | 0.40 | 7.9 | 3.580.68 | 2.7 10-15 | 1.1 |
| C | 04:50:06.618 | 45:03:09.18 | 7 | 0.40 | 2.3 | 2.270.17 | 5.0 10-15 | 2.1 |
| Center | 04:50:06.584 | 45:03:05.92 | 25 | 2.80 | 6.7 | 2.480.15 | 1.7 10-14 | 7.0 |
| D | 04:50:06.149 | 45:03:01.35 | 5 | 0.40 | 6.2 | 3.690.58 | 3.5 10-15 | 1.5 |
| E | 04:50:05.740 | 45:03:03.61 | 6 | 0.40 | 4.1 | 4.160.46 | 4.2 10-15 | 1.8 |
a Expected number of “background” counts in the ON region.
b Mean energy of excess 0.5-5 keV Chandra photons.
c Observed flux.
d “Unabsorbed luminosity”, assumes N 8.8 cm-2.