CO depletion and deuterium fractionation in pre-stellar cores
Abstract
We report the detection of D2CO in a sample of starless dense cores, in which we previously measured the degree of CO depletion. The deuterium fractionation is found extremely high, %, similar to that reported in low-mass protostars. This provides convincing evidence that D2CO is formed in the cold pre-stellar cores, and later desorbed when the gas warms up in protostars. We find that the cores with the highest CO depletions have also the largest [D2CO]/[H2CO] ratios, supporting the theoretical prediction that deuteration increases with increasing CO depletion.
1 Introduction
Multiply deuterated molecules have drawn much attention in the past few years, with the detections of D2CO (Turner, 1990), ND2H (Roueff et al., 2000) and even ND3 (Lis et al., 2002a; van der Tak et al., 2002). D2CO was found to be particularly abundant (with [D2CO]/[H2CO] %) in low-mass protostellar environments (Ceccarelli et al., 1998; Loinard et al., 2002). The mechanisms leading to such high degrees of deuteration remain however debated. According to Tielens (1983) and Charnley et al. (1997), high deuterium fractionation can be obtained via active grain chemistry: the deuteration of the molecules, stuck onto the grains, is regulated by the atomic D/H ratio of the gas accreting into the mantles. The other major way to forming deuterated molecules is through pure gas-phase reactions in presence of strong CO (and other molecules) depletion (Roberts and Millar, 2000a, hereafter RMa). In this case, the deuterium is propagated to other molecules mostly by reactions with H2D+, and the [H2D+]/[H] ratio, which is also proportional to the atomic D/H ratio, plays a crucial role in determining the molecular deuterium ratio. In both approaches, a low temperature ( K) is necessary to obtain enhanced D/H or [H2D+]/[H] ratios and therefore enhanced levels of molecular deuteration.
The gas-grain interaction mechanism was favoured to interpret the observations towards IRAS16293-2422 (Ceccarelli et al., 2001, and references therein). In this scheme, D atoms react with the CO molecules on the grain surface during the colder, pre-collapse stage, and the obtained molecules are later released into the gas phase through heating from the newly-formed protostars. Pure gas phase models (Roberts and Millar, 2000b, hereafter RMb) could however well account for the observed [ND2H]/[NH3] ratios found by Roueff et al. (2000). Recently, D2CO was detected in L1689N, the cloud which IRAS16293 is embedded in, with an abundance ratio similar to that found at the border of the envelope of the protostar (Ceccarelli et al., 2002). This detection posed new problems, since none of the aforementioned models can account for the abundance of D2CO in that cloud. In order to have a high atomic D/H ratio, both models require strong CO and O depletion, which is not consistent with the high atomic O abundance observed (Caux et al., 1999; Vastel et al., 2000; Lis et al., 2001). Moreover, a former colder, denser (and possibly more depleted) phase cannot be invoked for L1689N.
Pre-stellar cores, as (starless) progenitors of low-mass protostars, offer the opportunity to study the cold, dense evolutionary stage in which the deuteration of molecules supposedly occurred. In addition, these objects are known to show strong degrees of CO (among other molecules) depletion, which is a necessary requisite for the models: the amount of deuteration should be linked to the degree of CO depletion. We recently studied the degree of CO depletion in a sample of pre-stellar cores, and showed that the depletion degree increases with density (Bacmann et al., 2002). In this Letter, we report the successful search for D2CO in those pre-stellar cores and test quantitatively the hypothesis that stronger CO depletions lead to larger [D2CO]/[H2CO] ratios. We first briefly describe our multi-transition H2CO and D2CO observations in Section 2 and present our results on the H2CO abundance and D2CO over H2CO abundance ratio in Section 3. We then discuss our results and their implications on deuteration mechanisms and finally conclude in Section 4.
2 Observations
We observed in August 2001 a sample of cores for which we had already discussed the CO depletion (Bacmann et al., 2002) in various transitions of H2CO and D2CO (cf. JPL Catalog) at the IRAM 30 m telescope on Pico Veleta in Spain. The spectra were taken in the position switching mode at the core central position (maximum of the continuum emission). Additional observations (small maps around the peak) to check the extent of the emission of H2CO(212-111) and H2CO(313-212) were carried out in November 2001. The rms reached were between 20 and 80 mK on the H2CO transitions and between 15 and 50 mK on the lower energy D2CO transitions D2CO(212-111) and D2CO(313-212). In order to estimate the opacities of the H2CO transitions, we observed in August 2002 the (212-111) transition of HCO in all cores but L1544. In all these observing runs, we used as backend an autocorrelator with spectral resolution of 40 kHz at GHz, and 80 kHz at GHz, yielding resolutions of km s-1 depending on line frequency. The beam and forward efficiencies at the different line frequencies can be found on the IRAM Web page at http://www.iram.es. Pointing was checked every 1.5 hours and found to be better than 3″. In the following, line fluxes are given in units of main beam brightness temperature. In addition to the rms noise, a calibration uncertainty of 15% at 150 GHz and of 20% at 230 GHz was taken into account.
3 Results
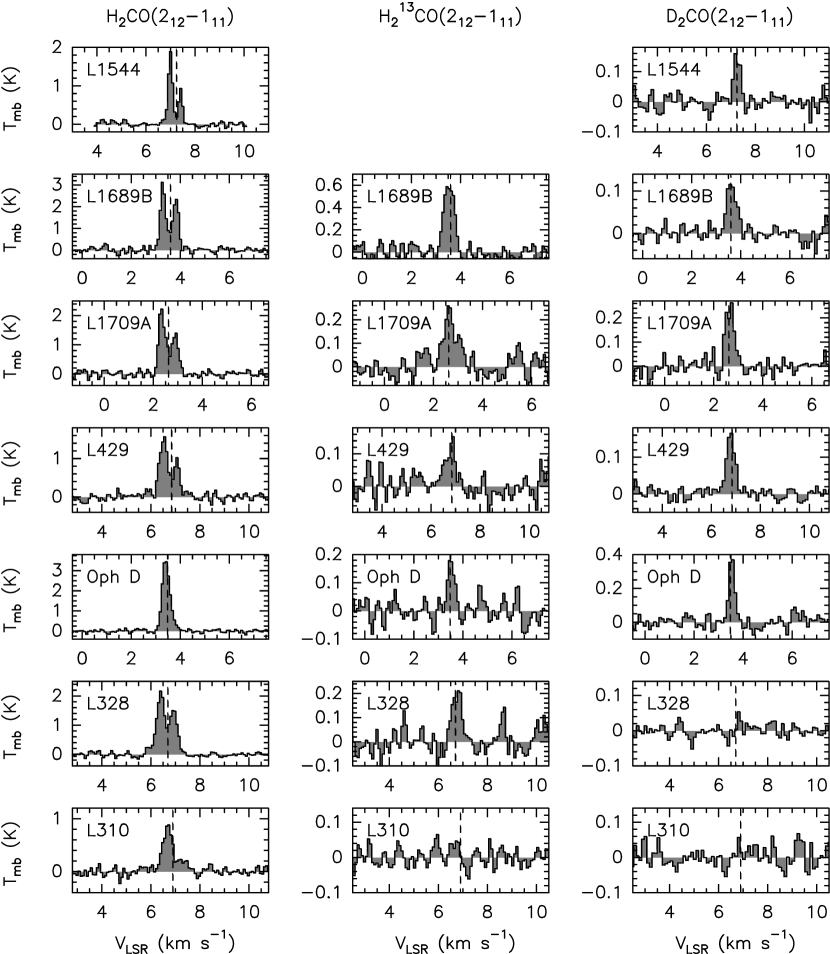
In 5 out of the 7 cores in our sample, D2CO was clearly detected in at least one transition (Table 1) 111The non-detection of D2CO() in L328 is questionable, since a 3 line was seen at the right velocity after 20 minutes of integration on both 3 mm receivers. Further integration did not confirm this detection. . The transition D2CO is a detection in those 5 cores (Fig 1). The line fluxes given in this Table were determined by integrating the line signal between two given velocities (typically, where the signal is larger than the noise). For non-detections, the upper limit was taken as 3 times the rms on the velocity-integrated intensity, given a linewidth close to that of detected lines of the same molecule.
To derive the D2CO and H2CO column densities and abundances, we used rotational diagrams (see Goldsmith and Langer 1999 for a full description of the method). Rotational diagrams give a correct estimate of the column density only when the lines are thermally populated and optically thin. If, however, the lines are sub-thermally excited, the rotational column density can be substantially different from the real one. For this reason, in this article we focus only on the relative [D2CO]/[H2CO] ratio, as it is not affected by such uncertainty thanks to the similarity of the two molecules. Line opacity can also affect the rotation temperature, but has little effect on the column density ratio. This method implies identical excitation conditions in both lines. We estimated separately the ortho-H2CO and para-H2CO column densities, and assumed an ortho-to-para ratio of 2 for D2CO. A single rotational temperature was derived simultaneously for both the ortho- and the para- H2CO and then used to determine the D2CO column density. In the cases where more than one D2CO transition was detected, the rotational temperature was derived simultaneously for ortho-H2CO, para-H2CO and D2CO as well. For L1544, the rotational temperature was assumed to be 7.252.5 K, which is an average of the values found for the other cores, and consistent with the gas temperature determined by Bacmann et al. (2002). From the small maps we made around the central position, the H2CO(313-212) emission was found to be extended in the cores. To correct for the difference in beam filling factors at 145 and 220 GHz, the H2CO(313-212) was degraded to the spatial resolution of the H2CO(212-111) line. The intensity ratio between the original and the degraded spectra (close to one) was applied to estimate the degraded H2CO(303-202) spectra. Note that both transitions are very close in frequencies and upper level energy. Finally, we corrected for the line opacity effects estimated by our observations of the HCO (212-111) transition, which suggest opacities of 2–12 (most of them around 3–5). The final H2CO column densities of Table 2 have been obtained by taking a isotopomer abundance ratio of 60 (e.g. Boogert et al. 2000).
Incidently, the observed H2CO line profiles are consistent (except for Oph D) with infalling gas, the lines being self-absorbed and the blue-shifted peak brighter than the red-shifted one (Leung and Brown, 1977). A more detailed analysis of the observed kinematics as well as the absolute abundances and ortho-to-para ratios will be presented in a forthcoming paper. The minimum and maximum values of the column densities and the [D2CO]/[H2CO] abundance ratios were determined by using a Monte-Carlo method to explore the whole range of possible values for the rotational temperature and integrated line flux within the error bars. The column densities in H2CO, D2CO, H2, the D2CO abundances and the [D2CO]/[H2CO] abundance ratios are given in Table 2.
D2CO is found extremely abundant in all cores where it was detected. The [D2CO]/[H2CO] abundance ratios given in Table 2 (between 1% and 10%) are comparable to the values quoted by Loinard et al. (2002) for low-luminosity protostars. The H2CO ortho/para ratio was found around 2.5-3 (except for L310 where it was ), which is consistent with a gas-phase formation of H2CO (e.g. Dickens et al. 1999).
4 Discussion & Conclusions: Relation with CO depletion
The high abundance of D2CO in pre-stellar cores provides convincing evidence that the D2CO seen in low-luminosity protostars originates in the cold, pre-stellar stage, as was suggested by Ceccarelli et al. (1998) and their subsequent works (see introduction). In the gas-phase schemes, high deuterium fractionations of a few percent (up to ) like those measured around young low-luminosity protostars (Loinard et al., 2002) can only be achieved when the gas phase is highly depleted of molecules and atoms reacting with H (RMa, RMb). It is also the case in gas-grain chemistry models, for which high deuterium fractionations are obtained when the atomic D/H is high, which is in turn favoured when the gas phase is depleted of CO. In order to test this hypothesis, we plotted in Fig. 2 the [D2CO]/[H2CO] ratio against the CO depletion degree estimated in Bacmann et al. (2002) - and their Table 2. As can be seen on the plot, the scatter and error bars are large (especially for L1544 for which the data are not as complete), although cores with high depletion factors tend to have high deuteration fractions in formaldehyde. In this figure, the error bars on the CO depletion can be mostly attributed to the uncertainty on the dust extinction coefficient at 1.3 mm (a factor of ). Despite the large scatter, the trend that we observe is consistent with an increase of deuteration with the CO depletion. To give a quantitative estimate, the Pearson correlation coefficient is 0.7, indicating a large probability that the two quantities, [D2CO]/[H2CO] and CO depletion, are indeed correlated. The models also state that the gas phase should be depleted of O, which is an important H destroyer as well, only a small factor 2.5 less efficient than CO, according to the UMIST database (http:www.rate99.co.uk/). We have for the time being no direct information on the amount of atomic oxygen still in the gas phase in these cores, but some indirect indications that O is not much depleted indeed. On the one hand, large quantities of gaseous atomic oxygen have been observed in several cold, CO depleted, molecular clouds (Caux et al., 1999; Vastel et al., 2000; Lis et al., 2002b). On the other hand, a detailed modeling of the L1544 core (also in our sample) molecular composition also suggests a large atomic oxygen abundance in the gas phase (Caselli, 2002). The apparent correlation between [D2CO]/[H2CO] and CO depletion and the very high fractionation observed may suggest either a similar degree of oxygen depletion with respect to CO (which would disagree with the aforementioned arguments) or a lower role of O in the fractionation (yet not supported by theoretical considerations). In the last case, the relatively large scatter observed in Fig. 2 may be due to the presence of O in the gas phase.
The question remains whether D2CO is formed in the gas phase (Roberts and Millar, 2000b) and frozen out onto the grains or directly formed on the grains as suggested by Tielens (1983). If D2CO is formed on the grains, there must exist an efficient desorption mechanism to release part of the D2CO into the gas phase, even in such cold ( K) environments as pre-stellar cores. The depletion timescale ( yr - to be compared with estimated lifetimes of 106 yr, see Beichman et al. 1986) derived in Bacmann et al. (2002) suggests that desorption mechanisms indeed exist, since it is highly unlikely that all cores from the sample have only reached 1% of their lifetime. The gas-grain model is thus not ruled out by observations of D2CO in the gas phase, even in objects with K. For the rest, the same remarks as on the cloud L1689N (Ceccarelli et al., 2002) apply here. In the absence of O depletion, the atomic D/H ratio is predicted to be around 0.01 (RMa), which is not sufficient to account for the high levels of deuteration observed here (to account for a ratio of 0.05, the atomic D/H ratio would have to be as high as 0.3 - Caselli et al. 2002b). The dashed curve in Fig. 2 represents the predictions of the gas-phase RMb model, which assumes relatively large O depletion as well. Our data compare rather well with those predictions, with the exception of Oph D, which shows a larger [D2CO]/[H2CO] ( 10%) than predicted. However, we point out that another key parameter in the Roberts & Millar model is the electron fractional abundance. The predictions reported in Fig. 2 have been taken from the Fig. 3 of RMb, who assumed an electron fractional abundance around . This is much larger than the value of actually found by Caselli et al. (2002a) in L1544. Fig. 5 of RMa suggests that larger [D2CO]/[H2CO] ratios could be reached if the ionisation fraction is lowered. It is also worth mentioning that the absolute D2CO abundances we measured for the degrees of CO depletion found in the cores (Table 2) are generally smaller than those calculated by RMb (between 10-10 for low depletion factors and 1.6 for depletion factors of 16), though in the end, we find deuterium fractionations similar or higher than those predicted by the model. This discrepancy is strongly marked (one order of magnitude) for the cores with little depletion (L1689B, L1709A and L328). To summarize, gas-phase models, though they can account for the relative deuterium fractionation in most of our objects, cannot explain all of our data. Key points that still need to be fully understood are the depletion of atomic oxygen and its role, as well as the ionization fraction in pre-stellar cores.
References
- Bacmann et al. (2002) Bacmann, A., Lefloch, B., Ceccarelli, C., et al. 2002, A&A, 389, L6
- Beichman et al. (1986) Beichman, C.A., Myers, P.C., Emerson, J.P., et al. 1986, ApJ, 307, 337
- Boogert et al. (2000) Boogert, A.C.A., Ehrenfreund, P., Gerakines, P.A., et al. 2000, A&A, 353, 349
- Caselli (2002) Caselli, C. 2002, Planet. Space Sci., 50, 1133
- Caselli et al. (2002b) Caselli, C., Stantcheva, T., Shalabiea, O., et al. 2002b, Planet. Space Sci., 50, 1257
- Caselli et al. (2002a) Caselli, C., Walmsley, C.M., T., Zucconi, A., et al. 2002a, ApJ, 565, 344
- Caux et al. (1999) Caux, E., Ceccarelli, C., Castets, A., et al. 1999, A&A, 347, L1
- Ceccarelli et al. (2002) Ceccarelli, C., Vastel, C., Tielens, A.G.G.M., et al. 2002, A&A, 381, L17
- Ceccarelli et al. (2001) Ceccarelli, C., Loinard, L., Castets, A., et al. 2001, A&A, 372, 998
- Ceccarelli et al. (1998) Ceccarelli, C., Castets, A., Loinard, L., et al. 1998, A&A, 338, L43
- Charnley et al. (1997) Charnley, S.B., Tielens, A.G.G.M., & Rodgers, S.D. 1997, ApJ, 482, L203
- Dickens et al. (1999) Dickens, J.E., & Irvine, W.M. 1999, ApJ, 518, 733
- Goldsmith and Langer (1999) Goldsmith, P.F., & Langer, W.D. 1999, ApJ, 517, 209
- Leung and Brown (1977) Leung, C.M. & Brown, R.L. 1977, ApJ, 214, L73
- Lis et al. (2002a) Lis, D.C., Roueff, E., Gerin, M., et al. 2002a, ApJ, 571, L55
- Lis et al. (2002b) Lis, D.C., Gerin, M., Phillips, T.G., et al. 2002, ApJ, 569,322
- Lis et al. (2001) Lis, D.C., Keene, J., Phillips, T.G., et al. 2001, ApJ, 561, 823
- Loinard et al. (2002) Loinard, L, Castets, A., Ceccarelli, C., et al. 2002, Planet. Space Sci., 50, 1205
- Roberts and Millar (2000a) Roberts, H., & Millar, T.J. 2000a, A&A, 361, 388
- Roberts and Millar (2000b) Roberts, H., & Millar, T.J. 2000b, A&A, 364, 780
- Roueff et al. (2000) Roueff, E., Tiné, S., Coudert, L.H., et al. 2000, A&A, 354, L63
- Tielens (1983) Tielens, A.G.G.M. 1983, A&A, 119, 177
- Turner (1990) Turner, B.E. 1990, ApJ, 362, L29
- van der Tak et al. (2002) van der Tak, F.F.S., Schilke, P., Müller, H.S.P., et al. 2002, A&A, 388, L53
- Vastel et al. (2000) Vastel, C., Caux, E., Ceccarelli, C., et al. 2000, A&A, 357, 994

| Core | L1544 | L1689B | L1709A | L310 | L328 | L429 | Oph D |
|---|---|---|---|---|---|---|---|
| H2CO() | |||||||
| H2CO() | |||||||
| H2CO() | |||||||
| H2CO() | |||||||
| H2CO() | |||||||
| D2CO() | |||||||
| D2CO() | |||||||
| D2CO() | |||||||
| D2CO() | |||||||
| HCO() |
| Core | ||||||
|---|---|---|---|---|---|---|
| (K) | (cm-2) | (cm-2) | (cm-2) | |||
| L1544 | 7.3 | 2.5 (13) | 9.0 (11) | 4 | 1.6 (23) | |
| L1689B | 8.2 | 1.3 (14) | 9.9 (11) | 0.8 | 1.4 (23) | |
| L1709A | 7.2 | 5.6 (13) | 1.8 (12) | 3 | 1.4 (23) | |
| L310 | 6.9 | 3.5 (12) | (11) | 7.3 (22) | ||
| L328 | 5.9 | 4.3 (13) | (11) | 9.5 (22) | ||
| L429 | 6.6 | 2.8 (13) | 1.3 (12) | 4.5 | 1.4 (23) | |
| Oph D | 7.8 | 2.4 (13) | 2.4 (12) | 10 | 1.4 (23) |