The Chandra Observation of the IP TX Col
Abstract
We present a preliminary look at the serendipitous observation of the intermediate polar TX Col by Chandra. The 52 ksec observation is uninterrupted, providing an opportunity to disentangle the light curve and power spectra components. We illustrate the energy-dependence of the power spectrum.
Harvard-Smithsonian Center for Astrophysics, 60 Garden St., Cambridge, MA 02138 USA
University of Texas at Austin, Austin, TX 78712 USA
1. Introduction
TX Col is a 15-th mag object discovered by HEAO-1 (Wood et al. 1984) and recognized as an intermediate polar in 1985/6 (Buckley et al. 1985; Tuohy et al. 1986). Its orbital period is 20,592 sec with a spin period of 1910 sec (Tuohy et al 1986; Mhlahlo et al., these proceedings).
2. Chandra Observation
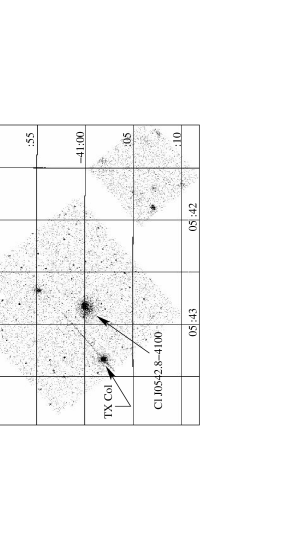
TX Col was observed by Chandra on 2000 July 26/27 for 53 ksec (observation identification number 914); the target was the cluster of galaxies Cl J0542.8-4100 to measure the X-ray temperature function of clusters (e.g., Ikebe et al. 2002). The cluster was within 1′ of the aimpoint, placing TX Col 6′.7 arcmin off-axis on CCD 1 of the ‘imaging’ portion of the ACIS detector. Figure 1 shows the Chandra field-of-view showing that 5 ACIS CCDs were active during the observation. TX Col and the galaxy cluster are indicated.
The estimated count rate was 0.57 counts s-1 with a background rate of 0.006 counts s-1. Both values were obtained by extracting the counts in circles of radii 0.3 and 1 arcmin, respectively. The background circle was displaced from the position of TX Col by 2′ because TX Col falls sufficiently close to the edge of the CCD that half of an annulus centered on TX Col’s position would have extended beyond the chip’s edge. A narrow rectangular region was excluded from the outer portions of the TX Col extraction to eliminate the presence of the frame transfer events.
The off-axis angle reduces the effects of event pileup (Davis 2001). The streak caused by the frame transfer determines the position of TX Col along the CCD columns. We adopted the peak number of events on that line as the center of the observed point spread function. We extracted a radial profile using 21 elliptical annuli spread across 21 pixels (10′′.5); a theoretical point spread function was generated from the Chandra PSF library at the observed off-axis angle. The two functions agreed to better than 5% in the core of the profile and indicated that pileup is at most a minor component of the TX Col observation.

3. Light Curves
We filtered the events into three energy bands: 0.5-1.5, 1.5-4, and 4-8 keV in an effort to separate the high energy source emission and the low-energy absorption. The middle band served simply to permit defining a color. We extracted the events and binned them into 20 bins folded on the spin period of 1910 sec. We arbitrarily adopted the time of the first Chandra event as the starting point for the phasing for this preliminary analysis. Figure 2 shows the result. The zero point is incorrect by 0.5 in phase (depending upon how one defines the ‘peak’). The soft band shows a humped behavior approximately symmetric about the maximum. The medium band shows a steeper rise to maximum with a gradual fall. The hard band is flattened with perhaps a steep rise just after phase 0.0.

Figure 3 (top) shows the complete ACIS light curve, 52 ksec or 26 spin cycles in length. We can easily count the spin cycles, but note that the envelope of the amplitudes changes significantly across the observation. Figure 3 (bottom) expands a portion of the full light curve to show the significant changes in amplitude among individual spin cycles.
4. Power Spectra

Power spectra were computed in the three energy bands for the entire observation as well as across the entire ACIS bandpass for subsets of the observation. There are insufficient events to examine power spectra of energy-filtered subsets.

The power spectra illustrate differences in amplitudes of the various components as a function of energy. The spin frequency is the dominant component in the soft and medium bands, but at the highest energies, the component dominates. Also visible is significant power at the half-integer frequencies, particularly near 8.210-4 Hz, suggesting the presence of a 2 component.
If we split the observation into two ‘orbits’ at precisely the orbital period (the first 20592 sec and the second), and Fourier transform the data, we obtain the power spectra shown in Figure 5. Note that the component is essentially missing from the second orbit.
Table 1 shows a history of the detected periods from ASCA and ROSAT (Norton et al. 1997), and the Chandra observation. Additional periods may be uncovered in the Chandra observation as the analyses of the data are refined. Table 1 represents the primary results to date; quantitative measurements will be included in the final paper describing the Chandra observation; that paper is expected to be submitted for publication in early spring 2003. At this point, the power spectra imply the soft X-rays are disk-fed because the amplitude of the component is approximately equal to the amplitude of the . Our goal with this observation is the Fourier decomposition of the light curve (Warner 1986; Norton et al. 1996).
Acknowledgments.
Support for AS was provided by the US National Science Foundation through the Research Experience for Undergraduates program. The research of EMS was supported by NASA Contract NAS8-39073 to SAO for the Chandra Observatory.
| Satellite | Date | 2 | 2 | |||||
|---|---|---|---|---|---|---|---|---|
| ASCA | 10/1994 | |||||||
| ROSAT | 10/1995 | |||||||
| Chandra | 7/2000 |
References
Buckley, D. A. H. et al. 1985, PASAu, 6, 147
Davis, J. E. 2001, ApJ, 562, 575
Ikebe, Y. et al. 2002, A&A, 383, 773
Norton, A. J. et al. 1997, MNRAS, 289, 362
Norton, A. J. et al. 1996, MNRAS, 280, 937
Tuohy, I. R. et al. 1986, ApJ, 311, 275
Warner, B. 1986, MNRAS, 219, 347
Wood, K. S. et al. 1984, ApJS, 56, 507