New X-ray quasars behind the Small Magellanic Cloud11affiliation: Based on observations collected at the Magellan Baade 6.5-m telescope.
Abstract
We present five X-ray quasars behind the Small Magellanic Cloud, increasing the number of known quasars behind the SMC by 40%. They were identified via follow-up spectroscopy of serendipitous sources from the Chandra X-ray Observatory matched with objects from the OGLE database. All quasars lie behind dense parts of the SMC, and could be very useful for proper motion studies. We analyze X-ray spectral and timing properties of the quasars. We discuss applications of those and other recently discovered quasars behind the SMC to the studies of absorption properties of the Cloud, its proper motion, and for establishing the geometrical distance to the SMC.
1 Introduction
Recent developments in the observations of the Magellanic Clouds — optical monitoring campaigns (such as OGLE and MACHO), which provide astrometry and variability information for a large number of objects, and the observations with the Chandra X-ray Observatory, which provide excellent positional accuracy in X-rays — opened previously unavailable windows for searches for quasars behind the Clouds. As a result, in recent months there was a large increase in the number of known quasars near and behind the LMC and SMC (Geha et al. 2003; Dobrzycki et al. 2002, 2003).
In Dobrzycki et al. (2002) we presented an approach to searches for such quasars based on matching of the serendipitous X-ray sources found by Chandra with the optical information from the OGLE-II database (Udalski et al. 1998; Żebruń et al. 2001). Excellent source positions from Chandra match very well with the OGLE data, which typically have very good seeing and low source confusion. The method is perfectly suited for searches in the densest parts of the Clouds, as it is very well shown by the quasars behind the LMC. While 50 quasars are now known in the general direction of the LMC, only a handful of them are behind the dense parts of the LMC bar, and three of those are Chandra sources.
The downside of the method is the fact that Chandra performs pointed observations only and therefore provides sparse sky coverage. For example, at present there are only five Chandra targets that coincide with the OGLE fields in the LMC.
In this paper, we applied our method to the quasar search behind the Small Magellanic Cloud. There are two Chandra targets in the SMC that coincide with the OGLE fields, and both are very interesting. The first is NGC 346, which was observed for 100 ks. The second is a Chandra calibration source, SNR 1E 0102.2–7219, which has so far been observed 83 times. However, the individual observations of the calibration source placed it at various off-axis angles on various ACIS CCD chips, making the X-ray data analysis complicated.
Quasars behind nearby galaxies, such as the Clouds, are of great astrophysical interest. First, they can provide a fixed reference frame for the proper motion studies. Second, they can provide background sources for the analysis of absorption in the foreground galaxy. Last, but certainly not least, a hunt for X-ray quasars behind the Magellanic Clouds has a potential for a very interesting result. Under favorable conditions (X-ray bright and highly variable quasar) the scattering of X-rays on the dust particles in the LMC or SMC could lead to a direct, geometrical measurement of the distance to the galaxy (for discussion of the concepts involved see, e.g., Trümper & Schönfelder 1973; Paczyński 1991; Klose 1994; Predehl et al. 2000; and references therein).
2 Candidate selection
From the Chandra archive we retrieved all imaging (i.e. with no grating inserted) observations which overlapped the OGLE fields. We reduced and analyzed the X-ray data using tools available in the CIAO 2.3 and SHERPA software packages.111http://cxc.harvard.edu/ciao/ We applied newest gain and aspect corrections to the event lists. We cleaned the electronic streaks in ACIS-S4 chip using DESTREAK. We searched the data for serendipitous point sources using both WAVDETECT and CELLDETECT source detection tools. Searching for sources was straightforward in the case of the observation of NGC 346. For 1E 0102.2–7219 it was more complicated. We concentrated on those observations for which the aim point and large part of the field of view overlapped the OGLE fields. We ran detection tools on all individual observations, but also, whenever it was practical (i.e. when aim points were close enough — typically within 2 arcmin — so that the point spread function size was not dramatically varying from observation to observation) we merged the individual observations in an attempt to improve the photon statistics, and ran detection tools on the merged data sets. However, merging was possible in only a handful of cases. We combined the outputs of all detect runs. As expected, this process led to several spurious sources and duplicate detections. We examined the resulting list of candidates and removed the obvious artifacts and reconciled multiple detections.
Chandra X-ray positions are typically accurate to better than 1 arcsec.222http://cxc.harvard.edu/cal/ASPECT/celmon/; see also Garmire et al. (2000). For each X-ray source, we identified both the closest OGLE object and the closest OGLE variable. We used a conservative threshold of 5 arcsec for the position match. The resulting list contained 80 candidates in both fields.
To aid quasar candidate selection, whenever the net number of source X-ray photons allowed it, we performed a quick spectral analysis, identifying sources with power-law intrinsic spectra and/or higher than typical absorption, which are primary candidates for being QSOs. However, this was only used for prioritizing the follow-up observations and we did not exclude any objects based on this characteristics.
3 Observations and identifications

The optical follow-up spectra were obtained on 2002 September 16-18 with the Magellan Baade 6.5-meter telescope. We used the LDSS-2 imaging spectrograph, with the 1.03 arcsec slit and the 300 l/mm grism, yielding a nominal resolution of 13.3 Å. Exposure times ranged from 120 to 600 seconds. All observations were carried out with the slit oriented in the east-west direction. Additionally, we observed two spectrophotometric standards, LTT 1788 and LTT 7379 (Hamuy et al. 1992). Following each observation, a He-Ne arc lamp spectrum was acquired for wavelength calibration purposes. Spectra were reduced in the standard way using IRAF.
We identified five quasars among 39 observed candidates; we show their optical spectra in Figure 1. We will discuss the properties of the individual objects in detail in the following section. We note that only one of the new quasars, QSO J005719.84–722533.5, was identified by OGLE as a variable. This is a clear indication that the variability- and X-ray-based quasar selections should be considered as complementing one another.
The efficiency of the method is similar to the one seen in the LMC (Dobrzycki et al. 2002). The other objects identified in the follow-up observations were primarily early type stars and X-ray binaries. We will present the analysis of those objects in a forthcoming paper.
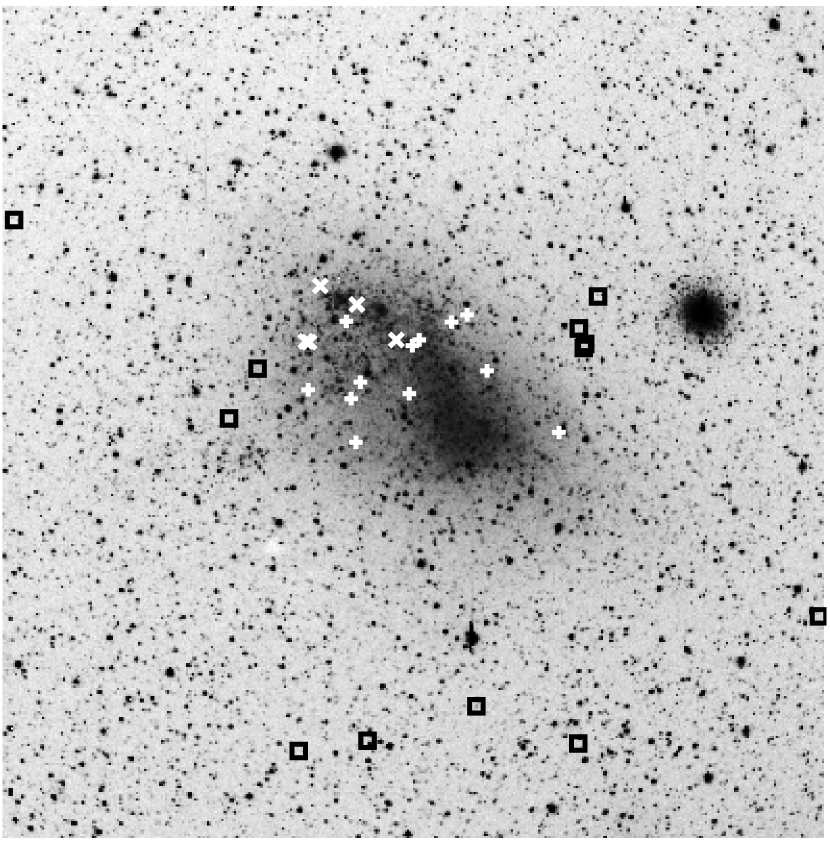
On Figure 2 we show the locations of the new X-ray quasars, and the positions of the variability-selected quasars from Geha et al. (2003) and Dobrzycki et al. (2003). We also show the locations of quasars known prior to 2002. As it can be clearly seen, the methods proposed in the recent papers made a significant difference in both the coverage and the number of known objects. Until mid-2002, there were no known QSOs behind the dense parts of the SMC. Variability-based techniques revealed twelve such quasars. This is still a rather low number, and with the identification of the X-ray QSOs, the number of known quasars behind the dense parts of the SMC has risen by more than 40%.
4 Object properties
4.1 QSO J005719.84–722533.5
This is a relatively bright () quasar at . It is seen serendipitously at a large (17 arcmin) off-axis angle in a 100 ks Chandra/ACIS observation (ObsID 1881) of NGC 346 done on 2001 May 15. As luck would have it, the quasar happened to fall on the backside-illuminated CCD chip ACIS-S3, which has better efficiency at low energies than the frontside-illuminated chips. It is the brightest X-ray quasar from the objects presented here. The event pileup is not a problem due to the large off-axis angle.


Even though the source is very far off-axis in the Chandra observation, where the point spread function is very large, the X-ray and OGLE positions agree remarkably well, to better than 1 arcsec. The quasar lies in the vicinity of a known, but previously unclassified X-ray source 2E 0055.6-7241 (see Table 1).
QSO J005719.84–722533.5 is the only object among the quasars presented here which is classified in Żebruń et al. (2001) as variable. Its light curve (Figure 3) clearly shows slow irregular variability with an amplitude of 0.2 mag. However, this object failed two initial criteria for inclusion in the Eyer (2002) variability-based analysis: it did not have photometry available and it was too red in the color. Therefore, it was not considered by Eyer to be a quasar candidate.
The X-ray observation yielded 2800 source photons with keV, sufficient to establish basic X-ray properties of the quasar. We excluded photons with energies below 0.3 keV since there are large calibration uncertainties for soft X-rays. We extracted source and background spectra using DMEXTRACT. Figure 4 shows the X-ray spectrum. Significant absorption in low energies is clearly visible.
We performed spectral fits with SHERPA. We fitted the spectrum assuming the intrinsic quasar spectrum to be a power law and fixed Galactic absorption towards the SMC. The Milky Way absorbing column alone is not sufficient to explain the dip in the spectrum in the low energies, and additional source of absorption is needed.
In Table 1 we list fit results for two scenarios. First, we attributed the additional absorption to the SMC material alone (in all fits presented in this paper, we assumed the SMC metallicity to be 20% solar; Russell & Dopita 1990, 1992). In Table 1 we also list, for comparison, the SMC hydrogen column density from the Australia Telescope Compact Array (ATCA) 21 cm measurements by Stanimirović et al. (1999). The fit was satisfactory in this scenario, but one can see that the SMC column density necessary to account for the X-ray absorption is ca. two times higher than the ATCA measurement. In principle, this is not an irreconcilable difference. The discrepancy can be reasonably explained by the fact that the ATCA measurements are effectively averaged over a spatial resolution element of 98 arcsec (30 pc at the SMC), while the X-ray absorption is probing a specific line of sight. It is well known that the distribution of hydrogen in the SMC is very inhomogeneous (Staveley-Smith et al. 1997; Stanimirović et al. 1999), and the difference between the ATCA and X-ray fit values for the absorbing column is not dramatically large. Further uncertainly comes from the fact that it is possible that the assumed SMC metallicity may not apply to this specific line of sight, which may affect the estimate of the X-ray absorbing column. Thus it is in principle possible that the absorption is in fact caused only by the material in the SMC.
In the second scenario, we fixed the SMC absorbing column at the ATCA value and attributed the additional absorption to the material at quasar redshift, assumed to have solar abundances. This scenario gave a marginally better fit than the first case. The required quasar intrinsic absorption, cm2, is in the moderate-to-high range, but well within the range seen among AGN (see, e.g., Malizia et al. 1997; Risaliti, Elvis, & Nicastro 2002).
Both scenarios give virtually identical intrinsic spectral properties for the quasar. The spectrum appears to be rather typical (e.g. Mushotzky, Done, & Pounds 1993; Fiore et al. 1998; Reeves & Turner 2000). Figure 4 shows the X-ray spectrum and the model fits to the second scenario; the difference between the fits in both scenarios is too small to be visible on the plot.
We also considered a third scenario, in which both the SMC and redshifted absorption column densities were allowed to vary, but the resulting improvement in the fit did not justify the additional degree of freedom. We need to add that it is, of course, possible that neither scenario is entirely correct and that there are additional absorbers on the line of sight to the quasar, possibly a strong associated absorber or an intervening damped Ly- system (see, e.g., Bechtold et al. 2001). This possibility cannot be explored with the available data.

The X-ray spectral fits were very good, but we note that there are some features seen in the fit residuals, suggesting that the spectrum may be more complex. In particular, we note that there is a small hump near keV, which is 6.4 keV in the quasar rest frame, i.e. just where one would expect to see the iron K line. We note, however, that adding a Gaussian line to the modeled spectrum did not improve the fit.
It is well established that quasars are often variable in X-rays on short timescales (e.g. Mushotzky, Done, & Pounds 1993; Fabian et al. 2002). QSO J005719.84–722533.5 is no exception; it is variable at very high confidence level. We show its X-ray light curve in Figure 5 (we note that in this plot we included events with keV, since low energy calibration uncertainties are not relevant to this issue). During the ca. 28 hours in which the quasar was continuously observed, its ACIS-S3 count rate varied by a factor of two; we note that the background light curve shows no signs of variability during the observation. The characteristic timescale for X-ray variability is 2.5 hours, again well within the typical range for quasars.
4.2 Quasars in the vicinity of SNR 1E 0102.2–7219.
As mentioned above, four of the quasars lie in the vicinity of the Chandra calibration source, SNR 1E 0102.2–7219. This object has been repeatedly observed every few months during the course of the mission, giving a unique opportunity to study variability of the quasars in the timescales of the order of months (see, e.g., Nandra et al. 1997; Bauer et al. 2002; Maoz et al. 2002; Uttley et al. 2003).

Neither of the quasars was classified by OGLE as variable and were therefore not considered in the variability-based search for quasar candidates of Eyer (2002). However, post factum analysis of the OGLE light curves (Figure 6; the data were kindly provided to us by A. Udalski) qualitatively suggests that at least some of them are in fact variable.
Since in various Chandra observations 1E 0102.2–7219 was placed on various ACIS chips at various off-axis angles, it was a matter of coincidence whether any of the quasars happened to be in the field of view in any single observation, and which ACIS CCD chip it happened to be observed with. As a result, the X-ray data for any of the objects is a mix of data taken at various off-axis angles at various readout chips and even various nodes within one chip. Also, the sources were usually observed far off-axis, where the Chandra’s PSF is large, which forced us to use large source regions, and we typically have a substantial number of background events in the source regions. In addition to that, the selection of background regions is severely constrained, in both spatial and temporal domains. The background counts had to be taken from regions with comparable responses to the source regions, excluding regions containing all known sources, and they had to be observation-specific. All those effects result in rather large uncertainties for derived source parameters, especially when temporal properties of the sources are analyzed.
For all quasars, we followed a similar procedure: we extracted data from source and background regions in all observations in which the quasar was in the field of view. We performed the spectral analysis using SHERPA, simultaneously fitting a single model to all datasets. Again, we excluded photons with energies below 0.3 keV, and we fitted the spectrum assuming the intrinsic quasar spectrum to be a power law, with fixed Galactic absorption and additional absorption from the SMC. In one case we also investigated the possibility that the absorbing material could be associated with the quasar.
We note that the errors quoted in Table 1 are formal uncertainties as determined from the spectral fits. However, in some cases there may be hard to quantify, systematic effects. In particular, the estimates of the absorbing column density may be affected by the fact that many of the Chandra observations of our quasars were done with the frontside-illuminated ACIS CCD chips, which have low quantum efficiency in the energy range where absorption is primarily felt, below 1 keV.
We analyzed the long-timescale variability of the quasars by grouping the observations that occurred within few days from one another and performing individual spectral fits on those groups. The group selection was straightforward, since the calibration observations were always done in batches that were separated by several months. Since the number of events in such groups was often small, we used a simplified procedure for spectral fits. We froze the spectral slope and absorbing column and allowed only the spectrum normalization amplitude to vary.
Notes about the individual objects follow.
4.2.1 QSO J010131.45–720702.6
This is a quasar at . Even though it has the noisiest optical spectrum of all objects presented here, its quasar nature seems certain. The spectrum contains two broad features, near 4580 and 7970 Å, identified as Mg II and H.
There are no previously known X-ray sources in the vicinity of this object.
This object was in the Chandra/ACIS field of view in 27 observations. It is, however, faint in X-rays. Even though the combined exposure time for this object was 211.5 ksec, it yielded only 212 net photons with energies above 0.3 keV. This enabled only very limited X-ray spectral analysis.
We fixed the X-ray spectral slope photon power law index to the canonical value of 1.7 and the SMC absorption to the Stanimirović et al. (1999) value, cm-2, and we only allowed the spectrum normalization to vary. We list the results in Table 1.
We would like to note that the observed spectrum contains relatively few soft photons, and that we get much better fit if we set the absorption column to values much higher than the value quoted above. It is, of course, possible that the intrinsic X-ray spectrum is harder than the assumed , which would allow for lower absorbing column. However, even for the photon index as low as 1.2 we get the best fit for the column density 50% higher than the ATCA value. This may indicate that there are other sources of absorption on the line of sight to the quasar.

Not surprisingly, individual data points on the X-ray light curve have large uncertainties (see Figure 7), driven by low signal-to-noise ratio in individual observations. The quasar is clearly too faint to draw any far reaching conclusions, but we can qualitatively say that it shows no indication of variability.
4.2.2 QSO J010522.51–715649.7
This is a quasar with . No X-ray sources were previously known in its vicinity. It was observed by Chandra 36 times for the total of 278 ks, yielding 1166 source photons with keV.
In this particular case the X-ray dataset is not well suited for determination of the absorbing column, since vast majority (32 out of 36) of Chandra observations of this quasar were done with the frontside-illuminated ACIS CCD chips. We thus fixed the SMC absorbing column at the value from Stanimirović et al. (1999) and only allowed the power law index and normalization to vary. The results of the X-ray spectral analysis are shown in Table 1. While still within the typical range, this quasar shows a somewhat steep X-ray spectrum.
QSO J010522.51–715649.7 has the best long baseline time coverage of all the quasars in our sample. While its X-ray light curve (Fig. 7) hints at variability in the 1-1.5 year timescales, with the amplitude variation of 30-40%, we note that this result is not highly significant.
4.2.3 QSO J010656.98–722448.1
This quasar is the second brightest in X-rays of the quasars presented in this paper. It is however faint in the optical/near IR range (). The quasar entered the Chandra/ACIS field of view in just ten observations, in four epochs, with the combined exposure time of 75 ksec. The observations yielded 1160 source photons with keV.
QSO J010656.98–722448.1 was observed in X-rays with ROSAT (Tab. 1), but was not identified as a quasar.
The quasar has very typical X-ray properties. The SMC absorbing column in the fit is in good agreement with the ATCA measurement; the small discrepancy can be reasonably explained by the clumpiness of hydrogen content in the SMC. We also attempted a fit with the SMC column density fixed at the ATCA value allowing for intrinsic absorption at the quasar. Since the result from the SMC-only scenario is close to the ATCA value to begin with, the resulting quasar absorption is — not surprisingly — only weakly constrained.
Since the object has been observed in X-rays in only four epochs, there is limited variability information available, even though the quasar is relatively bright in X-rays and individual measurements are reliable. We note that the light curve (Fig. 7) is statistically consistent with a constant flux.
4.2.4 QSO J010717.66–722418.3
This is the quasar with highest redshift, , but it is faint in both the optical range () and in X-rays. It was observed by Chandra only seven times, in only three epochs, with the combined exposure of 52 ksec. The total yield was 142 source photons with energies higher than 0.3 keV, allowing for only very limited spectral analysis. We fixed the spectral slope at 1.7 and the SMC absorption at the ATCA value, cm-2, and only allowed the spectrum normalization to vary. The result is listed in Table 1. For completeness, we show the X-ray light curve of the quasar in Fig. 7. The quasar is clearly too faint for any meaningful variability analysis; we only note that the data are consistent with no variability.
The position of the quasar agrees very well with the position of a weak, unclassified source observed in X-rays with ROSAT (Haberl et al. 2000).
5 Discussion
We present five X-ray-selected quasars behind the dense parts of the Small Magellanic Cloud, increasing the number of known such quasars by 40%. Their positions make them excellent reference points for the proper motion studies. The efficiency of our quasar detection method in the SMC is comparable to the efficiency seen earlier in the LMC (Dobrzycki et al. 2002).
Only one of the five quasars was classified by OGLE as a variable object. This is a clear confirmation of the fact that X-ray-based quasar searches are complimentary to variability-based searches (Eyer 2002; Dobrzycki et al. 2003; Geha et al. 2003).
The quasars presented here show typical X-ray properties. It was feasible to analyze X-ray absorption in only two of the available lines of sight (of the other objects, two were too faint in X-rays and one had little usable data below 1 keV). In one case, QSO J005719.84–722533.5, there appears to be some evidence that the absorbing column in the SMC may not be enough to explain the observed dip in the spectrum at low energies and that there is additional source of absorption, possibly associated with the quasar. In the second case, QSO J010656.98–722448.1, SMC absorbing column alone seems to satisfactory explain the observed absorption.
One of the five quasars — QSO J005719.84–722533.5 — is particularly interesting. At it is sufficiently bright in the optical/near IR range to allow future spectroscopy with the Cosmic Origin Spectrograph aboard the Hubble Space Telescope. It is also relatively bright in X-rays and it could be the quasar that would provide direct determination of the distance to the SMC. Ideally, such a quasar would show a quick, in the timescale of days, rise in X-ray flux. That would enable measurement of the growth of the angular size of the X-ray halo scattered on the dust in the SMC and a geometrical determination of the distance to the Cloud. Such rapid rises in X-ray brightness are not unheard of (see, e.g., Maoz et al. 2002; Uttley et al. 2003). Currently, we only have a direct evidence of short-timescale variability in X-rays for this quasar. However, there are indications that at least in some cases long-timescale variations in X-rays and in the optical range do correlate (Peterson et al. 2000; Uttley et al. 2003; but see also Maoz et al. 2002). This quasar is optically variable with the characteristic timescale of several days (Figure 3), and it is continuously monitored by the OGLE project. It is thus viable to set up X-ray monitoring based on the behavior of the optical brightness of the quasar.
References
- (1)
- (2) Bauer, F. E., et al. 2002, preprint (astro-ph/0212389)
- (3)
- (4) Bechtold, J., Siemiginowska, A., Aldcroft, T. L., Elvis, M., & Dobrzycki, A. 2001, ApJ, 562, 133
- (5)
- (6) Dobrzycki, A., Groot, P. J., Macri, L. M., & Stanek, K. Z. 2002, ApJ, 569, L15
- (7)
- (8) Dobrzycki, A., Macri, L. M., Stanek, K. Z., & Groot, P. J. 2003, AJ, 125, 1330
- (9)
- (10) Eyer, L. 2002, AcA, 52, 241
- (11)
- (12) Fabian, A. C. et al. 2002, MNRAS, 335, L1
- (13)
- (14) Fiore, F., Elvis, M., Giommi, P., & Padovani, P. 1998, ApJ, 492, 79
- (15)
- (16) Garmire, G., Feigelson, E. D., Broos, P., Hillenbrand, L. A., Pravdo, S. H., Townsley, L., & Tsuboi, Y. 2000, AJ, 120, 1426
- (17)
- (18) Geha, M., et al. (MACHO collaboration) 2003, AJ, 125, 1
- (19)
- (20) Haberl, F., Filipović, M. D., Pietsch, W., & Kahabka, P. 2000, A&AS, 142, 41
- (21)
- (22) Hamuy, M., Walker, A. R., Suntzeff, N. B., Gigoux, P., Heathcote, S. R., & Phillips, M. M. 1992, PASP, 104, 533
- (23)
- (24) Kahabka, P., Pietsch, W., Filipović , M. D., & Haberl, F. 1999, A&AS, 136, 81
- (25)
- (26) Klose, S. 1994, ApJ, 423, L23
- (27)
- (28) Malizia, A., Bassani, L., Stephen, J. B., Malaguti, G., & Palumbo, G. G. C. 1997, ApJS, 113, 311
- (29)
- (30) Maoz, D., Markowitz, A., Edelson, R., & Nandra, K. 2002, AJ, 124, 1988
- (31)
- (32) Mushotzky, R. F., Done, C., & Pounds, K. A. 1993, ARA&A, 31, 717
- (33)
- (34) Nandra, K., George, I. M., Mushotzky, R. F., Turner, T. J., & Yaqoob, T. 1997, ApJ, 476, 70
- (35)
- (36) Paczyński, B. 1991, AcA, 41, 257
- (37)
- (38) Peterson, B. M., et al. 2000, ApJ, 542, 161
- (39)
- (40) Predehl, P., Burwitz, V., Paerels, F., & Trümper, J. 2000, A&A, 357, L25
- (41)
- (42) Reeves, J. N., & Turner, M. J. L. 2000, MNRAS, 316, 234
- (43)
- (44) Risaliti, G., Elvis, M., & Nicastro, F. 2002, ApJ, 571, 234
- (45)
- (46) Russell, S. C., & Dopita, M. A. 1990, ApJS, 74, 93
- (47)
- (48) Russell, S. C., & Dopita, M. A. 1992, ApJ, 384, 508
- (49)
- (50) Sasaki, M., Haberl, F., & Pietsch, W. 2000, A&AS, 147, 75
- (51)
- (52) Stanimirović, S., Staveley-Smith, L., Dickey, J. M., Sault, R. J., & Snowden, S. L. 1999, MNRAS, 302, 417
- (53)
- (54) Staveley-Smith, L., Sault, R. J., Hatzidimitriou, D., Kesteven, M. J., & McConnell, D. 1997, MNRAS, 289, 225
- (55)
- (56) Trümper, J. & Schönfelder, V. 1973, A&A, 25, 445
- (57)
- (58) Udalski, A., Szymański, M., Kubiak, M., Pietrzyński, G., Woźniak, P., & Żebruń, K. (OGLE collaboration) 1998, AcA, 48, 147
- (59)
- (60) Uttley, P., Edelson, R., McHardy, I. M., Peterson, B. M., & Markowitz, A. 2003, ApJ, 584, L53
- (61)
- (62) Yokogawa, J., Imanishi, K., Tsujimoto, M., Nishiuchi, M., Koyama, K., Nagase, F., & Corbet, R. H. D. 2000, ApJS, 128, 491
- (63)
- (64) Żebruń, K., et al. (OGLE collaboration) 2001, AcA, 51, 317
- (65)
| OGLE IDaaContains J2000.0 equatorial coordinates. | OffsetbbOffset between Chandra and OGLE positions, in arcsec. | cc magnitude, from Żebruń et al. 2001 (J005719.84–722533.5) and Udalski et al. 1998 (remaining four objects). | Redshift | ExpddChandra exposure time in ks. For the last four objects it is the combined exposure for all observations in which it was in the field of view. | eeNet source events with keV after background subtraction. | ffGalactic absorbing column in cm-2, from http://cxc.harvard.edu/toolkit/colden.jsp | ggSMC absorbing column in cm-2, from ATCA observations by Stanimirović et al. 1999. Values are 0.01. | hhSMC absorbing column in cm-2, from spectral fit. “ATCA FIX” indicates the value fixed at the Stanimirović et al. 1999 value. | iiIntrinsic quasar absorbing column in cm-2, from spectral fit. | jjPhoton spectral index, from spectral fit. “FIX” indicates that the value was fixed. | NormkkPower law normalization at 1 keV, in photons cm-2s-1keV-1, from spectral fit. | FluxllUnabsorbed flux in the 2-10 keV range, in erg cm-2s-1, from spectral fit. |
|---|---|---|---|---|---|---|---|---|---|---|---|---|
| J005719.84–722533.5mmObject No. 120 in Kahabka et al. 1999 (classified there as a “weak hard X-ray binary”), object No. 234 in Haberl et al. 2000, and object No. 18 in Yokogawa et al. 2000. | 0.7 | 17.5 | 0.15 | 98.7 | 2816 | 0.675 | 7.38 | 14.61.5 | 2.080.11 | 11.31.1 | 24.7 | |
| ATCA FIX | 35.37.3 | 2.020.10 | 10.620.87 | 25.4 | ||||||||
| J010131.45–720702.6 | 18.5 | 0.64 | 211.5 | 212 | 0.707 | 4.09 | ATCA FIX | 1.7 FIX | 0.2140.025 | 0.86 | ||
| J010522.51–715649.7 | 0.7 | 18.3 | 1.64 | 278.2 | 1166 | 0.628 | 6.19 | ATCA FIX | 1.630.04 | 0.9590.041 | 4.28 | |
| J010656.98–722448.1nnObject No. 200 in Kahabka et al. 1999 (classified there as a “weak hard X-ray binary”), object No. 230 in Haberl et al. 2000 (classified there as “hard”), and object No. 116 in Sasaki et al. 2000. | 0.4 | 19.2 | 0.51 | 75.3 | 1160 | 0.540 | 3.51 | 5.191.21 | 1.450.10 | 3.190.30 | 19.2 | |
| ATCA FIX | 1.180.77 | 1.450.09 | 3.180.27 | 19.2 | ||||||||
| J010717.66–722418.3ooObject No. 227 in Haberl et al. 2000. | 0.6 | 19.3 | 1.82 | 52.5 | 142 | 0.515 | 3.55 | ATCA FIX | 1.7 FIX | 0.5550.065 | 2.24 |