A First Estimate of the Baryonic Mass Function of Galaxies
Abstract
We estimate the baryonic (stellarcold gas) mass function of galaxies in the local Universe by assigning a complete sample of Two Micron All Sky Survey and Sloan Digital Sky Survey galaxies a gas fraction based on a statistical sample of the entire population, under the assumption of a universally-applicable stellar initial mass function. The baryonic mass function is similar to the stellar mass function at the high mass end, and has a reasonably steep faint-end slope owing to the typically high cold gas fractions and low stellar mass-to-light ratios characteristic of low-mass galaxies. The Schechter Function fit parameters are Mpc-3 log, , and , with formal error estimates given in parentheses. We show that the Hi and H2 mass functions derived using this indirect route are in agreement with direct estimates, validating our indirect method. Integrating under the baryonic mass function and incorporating all sources of uncertainty, we find that the baryonic (stellarcold gas) mass density implied by this estimate is , or 8% of the Big Bang nucleosynthesis expectation.
1 Introduction
The distribution of the mass in collapsed baryons (cold gas and stars) in galaxies is a fundamental prediction of galaxy formation models. Unfortunately, to date there is no robust estimate of the baryonic mass function (MF) of galaxies, leaving modelers with the non-trivial task of predicting stellar masses or, even worse, galaxy luminosities. Discrepancy between the model and data may indicate a problem with the predicted distribution of galaxy baryonic masses, or could represent poorly-constrained star formation (SF), stellar population or dust prescriptions. In this Letter, we present a first estimate of the baryonic MF of galaxies by assigning galaxies gas fractions statistically (based on an independent sample), under the assumption of a universally-applicable stellar initial mass function (IMF).111A time-varying IMF, as speculated on by Hernandez & Ferrara (2001) or Ferguson, Dickinson, & Papovich (2002), would invalidate this assumption.
The time is ripe to attempt this for the first time. With the advent of large, relatively complete surveys, the luminosity function (LF) is now well-constrained in the optical and near-infrared (NIR) (Gardner et al., 1997; Cole et al., 2001; Kochanek et al., 2001; Norberg et al., 2002; Liske et al., 2003; Blanton et al., 2003; Bell et al., 2003). Furthermore, under the assumption of a universally-applicable stellar IMF, the distribution of stellar masses is reasonably well-constrained, with an overall normalization uncertainty caused by our relatively poor knowledge of the faint end slope of the IMF (Cole et al., 2001; Bell et al., 2003). Crucially, there are also relatively large samples of galaxies with -band data and gas masses, allowing a reasonably accurate characterization of the gas mass of galaxies as a function of their physical parameters (Bell & de Jong, 2000).
2 The Data and Methodology
Because of the lack of a large galaxy survey with both gas mass and -band data, we take a sampling approach, analogous to that used by Loveday (2000) to estimate the -band luminosity function from a -band limited survey. Essentially, we estimate a stellar MF (§2.1) and then add representative gas masses to each galaxy (§2.2), allowing us to estimate the distribution of galaxy baryonic masses (§3). We assume , , and km s-1 Mpc-1.
2.1 Estimating the Stellar Mass Function
We construct the baryonic MF using a combined sample of galaxies from the Two Micron All Sky Survey (2MASS; Skrutskie et al., 1997) and the Sloan Digital Sky Survey (SDSS; York et al., 2000). We use the SDSS early data release (EDR; Stoughton et al., 2002) to provide an 84% redshift complete sample of galaxies with accurate fluxes over 414 square degrees, which is 10% less than the whole EDR imaging area because some spectroscopic plates that were not attempted (Stoughton et al., 2002). The 84% redshift completeness within this area is our own direct estimate based on the fraction of galaxies fulfilling the Strauss et al. (2002) criteria that have spectra, in agreement with the EDR analysis of Nakamura et al. (2003). To account for light missed by the Petrosian magnitude estimator (Strauss et al., 2002; Blanton et al., 2003), we add 15% to the fluxes of galaxies morphologically classified as early-type using the SDSS -band concentration parameter following Strateva et al. (2001). This correction produces only a % effect on the LFs and MFs (Blanton et al., 2003; Bell et al., 2003). We also correct for an % overdensity of galaxies in the EDR, as estimated by comparing the number of galaxies in the EDR spectroscopic area with that from the sky with .
We use the now complete 2MASS extended source and point source catalogs to augment the SDSS fluxes with -band fluxes, and for extended sources -band half-light radii. We correct 2MASS -band fluxes to total following a comparison with deeper -band data from Loveday (2000); for extended sources this amounts to a 0.1 mag correction (Bell et al., 2003). We do not use 2MASS or -band data here because we cannot correct the magnitudes similarly. The optical and NIR magnitude zero points are accurate to 0.05 and 0.02 mag respectively, and the random errors are 0.05 mag (optical) and 0.2 mag (NIR).
To estimate -corrections, evolution corrections, and the present day stellar mass-to-light ratios (M/Ls), we fit the observed fluxes222Not all galaxies have fluxes. We have checked that missing passbands do not significantly bias the estimated -corrections, evolution corrections or stellar M/Ls (but do, of course, increase the random error somewhat). with model stellar populations. These populations have a range of metallicities and SF histories at a given redshift. We use the Pégase stellar population synthesis model (see Fioc & Rocca-Volmerange, 1997, for a description of an earlier version of their model) with a ‘diet’ Salpeter IMF (following Bell & de Jong, 2001) that has the same colors and luminosity as a normal Salpeter IMF, but with only 70% of the mass (due to a smaller number of low-mass stars). Corrections derived using this technique are consistent with those used by Blanton et al. (2003). The stellar M/Ls we derive are within 10% of those from the spectral modeling technique of Kauffmann et al. (2003), accounting for differences in IMF; the random and systematic uncertainties from dust and bursts of SF dominate, however, and are % (Bell & de Jong, 2001). This IMF is ‘maximum disk’, inasmuch as IMFs richer in faint low-mass stars over-predict the rotation velocity of Ursa Major Cluster galaxies with -band photometry and well-resolved Hi rotation curves. This prescription thus gives the maximum possible stellar M/L. Naturally, a different choice of IMF allows lower M/Ls. For example, the popular Kennicutt or Kroupa IMFs have 37% lower M/Ls than this IMF, and are thus ‘submaximal’ (see Bell & de Jong, 2001, for more discussion of this point).
We calculate LFs and stellar MFs using the formalism (Felten, 1977), taking into account foreground Galactic extinction, -corrections, and evolution corrections. In Bell et al. (2003), we match precisely published LFs; in particular, we reproduce the -band and -band LF and luminosity densities to within % (Blanton et al., 2003; Cole et al., 2001; Kochanek et al., 2001). Furthermore, this method produces accurate stellar MFs that match the estimate of Cole et al. (2001) to 5% in total stellar mass density (accounting for IMF differences), but can do so using LFs limited by optical or NIR magnitude limits (Bell et al., 2003). For this Letter, we choose 11848 galaxies with and , which ensures that we have accurate color estimates providing a stellar M/L accuracy of better than 25%, while avoiding potential biases against low surface brightness galaxies in 2MASS (Bell et al., 2003). The stellar MF estimated using this technique is shown in Fig. 2, along with the stellar MF of Cole et al. (2001) for comparison. A much more extensive description of the LF and stellar MF construction is given by Bell et al. (2003).
2.2 Estimating Gas Masses
Because there are no samples of galaxies with good number statistics, deep optical/NIR data and gas masses, we estimate the gas masses of SDSS2MASS galaxies indirectly. We use galaxies from Bell & de Jong (2000) with -band luminosities, half-light radii and gas masses to statistically assign a gas mass to every SDSS2MASS galaxy, appropriate to its -band luminosity and half-light radius.

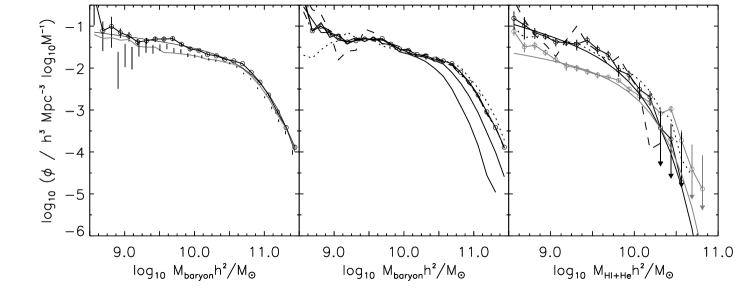
Fig. 1 shows the -band half-light radii and luminosities for the late-type subsample of the SDSS2MASS galaxies (contours) and for the comparison sample of 156 galaxies with gas masses (filled circles) taken from Bell & de Jong (2000). We estimate gas masses by multiplying the Hi gas mass by 1.33 to account for helium, and by the morphological type-dependent H2 to Hi ratio presented by Young & Knezek (1989). For the 21% of the galaxies without -band luminosities and sizes, we adopt the -band half-light radii and estimate the -band luminosity by dividing the -band-derived stellar mass by the model -band stellar M/L. Our assumptions are accurate to better than 40% in both cases, and make no difference to our results.
Each SDSS2MASS galaxy is assigned a gas mass from a galaxy in the Bell & de Jong (2000) comparison sample with similar half-light radius and -band luminosity. For galaxies morphologically classified as late-type we assign gas masses using a randomly chosen comparison galaxy that is within a factor of two in size, and within one magnitude in -band luminosity. Galaxies are morphologically classified using the -band concentration parameter following Strateva et al. (2001). We scale the gas mass by the difference in luminosity to conserve the galaxy gas fraction. As a consistency check, we also assign gas masses by choosing the nearest galaxy in half-light radius–luminosity space, and by assigning gas to galaxies of all morphological types (see Fig. 2). These changes make no appreciable difference to our results.
3 The Baryonic Galaxy Mass Function
Our baryonic galaxy MF is shown as the solid line with open circles in the left panel of Fig. 2. Shown for comparison is the stellar MF from Cole et al. (2001), and the -selected stellar MF described above and in Bell et al. (2003). The baryonic galaxy MF follows the stellar MF at high masses, shows a modest offset at the ‘knee’ of the MF, and shows a reasonably steep faint-end slope. This behavior is expected, as low-mass field galaxies tend to have high cold gas fractions and more ongoing SF (Bell & de Jong, 2000; Kauffmann et al., 2003b), which steepens the baryonic MF compared to optical/NIR LFs that typically have . The Schechter Function fit parameters are Mpc-3 log, , and , where the formal error estimates are in parentheses.
In the middle panel of Fig. 2, we show the effects of the systematic uncertainties. In particular, the dashed, dotted and dot-dashed lines show the effects of changing the gas mass assignment (see the figure caption for more details); these uncertainties have only small effects. The two bare solid lines show the effect of assuming different stellar IMFs. As stated earlier, we adopt as our default an IMF that has the largest stellar M/L permitted, without over-predicting the rotation velocities of spiral galaxies in the Ursa Major Cluster (solid line with open circles; Bell & de Jong, 2001). Yet, the stellar M/L may be lower than this maximal value; thus, we show two cases. First, we plot (upper solid line) the increasingly popular Kroupa, Tout, & Gilmore (1993) and Kennicutt (1983) IMFs, which both have M/Ls of 70% of maximal IMF (50% Salpeter). The other case is an IMF that has M/Ls of only 40% of our maximal IMF (the lowest solid line), which corresponds roughly to the 63% disk velocity contribution to the rotation curve as argued by Bottema (1997). It is clear that, assuming a universal IMF, the factor-of-two uncertainty in the stellar M/L dominates the error budget in terms of total cold baryonic mass in the local Universe. Given the stellar IMF, the systematic uncertainties are %. We estimate these uncertainties using different passbands to estimate stellar mass, using different gas mass assignment methods, and accounting for the effects of dust and bursts of SF on the M/Ls (Bell & de Jong, 2001; Bell et al., 2003). The Schechter Function fit parameters for the Kennicutt/Kroupa case and the Bottema case are: Mpc-3 log, , and .
It is important to make sure that our statistical procedure assigns gas masses consistent with the true galaxy population by comparing with the Hi or H2 MF of galaxies (the right hand panel of Fig. 2). The solid black line with open circles and error bars is our Hi MF derived in this way. The dashed and dotted lines show the effects of using the closest galaxy to estimate gas mass and allowing elliptical galaxies to have gas mass, respectively. For comparison, the Hi MF of the blind Hi Aricebo survey of Rosenberg & Schneider (2002) is plotted as the smooth solid curve. We also show our prediction of the H2 galaxy MF as the lower solid grey line with open circles and error bars. For comparison, we plot the Schechter Fit to the first observational estimate of the H2 MF (Keres, Yun, & Young, 2003). Given the uncertainties, it is clear that our method for estimating galaxy gas masses reproduces the Hi and H2 galaxy MFs with astonishing precision. Therefore, the sample of galaxies that we use to assign gas masses is indeed reasonably representative, and lends considerable credibility to our estimate of the baryonic galaxy MF.
4 Discussion
Even with the factor-of-two uncertainty from the contribution of low-mass stars to the overall stellar M/L, we can still draw some conclusions about the local Universe. It is clear that the overall efficiency of galaxy formation is very low. Firstly, the faint end slope of the baryonic MF is , which is much shallower than the expected for the halo MF (e.g., White & Frenk, 1991). Secondly, integrating under the MF, we derive , including the IMF and 25% systematic stellar M/L uncertainties. Our estimate agrees well with the value of from Fukugita et al. (1998), and is preferred due to our better accounting for stellar M/Ls compared with Fukugita et al. (1998) who use (harder to convert into stellar mass) -band luminosity densities assuming a similar IMF to the maximum-disk IMF we adopt here. Taking the value of the total baryon density from the Big Bang nucleosynthesis value of O’Meara et al. (2001), and assuming h=0.70.07, we find %, where the error estimates account for the uncertainties in IMF, H0, , our gas assignment method, and the 25% uncertainties in stellar M/Ls from dust and bursts of SF. Our value is quite consistent with the low galaxy formation efficiency characteristic of most current models, which have low efficiencies at the low and high-mass ends because of feedback from supernovae and inefficient gas cooling, respectively (e.g., Cole et al., 2000).
Accounting for the possible gaseous content of elliptical galaxies, for sub-maximal M/Ls, and for the effects of dust and bursts of SF on stellar M/Ls, the universal gas fraction, , should lie in the range . For the ‘maximal’ IMF, we find %. Fukugita et al. (1998) and Keres, Yun, & Young (2003) find values of 15–20% when our IMF is adopted; their slightly lower determinations stem primarily from a lower estimate of Hi mass density. Nevertheless, all the studies agree that ; therefore, the dynamically cold baryons (i.e., the gas and stars in disks and spheroids) are primarily in the form of stars, even for low stellar M/Ls.
It is well-known observationally that cluster optical/NIR LFs have steeper faint-end slopes than field LFs (e.g., Trentham & Tully, 2002). Furthermore, cluster galaxies tend to have little ongoing SF and little gas, so that most cluster galaxies are star-dominated with large stellar M/Ls (e.g., Kuntschner, 2000). Thus, the trend of increasing faint end slope with increasing cluster mass noted by e.g., Trentham & Tully (2002) may be more naturally interpreted as a constant baryonic MF, with a suppression of recent SF in massive clusters of galaxies. Obviously, a deeper investigation of this issue is warranted before speculating any further.
5 Conclusions
Together with the baryonic (stellarcold gas) luminosity–linewidth relation (e.g., McGaugh et al., 2000; Bell & de Jong, 2001), the baryonic galaxy MF is an ideal test of models of galaxy formation and evolution. In this Letter, we have estimated the baryonic galaxy MF in the local Universe for the first time assuming a universally-applicable stellar IMF. We assign gas fractions statistically to a large sample of galaxies from 2MASS and SDSS, using a local sample with accurate -band and gas fraction data. We cross-check this statistical procedure against independent Hi and H2 surveys, finding excellent agreement. The baryonic MF is similar to the stellar MF at the high mass end (with a slightly higher density normalization), and has a reasonably steep faint end slope, , due to the typically high cold gas fractions and low stellar M/Ls of low-mass galaxies. Integrating under the baryonic MF, we find that the baryonic (stellarcold gas) mass density implied by this estimate is , or 8% of the Big Bang nucleosynthesis expectation. This clearly implies a low overall efficiency of galaxy formation.
References
- Bell et al. (2003) Bell, E. F., McIntosh, D. H., Katz, N., & Weinberg, M. D. 2003, in preparation
- Bell & de Jong (2000) Bell, E. F., & de Jong, R. S. 2000, MNRAS, 312, 497
- Bell & de Jong (2001) Bell, E. F., & de Jong, R. S. 2001, ApJ, 550, 212
- Blanton et al. (2003) Blanton, M. R., et al. 2003, submitted to ApJ (astro-ph/0210215)
- Bottema (1997) Bottema, R. 1997, A&A, 328, 517
- Cole et al. (2000) Cole, S., Lacey, C., Baugh, C. M., & Frenk, C. S. 2000, MNRAS, 319, 168
- Cole et al. (2001) Cole, S., et al. 2001, MNRAS, 326, 255
- Felten (1977) Felten, J. E. 1977, AJ, 82, 861
- Ferguson, Dickinson, & Papovich (2002) Ferguson, H. C., Dickinson, M., & Papovich, C. 2002, ApJ, 569, L65
- Fioc & Rocca-Volmerange (1997) Fioc, M., & Rocca-Volmerange, B. 1997, A&A, 326, 950
- Fukugita et al. (1998) Fukugita, M., Hogan, C. J., & Peebles, P. J. E. 1998, ApJ, 503, 518
- Gardner et al. (1997) Gardner, J. P., Sharples, R. M., Frenk, C. S., & Carrasco, B. E. 1997, 480L, 99
- Hernandez & Ferrara (2001) Hernandez, X., & Ferrara, A. 2001, MNRAS, 324, 484
- Kauffmann et al. (2003) Kauffmann, G., et al. 2003a, MNRAS, in press (astro-ph/0205055)
- Kauffmann et al. (2003b) Kauffmann, G., et al. 2003b, MNRAS, in press (astro-ph/0205070)
- Keres, Yun, & Young (2003) Keres, D., Yun, M. S., & Young, J. S. 2003, ApJ, in press (astro-ph/0209413)
- Kochanek et al. (2001) Kochanek, C. S., et al. 2001, ApJ, 560, 566
- Kuntschner (2000) Kuntschner, H. 2000, MNRAS, 315, 184
- Liske et al. (2003) Liske, J., Lemon, D. J., Driver, S. P., Cross, N. J. G., & Couch, W. J. 2003, submitted to MNRAS (astro-ph/0207555)
- Loveday (2000) Loveday, J. 2000, MNRAS, 312, 557
- Kennicutt (1983) Kennicutt, Jr., R. C. 1983, ApJ, 272, 54
- Kroupa, Tout, & Gilmore (1993) Kroupa, P., Tout, C. A., & Golmire, G. 1993, MNRAS, 262, 545
- McGaugh et al. (2000) McGaugh, S. S., Schombert, J. M., Bothun, G. D., & de Blok, W. J. G. 2000, ApJ, 533, L99
- Nakamura et al. (2003) Nakamura, O., et al. 2003, AJ, in press (astro-ph/0212405)
- Norberg et al. (2002) Norberg, P., et al. 2002, MNRAS, 332, 827
- O’Meara et al. (2001) O’Meara, J. M., et al. 2001, ApJ, 552, 718
- Rosenberg & Schneider (2002) Rosenberg, J. L., & Schneider, S. E., 2002, ApJ, 567, 237
- Skrutskie et al. (1997) Skrutskie, M. F., et al. 1997, in ‘The Impact of Large Scale Near-IR Sky Surveys’, eds. F. Garzon et al., p 25. (Dordrecht: Kluwer Academic Publishing Company)
- Stoughton et al. (2002) Stoughton, C., et al. 2002, AJ, 123, 485
- Strateva et al. (2001) Strateva, I., et al. 2001, AJ, 122, 1861
- Strauss et al. (2002) Strauss, M. A., et al. 2002, AJ, 124, 1810
- Trentham & Tully (2002) Trentham, N., & Tully, R. B. 2002, MNRAS, 335, 712
- White & Frenk (1991) White, S. D. M., & Frenk, C. S. 1991, ApJ, 379, 52
- York et al. (2000) York, D. G., et al. 2000, AJ, 120, 1579
- Young & Knezek (1989) Young, J. S., & Knezek, P. M. 1989, ApJ, 347, L55