Spectral analysis of sdB stars from the Hamburg Quasar Survey††thanks: Based on Observations collected at the German-Spanish Astronomical Center (DSAZ), Calar Alto, operated by the Max-Planck-Institut für Astronomie Heidelberg jointly with the Spanish National Commission for Astronomy.
We present the results of a spectral analysis of a large sample of subdwarf B stars selected from follow-up observations of candidates from the Hamburg Quasar Survey. Fundamental parameters (effective temperature, gravity, and helium abundance) were determined by matching synthetic line profiles calculated from model atmospheres to all hydrogen and helium absorption lines present in the observed optical spectra. The derived helium abundances are compared with the atmospheric parameters to search for possible trends. We discovered a correlation between the helium abundance and the effective temperature: the larger the temperature, the larger the photospheric helium content of sdB stars. Additionally, a separation into two sequences of sdB stars in the effective temperature – helium abundance plane is detected. We compared our analysis results with data from the literature. The stars from our sample are found to be somewhat more luminous. This can only partly be explained by NLTE effects. Three apparently normal B stars were discovered, which could be massive stars far away from the galactic plane (7-19kpc). Radial velocities were measured for 23 stars from which we discovered a new radial velocity variable sdB star.
Key Words.:
stars: abundances – stars: atmospheres – stars: distances – stars: horizontal-branch – stars: subdwarfsemail: edelmann@sternwarte.uni-erlangen.de
1 Introduction

The Hamburg Quasar Survey (HQS) was carried out, starting in 1980, with the 80cm Schmidt telescope at the German-Spanish Astronomical Center (DSAZ) on Calar Alto, Spain (Hagen et al. Hag95 (1995)). Although it was primarily initiated as a quasar survey, it is also a very rich source of faint blue stars. Unlike the Palomar Green (PG) survey (Green et al. Gre86 (1986)) and most other surveys, objective prism spectra (spectral resolution of 45Å FWHM at Hγ) were obtained. Afterwards, the HQS plates were digitized in Hamburg using a PDS microdensitometer. A search software selects quasar candidates as well as faint blue stars from the 30 000 – 50 000 spectra per plate in the magnitude range of 135 185. Selection criteria are blue continua and/or emission lines (Hagen et al. Hag95 (1995)).
In a collaboration between the institutes in Hamburg, Kiel, Tübingen, and Bamberg, follow-up observations and analyses of visually selected candidates of hot stars were performed.
The current database of follow-up observations contains well over 400 confirmed stars. The dominant fractions of the list are hot subdwarfs () and white dwarfs (). A lot of very rare and unusual stars also were found. The discovery of four PG 1159, nine hot DO, and five DAO white dwarfs, so far, are the highlights of the follow-up observations (Heber, Dreizler & Hagen Heb96 (1996) and references therein). A comprehensive summary of the results from the HQS follow-up observations of hot stars can be found in Heber, Jordan & Weidemann (HJW91 (1991)), Dreizler et al. (Dre94 (1994)), Lemke et al. (1997a , sdO stars), and Homeier et al. (Hom98 (1998), Hom99 (1999), DA white dwarfs).
The present analysis focuses on the subluminous B, or subdwarf B (sdB) stars discovered by our campaigns of follow-up spectroscopy. In the Hertzsprung-Russell-Diagram (HRD), sdB stars populate a very narrow area which lies on a blueward extension of the horizontal branch (HB), the so called extreme horizontal branch (EHB, Heber et al. Heb84 (1984), Heber Heb86 (1986), and Saffer et al. Saf94 (1994)). They have hydrogen dominated atmospheres (typically: ), with effective temperatures of and their logarithmic surface gravities are typically between 5.0 and 6.0 (cgs). SdB stars consist of a helium-burning core with a canonical mass of surrounded by a thin hydrogen-rich envelope (, Heber Heb86 (1986), Saffer et al. Saf94 (1994)). However, their origin is still unclear.
After passing the red-giant stage, these stars must have suffered from such a high mass loss rate that their outer layer was lost almost entirely. The remaining hydrogen-rich envelope has not enough mass to sustain a hydrogen-burning shell. This means that the star cannot ascend the asymptotic giant branch (AGB) after the end of the helium-core burning, but should evolve like a helium-main-sequence star (Heber et al. Heb84 (1984), Heber Heb86 (1986)). Calculations of Dorman, Rood & O’Connell (Dor93 (1993)) support this idea. The reason for very high mass loss at or shortly after the core helium flash is still unclear and several scenarios are discussed. As to the origin of sdB stars, a plausible hypothesis is close binary evolution (Mengel, Norris & Gross, Men76 (1976)). In addition to the composite spectrum binaries (Allard et al. All94 (1994), Theissen et al. The93 (1993),The95 (1995) and others) several single-lined binary sdB stars have been identified from variable Doppler line shifts resulting from orbital motion (Saffer, Livio & Yungelson Saf98 (1998), Maxted, Marsh & North Max00 (2000), Maxted et al. Max01 (2001), and Green, Liebert & Saffer Gre01 (2001)). At least two thirds of local disk sdB stars are found to be binaries.
SdB stars are important to understand galaxy evolution. They are the main cause for the UV excess, the so-called UV upturn, in elliptical galaxies and galaxy bulges (Brown et al. Bro97 (1997), Brown et al. 2000b ). The reason is that sdB stars spend a long life time ( years) on the EHB at high temperatures. They are also considered to be useful age indicators for elliptical galaxies (Brown et al. 2000a ).
| run # | date | instrument | recip. disp. | spectr. res. | wavelength coverage | observers |
|---|---|---|---|---|---|---|
| (start of nights) | [Å/mm] | [Å] | [Å] | |||
| 1 | 1989 Jan 21-25 | 3.5m B&C | 120 | 5.0 | 3850-5650 | Heber & Jordan |
| 2 | 1990 Jan 08-17 | 3.5m TWIN | 144/160 | 6.5 | 3550-5550,5570-7030 | Jordan & Möller |
| 3 | 1990 Oct 01-09 | 3.5m FR | 136 | 7.0 | 3770-5550 | Heber & Dreizler |
| 4 | 1990 Nov 04-11 | 3.5m TWIN | 144/160 | 5.5 | 3430-5550,5560-7030 | Jordan & Rauch |
| 5 | 1991 Jun 19-25 | 3.5m TWIN | 144/160 | 5.5 | 3570-5750,5110-9300 | Heber & Marten |
| 6 | 1992 Sep 10-14 | 3.5m TWIN | 144/160 | 4.5-5.5 | 3360-5550,5430-9740 | Dreizler |
| 7 | 1993 Mar 07-12 | 3.5m TWIN | 144/160 | 5.0 | 3470-5680,5420-9630 | Heber |
| 8 | 1993 Aug 28 - Sep 02 | 3.5m TWIN | 72/72 | 3.4 | 3600-5500,5540-7420 | Dreizler & Haas |
| 9 | 1993 Sep 02-05 | 2.2m CAS | 120 | 4.5-5.5 | 4010-6720 | Haas & Dreizler |
| 10 | 1994 Sep 21-25 | 3.5m TWIN | 72/72 | 3.5 | 3610-5490,5440-7320 | Dreizler |
| 11 | 1995 Jan 23-27 | 3.5m TWIN | 72/72 | 3.5 | 3580-5470,5420-7320 | Dreizler |
| 12 | 1996 Aug 16-19 | 3.5m TWIN | 72/72 | 3.6 | 3770-5660,5430-7340 | Lemke |
| 13 | 1997 Aug 28-31 | 3.5m TWIN | 72/72 | 3.5 | 3300-5450,5300-7550 | Edelmann |
| 14 | 1998 Sep 30 - Oct 04 | 2.2m CAFOS | 100 | 5.0-8.0 | 3400-6300 | Edelmann |
Subdwarf B stars are also very important in the context of stellar astrophysics. The discovery of several pulsating sdB stars (called sdBV or EC 14026 stars, after the prototype EC 140262647, Kilkenny et al. Kil97 (1997)) has rapidly increased the interest in these objects, because of the prospect of probing their structure by asteroseismology. The driving mechanism of the pulsation is due to an opacity bump associated with an iron ionization in the envelopes of sdB stars (Charpinet et al. Cha96 (1996), Cha97 (1997)). The prediction of Charpinet et al. (Cha97 (1997)) that sdB stars in the temperature range of should pulsate is very well confirmed by subsequent spectroscopical analyses of the EC 14026 stars (Heber, Reid & Werner Heb00 (2000), Østensen et al. 2000a , 2001b , Dreizler et al. Dre02 (2002), Silvotti et al. Sil02 (2002)). Now, 29 pulsating sdB stars are known (see O’Donoghue et al. ODo99 (1999) and Charpinet Cha01 (2001) for reviews).
For all these investigations, knowledge of the stellar parameters is very important. We present here the results of a spectral analysis of a large sample of subdwarf B stars selected from follow-up observations of candidates from the Hamburg Quasar Survey.
2 Programme stars
2.1 Preselection
Candidate stars were selected from the HQS objective prism plates, first by automatically selecting spectra which are blue compared to the bulk of spectra, and second, by visually classifying them on a graphics display (Hagen et al. Hag99 (1999)). Objects with UV excess emission were either classified directly as hot stars due to the presence of hydrogen Balmer absorption lines or were retained as quasar candidates. Follow-up observations of stellar candidates were mostly made from the hot stars list, and occasionally were of objects that were not confirmed as quasars.
2.2 Observations
The observations described here were obtained, starting in January 1989, at the DSAZ on Calar Alto, Spain, during various observing runs with different telescopes and instruments. The observational dataset is therefore very inhomogeneous. The spectral resolution ranges from 3.4Å to 8.0Å FWHM (determined from the FWHM of the helium-argon lines in the calibration spectra) and the wavelength coverage also varies between 4010–6720Å and 3360–9740Å. For three observing runs the seeing was sometimes better (smaller) than the slit width, resulting additionally in a varying spectral resolution during these runs. For a detailed overview of the observational material see Table 1.
2.3 Data reduction
The spectra were extracted from the two-dimensional frames and reduced to linear wavelength and intensity scales using the IDAS package written by G. Jonas in Kiel for the early observations (until 1991) and the ESO-MIDAS package for the data obtained after 1991.
All frames were bias subtracted, flat field corrected, and cosmic ray events were cleaned. The sky background was removed by extracting a stripe on each side of the star’s spectrum and subtracting the average of these two stripes from each row of the stellar signal on the CCD. These corrected rows were combined to a one dimensional stellar spectrum. Thereafter a wavelength calibration was performed with calibration spectra recorded immediately after each stellar spectrum. Then all wavelength-calibrated spectra were corrected for atmospheric extinction using the extinction coefficients of La Silla, Chile (Tüg Tug77 (1977)) as these coefficients are not available for the Calar Alto observatory. In the last step all spectra were relatively flux calibrated using spectra of flux-standard stars (mostly BD+28° 4211, G 191B2B or Feige 34, Oke Oke90 (1990)) which were taken each night.
A subset of spectra obtained is presented in Fig. 1. The object list is supplemented by one spectrum of a sdB star (HS 1641+4601) kindly provided by T. Rauch.
2.4 Selection and classification
From the list of stellar HQS follow-up observations, we selected here 111 subdwarf B candidates for a detailed analysis, using the classification system of Moehler et al. (1990b ): The optical spectra of subdwarf B stars are dominated by strong broad Balmer lines of neutral hydrogen and weak or absent He i lines. The so-called sdOB stars, introduced by Baschek & Norris (Bas75 (1975)), represent a hotter group of the sdB stars, that show in addition to strong broad Balmer and weak He i lines a weak He ii 4686Å absorption line in their spectra.
A closer inspection revealed 18 sdB stars of the sample to be spectroscopic binaries. All of them show at least two characteristics of a cool companion star (e.g. flat flux distribution, G-band absorption, Ca H+K, Mg i triplet at 5167Å, 5173Å, and 5184Å) (see Table 2). The spectral classifications for all programme stars are listed in Table 4.
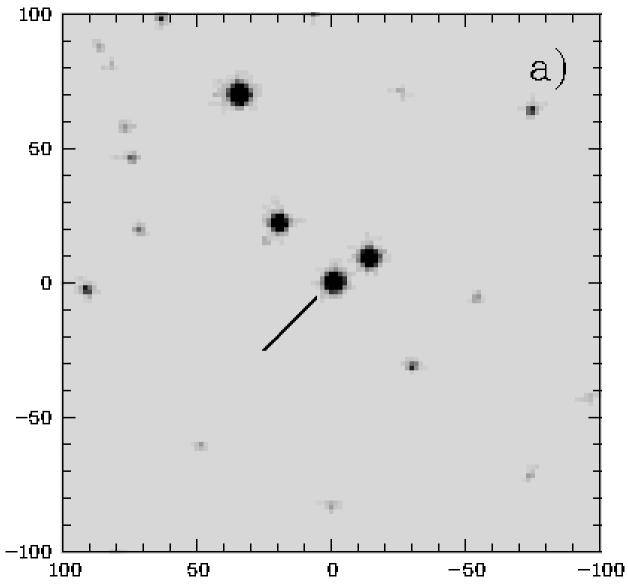
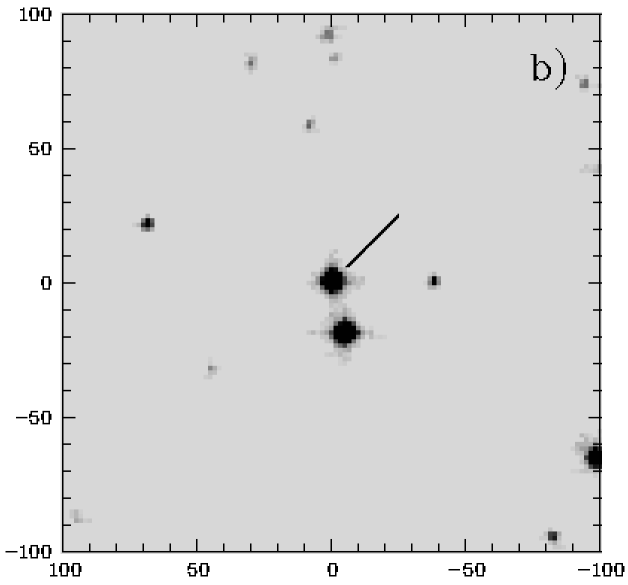
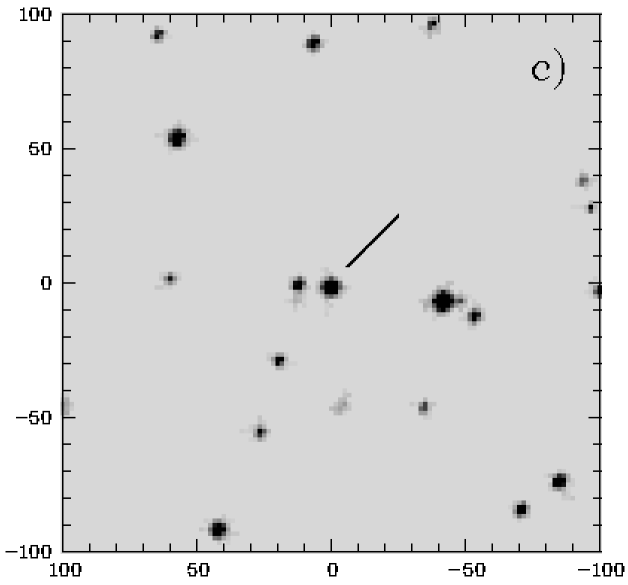
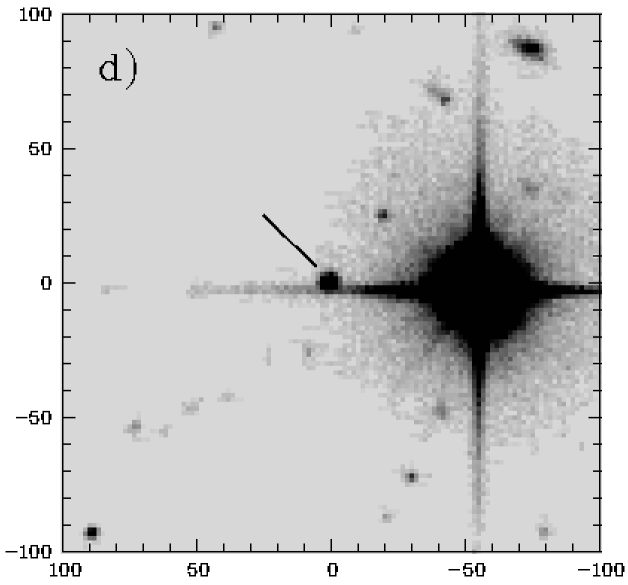
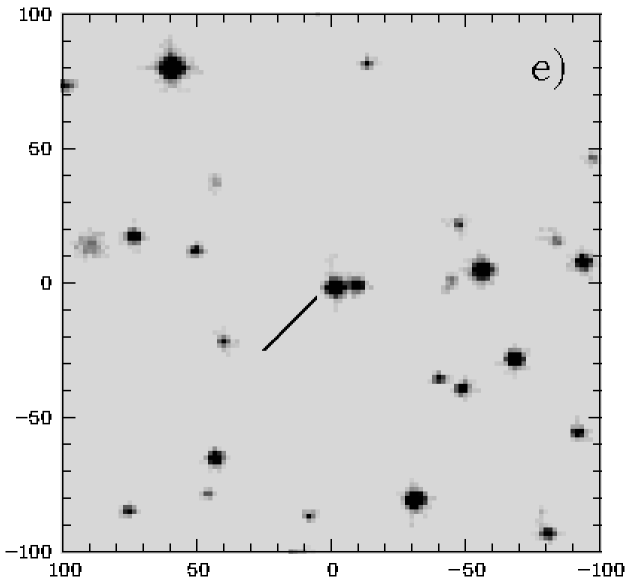
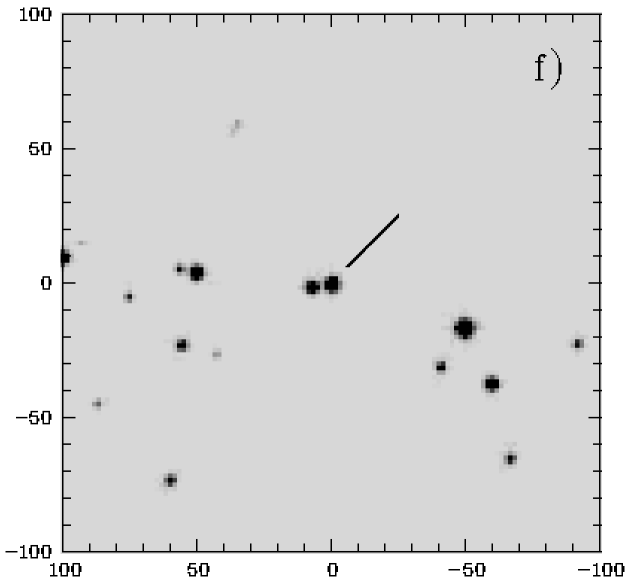
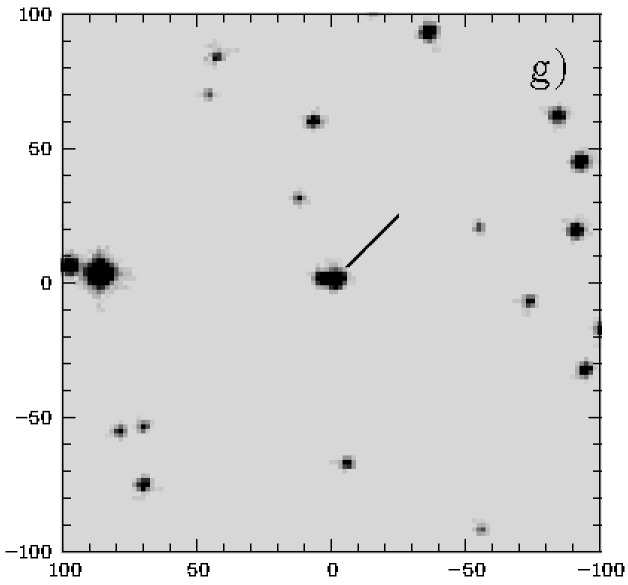
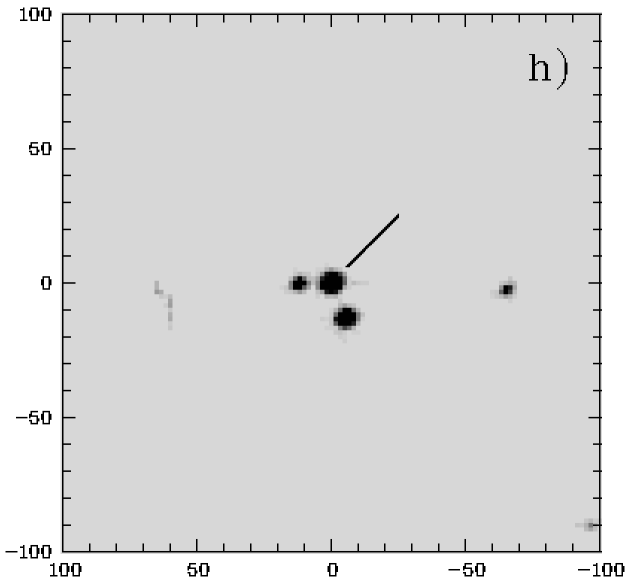
The coordinates were determined on HQS direct plates and are accurate to 2″. We checked the Digital Sky Survey for all stars and found that usually the object cannot be mistaken. Stars nearby were found in eight cases and for those we present finding charts in Fig. 9. The B-magnitudes presented in Table 4 were determined mostly from the objective prism plates and may have an error of up to 0.3 mag except when marked by a colon ( mag uncertainty).
Several stars have already been discovered as UV excess objects independently by various surveys. The references are indicated in Table 4.
| binary stars | Ca H+K | G-band | Mg i | flat flux |
|---|---|---|---|---|
| HS 0028+4407 | ||||
| HS 0127+3146 | - | - | ||
| HS 0136+0605 | - | - | ||
| HS 0215+0852 | - | |||
| HS 0252+1025 | - | |||
| HS 0446+1344 | - | |||
| HS 0656+6117 | - | - | ||
| HS 0942+4608 | ||||
| HS 1106+6051 | ||||
| HS 1511+6221 | - | |||
| HS 1612+6337 | ||||
| HS 1612+7335 | ||||
| HS 1615+6341 | - | |||
| HS 1753+5342 | ||||
| HS 1753+7025 | ||||
| HS 1844+5048 | - | - | ||
| HS 1858+5736 | - | |||
| HS 2216+1833 |
Although 45 of our programme stars can be found in other surveys, we found spectral classifications for only 21 of them in the literature. As can be seen in Table 3 there is a good agreement with previous classifications except for HS 2333+3927 which was previously classified as a DAZ white dwarf.
| star | this work | other | Ref. & name within |
|---|---|---|---|
| HS~0016+0044 | sdB | sdB | T94 |
| HS~0039+4302 | sdB | sdB | B91: Balloon~84041013 |
| HS~0048+0026 | sdOB | sdB | B91: Balloon~94700002 |
| sdOB | G86: PG~0048+004 | ||
| HS~0055+0138 | sdB | sdB | B91: Balloon~94700001 |
| sdB | P86: PG~0055+016 | ||
| HS~0209+0141 | sdB | sdB | G86: PG~0209+0141 |
| HS~0212+1446 | sdB | sdB | G86: PG~0212+148 |
| HS~0232+3155 | sdOB | sdB | W90: KUV~02324+3156 |
| HS~0941+4649 | sdB | sdB | M98: US~909 |
| HS~0942+4608 | binary | sdB+G | H89 |
| sdB | M98: PG~0942+461 | ||
| HS~1106+6051 | binary | sdB | G86: PG~1106+608 |
| HS~1236+4745 | sdB | sdB | S94: PG~1236+479 |
| HS~1511+6221 | binary | sdB+K5 | A94: PG~1511+624 |
| sdB | A96: FBS~1511+624 | ||
| HS~1547+6312 | sdB | sdB | A96: FBS~1547+632 |
| sdB | G84: PG~1547+632 | ||
| HS~1612+7335 | binary | sdB+K2.5 | A94: PG~1612+735 |
| HS~1641+4601 | sdB | sdB | B91: Balloon~83600002 |
| HS~2218+0201 | sdB | sdB | U98: PG~2218+020 |
| HS~2233+2332 | sdOB | sdB | B91: Balloon~90900003 |
| HS~2240+0136 | sdB | sdOB? | K84: PHL~384 |
| HS~2240+1031 | sdOB | sdB | G84: PG~2240+105 |
| HS~2246+0158 | sdB | sdB | G84: PG~2246+019 |
| HS~2333+3927 | sdOB | DAZ | A96: FBS~2333+395 |
Ref.: A94 = Allard et al. (All94 (1994)); A96 = Abrahamian & Mickaelian (Abr96 (1996)); B91 = Bixler, Bowyer & Laget (Bix91 (1991)); G86 = Green, Schmidt & Liebert (Gre86 (1986)); H89 = Heber, Jordan & Weidemann (HJW89 (1989)); K84 = Kilkenny (Kil84 (1984)); M98 = Mitchell (Mit98 (1998)); R93 = Rodgers, Roberts & Walker (Rod93 (1993)); S94 = Saffer et al. (Saf94 (1994)); T94 = Thejll, Theissen & Jimenez (Thej94 (1994)); W90 = Wegner, Steven & Swanson (Weg90 (1990)).
3 Atmospheric parameters

The stellar atmospheric parameters (effective temperature, surface gravity, and photospheric helium abundance) were determined by matching synthetic line profiles calculated from model atmospheres to all Balmer (mainly up to ) and helium (mainly He i 4026Å, 4471Å, 5015Å, 5876Å, and He ii 4686Å) line profiles present in the observed spectra of all programme stars.
3.1 Model atmospheres and synthetic spectra
Three different sets of models were used:
-
1.
A grid of metal-line blanketed LTE model atmospheres (Heber et al. Heb00 (2000)). The models are plane parallel and chemically homogeneous and consist of hydrogen, helium, and metals (solar abundances). The synthetic spectra were calculated with LINFOR111LINFOR was originally developed by H. Holweger, M. Steffen, and W. Steenbock at Kiel University. It has been enhanced and maintained by M. Lemke, with additional modifications by N. Przybilla. For a description see:
http://www.sternwarte.uni-erlangen.de/ai26/linfit/linfor.html.For the spectrum synthesis, line profiles were calculated for the Balmer series of neutral hydrogen ( up to 22) with Stark broadening tables of Lemke (1997b ) which uses the unified theory of Vidal et al. (Vid73 (1973)). Helium lines were calculated using broadening tables of Barnard, Cooper & Smith (BCS74 (1974)), Shamey (Sha69 (1969)), and Griem (Gri74 (1974)) for He i, and Schöning & Butler (Sch89 (1989)) for He ii. The metal line blanketing was included by the opacity distribution function (ATLAS6) of Kurucz (Kur79 (1979)). The grid covers the area for EHB Stars: K in steps of K to K; [cgs] in steps of ; .
-
2.
A grid of partially line blanketed NLTE model atmospheres (Napiwotzki Nap97 (1997)). The models are plane parallel, chemically homogeneous, and consist of hydrogen and helium. The latest version of the NLTE code from Werner (Wer86 (1986)) was used which is based on the Accelareted Lambda Iteration (ALI) of Werner & Husfeld (WHu85 (1985)). The following grid was used: K; in steps of ; .
-
3.
A grid of partially line blanketed NLTE model atmospheres for He-rich () objects. An extended and updated grid of Dreizler et al. (Dre90 (1990)), based on the ALI method, was used. The models are plane parallel and chemically homogeneous and consist of hydrogen and helium. The grid covers: K; in steps of ; .
3.2 Fit procedure
The matching of the observed spectra was done by means of a fit using an updated procedure of Bergeron et al. (Ber92 (1992)) and Saffer et al. (Saf94 (1994)) which determines simultaneously the atmospheric parameters. Beforehand all spectra were normalized and the model spectra were folded with the instrumental profile (Gaussian with appropriate width). Rotational broadening was neglected in the fitting procedure. Some fit examples are shown in Fig. 2.
The numbers of Balmer lines that can be used for the analysis may be limited by insufficient spectral coverage. Hence several stars are left with only three Balmer lines (see Fig. 2). In order to check whether the results depend on the number of Balmer lines included in the fit, we compared results based on many Balmer lines to those from three lines for stars with sufficient spectral coverage. No systematic differences became apparent.
The fit reproduces the Balmer lines well. For the hottest stars the He i/He ii ionisation equilibrium provides an additional temperature indicator. In most cases (e.g. HS 0546+8009, see Fig. 2) the fit of the He i and He ii lines is consistent with that of the Balmer lines. However, for sdOB stars showing a He ii 4686Å line which is comparable or stronger than the He i 4471Å line (i.e. for HS 0048+0026, HS 1051+2933, HS 1741+2133, HS 2156+2215, and HS 2333+3927), the helium ionisation equilibrium indicates a considerably higher effective temperature than from the Balmer lines. The most extreme case is HS 1741+2133 displayed in Fig. 2 (left panel). To match the He ii line an effective temperatute larger by K would be required. Such a discrepancy has also been observed in the analysis of high resolution spectra of the pulsating sdB star PG 1219+534 (Heber, Reid & Werner Heb00 (2000)). A detailed discussion is given in that paper. In the absence of an explanation for this helium line problem we adopt the parameters from the fit of all lines (H+He).
Our fit process, however, fails in the case of composite spectra. Without knowledge of the flux distributions of the cool companions it is impossible to extract the spectra of the sdB stars. To analyse these binaries, additional spectra and more sophisticated procedures are necessary (see e.g. Aznar Cuadrado & Jeffery Azn02 (2002)). We defer the analysis of the composites to a subsequent paper.
3.3 Results


Table 4 summarizes the results of our analysis including spectral types, effective temperatures, gravities, and helium abundances. Additionally, the equatorial and galactical coordinates, the magnitudes and extinctions, the radial velocities (see section 4.1), the absolute visual magnitudes, the distances from earth and from the galactic plane (see section 4.2), and the references are given for all programme stars. The values given with K represent mean results of our LTE and non-LTE fits. All values with K are exclusively from LTE, and all values with K are solely from non-LTE fits. Statistical errors for the atmospheres which are derived from the fit program are unrealistically small (typically: K, dex, dex). The systematic errors that arise from the observations (spectral resolution, S/N), and from the data reduction (flat-field correction, background subtraction, relative flux calibration, and continuum placement) are dominant. The real errors can only be estimated. Individual error estimates for the effective temperatures, the gravities, and helium abundances are given in Table 4. Four EHB programme stars which are observed twice at different dates with different instruments allow a selfconsistency check. As can be seen, the results match well within the given error limits. In these cases the mean results are plotted in Fig. 3.
The analysis shows that 89 (96%) of the 93 selected apparently single stars are bona fide sdB or sdOB stars. One (HS 2229+0910) is considered to be a blue horizontal branch (HBB) star, while three stars (HS 0231+8019, HS 1556+6032, and HS 2131+0349) have atmospheric parameters consistent with those of normal main sequence B stars. One of the sdOB stars (HS 1051+2933) is identified as unusually helium rich, i.e. exceeding the solar helium abundance. The results for all apparently single programme sdB stars are also shown in Fig. 3 in a ––diagram. For comparison we plot the results of the analyses of sdB stars by Saffer et al. (Saf94 (1994)) and Maxted et al. (Max01 (2001)) in Fig. 4. The further discussion is deferred to section 5.
3.4 Correlations of the helium abundance with stellar parameters?
In order to search for possible trends of the chemical composition with the atmospheric parameters we compare the derived helium abundances with the measured stellar parameters , , and with the luminosity222We express the luminosity in terms of the Eddington Luminosity (for electron scattering, see Eq. 1). for all apparently single EHB programme stars in Figs. 5, 6, and 7.


First of all, we discovered a clear correlation between the helium abundance and the effective temperature (): The larger the temperature, the larger the helium content (cf. Fig. 5). Furthermore, there seems to be a separation into two sequences of sdB stars in the – helium abundance plane. A fraction of our analysed sdB stars (about 1/6th, indicated with filled symbols) have much lower helium abundances at the same temperatures than the bulk of the sdB stars.
Fig. 6 may indicate a connection between the helium abundance and the gravity. However, for sdB stars the gravity is not independent of the effective temperature (see Eq. 1) since the horizontal branch is a sequence of nearly constant luminosity. The stars that seperate from the main bulk (filled circles) in Fig. 5 lie somewhat below the main bulk in Fig. 6 as well, but do not separate as clearly as in the former diagram.
The luminosity as derived from gravity and
| (1) |
is plotted in Fig. 7. No correlation is detectable. However, for the peculiar sdB stars (indicated with filled symbols) there is a slight tendency for a correlation to occur at higher luminosities.
To verify our discoveries, we have searched in the literature for other analyses which determined the atmospheric parameters using a method similar to ours. The results of Saffer et al. (Saf94 (1994), squares) who analysed 68 EHB stars and those of Maxted et al. (Max01 (2001), triangles) who analysed 36 EHB stars for atmospheric parameters are added to ours in Figs. 5 to 7. The correlation between the helium abundance and the effective temperature is confirmed. Furthermore, the suggested separation into two sequences (cf. Fig. 5) is reinforced.
A linear regression for the bulk of sdB stars (open symbols) gives:
| (2) |
For the other sequence (filled symbols, except the two upper limit values indicated by downward arrows) we get:
| (3) |
3.5 Comparison with previous results
Spectroscopic analyses are available in the literature only for five of our programme stars from three different groups (Moehler et al. 1990a , Bixler, Bowyer & Laget Bix91 (1991), and Saffer et al. Saf94 (1994)).
Different methods were applied to determine the stellar parameters: Two groups (Bixler, Bowyer & Laget Bix91 (1991) and Saffer et al. Saf94 (1994)) used a procedure similar to the one described here (fitting of model line profiles to optical spectra) to derive and . Saffer et al. included the determination of the helium abundance into their fit process, whereas Bixler et al. derived the helium abundance from equivalent width measurement of the He i 4471Å, 4922Å, and He ii 4686Å lines. Moehler et al. (1990a ) used a three-step-procedure: The effective temperature has been calculated first from colour indices. Keeping the temperature fixed, the surface gravity was obtained by visual comparison of model line profiles with optical spectra of one or more Balmer lines (mainly Hγ). Finally, the helium abundance was derived by measuring the equivalent width of the He i 4471Å line.
The sample of Bixler, Bowyer & Laget (Bix91 (1991)) overlaps with ours for three stars (HS~0039+4302, HS~1641+4601, and HS~2233+2332). However, the results given in Bixler, Bowyer & Laget (Bix91 (1991)) suffer from very large error limits (, dex) probably due to the low resolution and S/N of their spectra, which renders a comparison with our results useless.
One star (HS~0212+1446) overlaps with the sample of Moehler et al. (1990a ). The values differ considerably: the effective temperature determined by Moehler et al. (1990a ) is 5 000K lower and the gravity is 0.9dex lower than our results. Saffer et al. (Saf94 (1994)), who discovered similar differences comparing their results with that of Moehler et al. (1990a ), argue that the calibration of the Strömgren colours used by Moehler et al. (1990a ) is inappropriate for sdB stars and causes larger systematic errors. This view is supported by investigations of Napiwotzki, Schönberner & Wenske (Nap93 (1993)).
There remains only one sdB star of our sample that can be compared with the results of another group. Saffer et al. (Saf94 (1994)) determined the stellar parameters for HS~1236+4754 to be , and , which is in perfect agreement with our result: , and .
4 Radial velocities and distances
4.1 Radial velocities
In view of the large fraction of single lined binaries among the sdB stars (Maxted et al. Max01 (2001)) it is worthwhile to measure radial velocities (RVs) of our programme stars. The RVs are determined by calculating the shifts of the measured wavelengths of all fitted Balmer and helium lines relative to laboratory wavelengths. Afterwards they are corrected to heliocentric values. We decided to determine the RVs only for spectra with spectral resolutions equal to or better than 3.6Å, because the error margins for the spectra of lower resolution are too large to yield meaningful results.
The resulting values are accurate to about km/s and can be found in Table 4. Out of four stars which were observed twice at different dates, only one (HS 2333+3927) is found to be a RV variable. The resulting velocities for the other sdB stars, which are observed only once, are given in Table 4 for comparison with future RV measurements.
4.2 Distances
We calculated the distances for all sdB programme stars, assuming a canonical mass of 0.5 . From the derived gravities, the radii of the stars are calculated. By comparing the model atmosphere flux with the dereddened apparent visual magnitude333 The visual magnitudes are estimated from the magnitudes by adding the typical intrinsic colour of mag (Altmann, Edelmann & deBoer, in prep.). , the angular diameter of a star could be determined. Because several of the programme stars lie at relatively low galactic latitudes (20°30°), interstellar reddening can be significant, e.g. as high as for HS 0357+0133 (see Table 4). All stars lie at distances between 300pc and several kiloparsec from the galactic plane, therefore beyond the galactic dust layer. The reddening for all programme stars are estimated from the maps of Schlegel et al. (Schl98 (1998)). From radii and angular diameters, the distances of the stars follow immediately. The distance from the galactic plane is derived from the galactic latitudes: . The results are listed in Table 4.
Three programme stars are apparently normal B stars. Assuming that they are main sequence stars, we derive masses for HS~0231+8019, HS~1556+6032, and HS~2131+0349 of 5.5, 4.2, and 5.0, respectively, using the procedure of Ramspeck, Heber & Moehler (Ram01a (2001)). Using these masses we get distances (and ) of kpc (7kpc) for HS 0231+8019, kpc (11kpc) for HS 2131+0349, and kpc (19kpc) for HS 1556+6032. The z distances determined for HS 0231+8019 and HS 2131+0349 are not extraordinary in comparison to other known apparently normal B stars at high latitudes which are closer than about 10kpc from the galactic plane (Rolleston et al. Rol99 (1999), Ramspeck, Heber & Moehler Ram01a (2001)). However, HS 1556+6032 seems to be clearly farther away than other known apparently normal B stars in the halo of our Milky Way.
5 Discussion
In the gravity versus effective temperature plane (Fig. 3), our confirmed sdB and sdOB stars lie in a region close to the EHB, but with a tendency to cluster near the TAEHB when the He-core burning diminishes and the phase of helium shell burning starts. However, according to the evolutionary life times, most stars should be found closer to the ZAEHB, like seen in Heber (Heb86 (1986), Fig. 6), Saffer et al. (Saf94 (1994), Fig. 5), and Maxted et al. (Max01 (2001), Fig. 2). Comparing our results (Fig. 3) to that of Saffer et al. (Saf94 (1994)) and/or Maxted et al. (Max01 (2001)) (see Fig. 4), a systematic difference can be suggested. Saffer et al. (Saf94 (1994)) even found some sdB stars (mostly at low temperature, to K) to lie below the ZAEHB (cf. Fig. 4). Because only one star is common to in both studies (both sets of parameters agreed very well, see section 3.4), a direct comparison was possible for this case only.
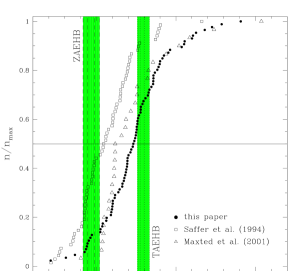
We can, however, compare the samples in a global sense using the cumulative luminosity functions. In Fig. 8 we plot these functions for our sample and those of Saffer et al. (Saf94 (1994)) and Maxted et al. (Max01 (2001)). The luminosity is expressed in units of the Eddington luminosity (Eq. 1). Additionally the positions of the ZAEHB and the TAEHB are indicated. Since the metallicity of the stars is unknown, we have plotted models for various metallicity ranging from [M/H]= to 0.00 (Dorman, Rood & O’Connell Dor93 (1993)). Note that the position of the TAEHB is model-dependent, because poorly understood processes such as semiconvection and convective instabilities (breathing pulses, Castellani et al. Cas85 (1985)) play a role. As can be seen from Fig. 8, the overall shape of the cumulative luminosity function is similar for all three samples when the considerable smaller number of stars in the Maxted et al. (Max01 (2001)) sample is taken into account. However, there is an offset of about 0.2 dex in luminosity between the Saffer et al. (Saf94 (1994)) sample and ours, whereas the relation for the Maxted et al. (Max01 (2001)) sample is in better agreement with ours. Possible reasons for the discrepancy are different observations, the different synthetic spectra used in the analysis, or both. Maxted et al. (Max01 (2001)) and our study is based on the same grid of NLTE models for stars hotter than K and metal line blanketed LTE models for the cooler ones, whereas Saffer et al. (Saf94 (1994)) use metal-free LTE models for all stars. The observations of Maxted et al. (Max01 (2001)) are of considerably higher spectral resolution than that of Saffer et al. (Saf94 (1994)) and ours and on average have a better S/N than our data. The wavelength coverage of the observations also varies. Differences in synthetic spectra calculated from different sets of model atmospheres have already been reported. Heber, Reid & Werner (Heb00 (2000)) studied the influence of NLTE effects versus metal line blanketing in LTE and found that NLTE models give luminosities larger by about 0.1 dex than metal line blanketed LTE models. Therefore about half of the observed offset between the cumulative luminosity functions of Saffer et al. (Saf94 (1994)) and ours can be traced back to NLTE effects, but an 0.1 dex offset remains unexplained. We have embarked on a more detailed investigation of this problem. It will be presented in a forthcoming paper.
Our analysis reveals an apparent correlation between the photospheric helium content and the stellar parameters of a sdB star: The larger the effective temperature and/or gravity, the larger the helium abundance. However, for sdB stars, and gravity are strongly connected and a plot of helium abundance versus luminosity does not reveal any correlations. There is general consensus that the low helium abundance of sdB stars is due to diffusion processes. Simple diffusion models assume the abundances to be set by the equilibrium of gravitational and radiative forces. Such models predict helium abundances far lower than observed (Fontaine & Chayer Fon97 (1997)). Weak radiation-driven stellar winds, however, are likely to be present. Calculations by Fontaine & Chayer (Fon97 (1997)) and Unglaub & Bues (Ung01 (2001)) indeed show that a better agreement of the predicted helium abundance with observations can be achived by considering mass loss rates of the order of /year. Radiation-driven wind theory predicts mass loss rates to increase with luminosity (Pauldrach et al. Pau88 (1988)). However, no such trend becomes apparent on our observations. Therefore, we conclude that other physical processes must be considered.
Additionally, a population of stars with very low helium abundances was identified when the helium abundance is plotted versus the effective temperature. These stars clearly seperate from the bulk (see Fig. 5). The separation of these stars is much less evident when we plot the helium abundance versus the gravity (Fig. 6) or the luminosity (Fig. 7). This phenomenon provides evidence that surface abundances of sdB stars are not a simple function of their position in the HR diagram. It rules out time-independent diffusion models and points to a dependence on the star’s history. Due to the discovery of Maxted et al (Max01 (2001)), that about 2/3rd of all sdB stars appear to be RV variable, it is very likely that many sdB stars in our sample are members of a close binary system with an unseen companion, like HS 2333+3927 already discovered. Aznar Cuadrado & Jeffery (Azn02 (2002)) suggest that short-period binaries may have a larger photospheric helium content than long-period binaries due to tidal effects disturbing the diffusive separation inside sdB stars (see above) in short-period systems more than in long-period systems. Therefore, the separation into two sequences of helium abundances possibly could be caused by their (yet undetected) binary nature.
6 Conclusions
We have presented the results of a spectral analysis of 111 sdB candidates selected from follow-up observations of the Hamburg Quasar Survey. The analysis reveals 89 stars to be bona fide subdwarf B and subdwarf OB stars. The remaining objects are 18 spectroscopic binaries containing a sdB component, one HBB, and three apparently normal B stars. Stellar parameters as well as radial velocities and distances have been determined. The results are largely consistent with the results from the literature by other groups, when NLTE effects are accounted for. To resolve the reason for the remaining differences, however, a detailed investigation of systematic errors caused by different observational material and by the use of different model atmospheres is required.
Additionally, there remain two open questions: What physical processes cause the discovered correlation of the helium abundance with the effective temperature? Why is there a separation into two sequences of sdB stars in the –helium abundance plane? To understand these phenomena, more observations and further calculations are urgently needed.
Last but not least, our spectral analysis was also the starting point of another investigation: The majority of our programme stars lie in a temperature range where non-radial pulsations have been predicted to occur (Charpinet et al. Cha96 (1996)) and have indeed been observed (Kilkenny et al. Kil97 (1997)). Therefore we initiated a collaboration with two groups in Norway and Italy in 1999 to search for pulsating sdB stars in our sample. All of our stars will be observed for light variations. Up to June 2002, about 70 HQS sdB stars had been observed and nine (HS 0039+4302, HS 0444+0408, HS 0702+6043, HS 0815+4243, HS 1824+5745, HS 2149+0847, HS 2151+0857, HS 2201+2610, and HS 2303+0152) were found to be pulsating (Østensen et al. 2000a , 2001b , Dreizler et al. Dre02 (2002), Silvotti et al. Sil02 (2002)). This represents about one pulsator in ten sdB stars. It also means that about one third of all known sdBV stars discovered so far have been drawn from our investigation presented here. The photometric monitoring also led to the discovery of a short period eclipsing binary of the HW Vir type (HS 0705+6700, Drechsel et al. Drec01 (2001)) which is only the third member of this class.
![[Uncaptioned image]](/html/astro-ph/0301602/assets/x9.png)
![[Uncaptioned image]](/html/astro-ph/0301602/assets/x10.png)
![[Uncaptioned image]](/html/astro-ph/0301602/assets/x11.png)
Acknowledgements.
Thanks go to all those colleagues who participated in the observing campaigns: S. Jordan, R. Möller, H. Marten, S. Haas, and also to the staff of the Calar Alto observatory, Spain, for their valuable assistance during our visits. Additionally we are grateful to T. Rauch for providing us with his spectrum. We thank Dr. C. S. Jeffery, the referee, for his valuable suggestions which helped to improve the paper. H.E. acknowledges financial support by the German research foundation DFG under grant He 1354/301 and for several travel grants to the Calar Alto observatory. The HQS was supported by DFG grants Re 353/11 and Re 353/22. This research has made use of the SIMBAD database, operated at CDS, Strasbourg, France.References
- (1) Abrahamian H. V., Lipovetsky V. A., Mickaelian A. M., Stepanian D. A., 1990, Afz 33, 345
- (2) Abrahamian H. V., Mickaelian A. M., 1996, Astrophysics 39, 315
- (3) Allard F., Wesemael F., Fontaine G., Bergeron P., Lamontagne R., 1994, AJ 107, 1565
- (4) Aznar Cuadrado R., Jeffery C. S., 2002, A&A 385, 131
- (5) Barnard A. J., Cooper J., Smith E. W., 1974, JQSRT 14, 1025
- (6) Baschek B., Norris J., 1975, ApJ 199, 694
- (7) Berger J., Fringant A. M., 1977, A&AS 28, 123
- (8) Bergeron P., Saffer R. A., Liebert J., 1992, ApJ 394, 228
- (9) Bixler J. V., Bowyer S., Laget M., 1991, A&A 250, 370
- (10) Brown T. M., Ferguson H. C., Davidsen A. F., Dorman, B., 1997, ApJ 482, 685
- (11) Brown T. M., Bowers C. W., Kimble R. A., 2000a, ApJ 529, L89
- (12) Brown T. M., Bowers C. W., Kimble R. A., Sweigart A. V., Ferguson H. C., 2000b ApJ 532, 308
- (13) Castellani V., Chieffi A., Tornambe A., Pulone L., 1985, ApJ 296, 204
- (14) Charpinet S., Fontaine G., Brassard P., Dorman B., 1996, ApJ 471, L103
- (15) Charpinet S., Fontaine G., Brassard P., Chayer P., Rogers F. J., Iglesias C. A., Dorman B., 1997, ApJ 483, L123
- (16) Charpinet S., 2001, Astron. Nachr. 322, 387
- (17) Dorman B., Rood R. T., O’Connell R. W., 1993, ApJ 419, 596
- (18) Drechsel H., Heber U., Napiwotzki R., Østensen R., Solheim J.-E., Johannessen F., Schuh S. L., Deetjen J., Zola S., 2001, A&A 379, 893
- (19) Dreizler S., Heber U., Werner K., Moehler S., de Boer K. S., 1990, A&A 235, 234
- (20) Dreizler S., Heber U., Jordan S., Engels D., 1994, Proc. of the IAU Colloq. 180, eds. Adelman S. J., Upgren A. R., Adelman C. J., Cambridge Univ. Press, ”Hot stars in the Galactic Halo”, 228
- (21) Dreizler S., Schuh S., Deetjen J. L., Edelmann H., Heber U., 2002, A&A 386, 249
- (22) Fontaine G., Chayer P., 1997, Conference on Faint Blue Stars, eds. A. G. D. Philip, J. Liebert, R. Saffer and D. S. Hayes, Published by L. Davis Press, 169
- (23) Green E. M., Liebert J., Saffer R. A., 2001,
- (24) Green R. F., Schmidt M., Liebert J., 1986, ApJS 61, 305 Proc. of the 12th European Workshop on White Dwarfs, eds. J. L. Provencal, H. L. Shipman, J. MacDonald & S. Goodchild, ASP Conf. Series 226, 192
- (25) Griem H. R., 1974, Spectral line broadening by plasmas, Pure and Applied Physics, Academic Press, New York
- (26) Hagen H.-J., Groote D., Engels D., Reimers D., 1995, A&AS 111, 195
- (27) Hagen H.-J., Engels D., Reimers D., 1999, A&AS 134, 483
- (28) Haro G., Luyten W. J., 1962 Bol. Inst. Tonantzintla 3, 37
- (29) Heber U., Hunger K., Jonas G., Kudritzki R. P., 1984, A&A 130, 119
- (30) Heber U. 1986, A&A 155, 33
- (31) Heber U., Jordan S., Weidemann V., 1989, Proc. of the Astron. Gesellschaft, Abstract Ser., 3, 94
- (32) Heber U., Jordan S., Weidemann V., 1991, Proc. of the 7th European Workshop on White Dwarfs, eds. G. Vauclair and E. Sion., NATO Advanced Science Institutes (ASI) Series C, 336, 109
- (33) Heber U., Dreizler S., Hagen H.-J., 1996, A&A 311, L17
- (34) Heber U., Reid I. N., Werner K., 2000, A&A 363, 198
- (35) Homeier D., Koester D., Hagen H.-J., Jordan S., Heber U., Engels D., Reimers D., Dreizler S., 1999b, A&A 338, 563
- (36) Homeier D., Koester D., Jordan S., Hagen H.-J., Engels D., Heber U., Dreizler S., 1999, Proc. of the 11th European Workshop on White Dwarfs, eds. J.-E. Solheim & E. G. Meis̆tas, ASP Conf. Series 169, 37
- (37) Humason M. L., Zwicky F., 1947, ApJ 105, 85
- (38) Iriarte B., Chavira E., 1957, Bol. Obs. Tonantz. Tacub., 2, part no 16, 3
- (39) Kilkenny D., 1984, MNRAS 211, 969
- (40) Kilkenny D., Koen C., O’Donoghue D., Stobie R. S., 1997, MNRAS 285, 640
- (41) Kurucz R. L., 1979, ApJS 40, 1
- (42) Lemke M., Heber U., Napiwotzki R., Dreizler S., Engels D., 1997a, Proc. of the 3rd Conference on Faint Blue Stars, eds. A. G. D. Philip, J. Liebert, R. Saffer and D. S. Hayes, Published by L. Davis Press, 375
- (43) Lemke M., 1997b, A&AS 122,285
- (44) Markarian B. E., Stepanian J. A., 1983, Afz 19, 639
- (45) Maxted P. F. L., Marsh T. R., North R. C., 2000, MNRAS 317, L41
- (46) Maxted P. F. L., Heber U., Marsh T. R., North R. C., 2001 MNRAS 326, 1391
- (47) Mengel J. G., Norris, J., Gross P. G., 1976, ApJ 204, 488
- (48) Mitchell K. J., 1998, ApJ 494, 256
- (49) Moehler S., de Boer K. S., Heber U., 1990a, A&A 239, 265
- (50) Moehler S., Richtler T., de Boer K. S., Dettmar R. J., Heber U, 1990b, A&AS 86, 53
- (51) Napiwotzki R., Schönberner D., Wenske V., 1993, A&A 268, 653
- (52) Napiwotzki R., 1997, A&A 322, 256
- (53) Noguchi T., Maehara H., Kondo M., 1980, Tokyo, University, Tokyo Astronomical Observatory, Annals, Second Series, vol. 18, no. 1, 55
- (54) O’Donoghue D., Koen C., Kilkenny D., Stobie R. S., 1999, Proc. of the 11th European Workshop on White Dwarfs, eds. J.-E. Solheim & E. G. Meis̆tas, ASP Conf. Series 169, 149
- (55) Oke J. B., 1990 AJ 99, 1621
- (56) Østensen R., Solheim J.-E., Heber U., Silvotti R., Dreizler S., Edelmann H., 2001a, A&A 368, 175
- (57) Østensen R., Heber U., Silvotti R., Solheim J.-E., Dreizler S., Edelmann H., 2001b, A&A 378, 466
- (58) Paczyński B., 1971, Acta Astron. 21, 1
- (59) Pesch P., Sanduleak N., 1983, ApJS 51, 171
- (60) Pauldrach A., Puls J., Kudritzki R. P., Mendez R. H., Heap S. R., 1988, A&A 207, 123
- (61) Pickering E. C., Kapteyn J. C., 1918, Ann. Astron. Obs. Harvard Coll. 101
- (62) Ramspeck M., Heber U., Moehler S., 2001, A&A 378, 907
- (63) Rodgers A. W., Roberts W. H., Walker, I., 1993, AJ 106, 591
- (64) Rolleston W. R. J., Hambly N. C., Keenan F. P., Dufton P. L., Saffer R. A., 1999, A&A 347, 69
- (65) Saffer R. A., Bergeron P., Koester D., Liebert J. 1994, ApJ 432, 351
- (66) Saffer R. A., Livio M., Yungelson L. R., 1998, ApJ 502, 394
- (67) Schlegel D. J., Finkbeiner D. P., Davis M., 1998, ApJ 500, 525
- (68) Schöning T., Butler K., 1989, A&AS 78, 51
- (69) Shamey Louis J., 1969, PhD thesis, Loyola Univerity of Los Angeles
- (70) Silvotti R., Østensen R., Heber U., Solheim J.-E., Dreizler S., Altmann M., 2002, A&A 383, 239
- (71) Theissen A., Moehler S., Heber U., de Boer K. S., 1993, A&A 273, 524
- (72) Theissen A., Moehler S., Heber U., Schmidt J. H. K., de Boer K. S, 1995, A&A 298, 577
- (73) Thejll P., Theissen A., Jimenez R., 1994 A&A 292, 457
- (74) Tüg H., 1977, ESO Messenger 11, 7
- (75) Unglaub K., Bues I., 2001, A&A 374, 570
- (76) Usher P. D., 1981, ApJS 46, 117
- (77) Vidal C. R., Cooper J., Smith E. W., 1973, ApJS 25, 37
- (78) Wegner G., Swanson S. R., 1990, AJ 100, 1274
- (79) Werner K., Husfeld D., 1985, A&A 148, 417
- (80) Werner K., 1986, A&A 161, 177