High Redshift X-Ray Selected Quasars:
CXOCY J125304.0-090737
joins the club11affiliation: Partly based on observations collected at the
European Southern Observatory, Chile, under program 68.A-0459
Abstract
We present a new X-ray selected high redshift quasar CXOCY J125304.0-090737 at , discovered by the Calán-Yale Deep Extragalactic Research (CYDER) Survey. This quasar is the fifth X-ray selected high redshift radio quiet quasar () found so far. Here, we present its observed properties which are characterized by its relative optical and X-ray faintness, its X-ray hardness and its X-ray strength compared to optically selected quasars at high redshift.
We also compare the X-ray selected high redshift radio quiet quasars to their optically selected counterparts. We find that the optical to X-ray spectral slope, , is statistically harder (more X-ray luminous) for the X-ray selected radio quiet quasars than for the optically selected ones. This result, given the different range of rest frame ultraviolet luminosities studied and the selection of the samples, is consistent with the previously found correlation between X-ray and rest frame ultraviolet luminosities and would extend that result to a much wider luminosity range at high redshift. Finally, we discuss the prospects of unveiling the quasar luminosity function at high redshifts using X-ray surveys. The discovery of a high redshift object in the first field of our survey program provides suggestive evidence that X-ray selected surveys may identify more such objects than would be expected from an extrapolation of the optical luminosity function.
1 Introduction
The formation of the first structures in the Universe is one of the most interesting subjects in today’s astronomy. Because quasars are intrinsically very luminous, they can be observed up to very high redshift and can therefore probe early epochs in the universe. Recent observations have found considerable numbers of quasars at high redshift (Anderson et al., 2001; Schneider et al., 2002), with some quasars being at redshifts (Fan et al., 2001b), when the Universe was less than one Gyr old.
The earliest quasar surveys were performed in the radio (e.g., Edge et al. 1959; Bennett 1962; Schmidt 1963) and the optical (e.g., Sandage 1965). While radio surveys have continued (e.g., White et al. 2000), in recent years, greater attention has been placed on optical and X-ray surveys. Optical surveys are efficient finding quasars as they can search large areas of the sky in reasonable amounts of time. At high redshift (in this paper meaning redshifts ), the Sloan Digital Sky Survey (SDSS; York et al. 2000) has been very successful identifying quasars and now there are more than 100 SDSS high-redshift quasars known (Anderson et al., 2001). However, most of those quasars have been selected based on their color properties and therefore may be biased against quasars with different photometric properties like heavily obscured ones. Recent studies suggest that this bias may not be too problematic though (Richards et al., 2003).
The other main quasar selection technique is X-ray detection as X-ray emission appears to be a universal characteristic of quasars at all observed redshifts (Kaspi et al., 2000). However, given the relative faintness of the majority of the sources, X-ray surveys need to rely on optical spectroscopy for most of the identifications. The lack of spatial resolution of past X-ray missions made these efforts laborious so far. However, the Chandra X-ray satellite with its superb angular resolution has made the optical identification process much more efficient. The nature of the X-ray emission also ensures that the optical selection biases due to obscuration are strongly reduced (although the X-ray selection may introduce biases of its own). This is especially true at high redshift where the observed X-ray photons were emitted at higher energies and can penetrate even considerably large amounts of obscuring material.
At high redshifts (), there are only five quasars known selected by their X-ray emission. Three of them were found with the ROSAT satellite (Henry et al., 1994; Zickgraf et al., 1997; Schneider et al., 1998). The other two were detected by Chandra (Silverman et al., 2002; Barger et al., 2002). All of them are radio quiet except one (Zickgraf et al., 1997). There is another active galactic nucleus detected at in the Chandra Deep Field North (Barger et al., 2002). However, this source is optically faint, , and therefore it is hard to estimate the contribution of the active nucleus itself and its putative host galaxy to the observed optical luminosity. We therefore exclude this object from further discussions. There is also an optically faint radio loud active galactic nucleus at in the Chandra Deep Field North (Brandt et al., 2001; Vignali et al., 2002c), but this object was selected in the radio. In total there are 56 active galactic nuclei111Here, AGN are defined in a broad sense including quasars and active galaxies detected in X-rays at ,222See the excellent web page http://www.astro.psu.edu/users/niel/papers/highz-xray-detected.dat maintained by Niel Brandt and Christian Vignali for a list of the high redshift AGN detected in X-rays so far. seven of which are radio-loud quasars, two of which are low-luminosity AGN (one of these is radio-loud) and twelve of which have not appeared in the literature so far. The remaining 36 sources are radio-quiet quasars and will be the sample we will discuss in this paper. Thirty-two were optically selected and four X-ray selected. Twenty-six were detected by Chandra, nine by ROSAT and one by XMM-Newton. These 36 sources have typical absorption corrected X-ray fluxes between and erg cm-2 s-1 in the 0.5-2.0 keV band. The absolute magnitudes of the optically selected quasars range from to while the X-ray selected quasars range from to . Thus, the high redshift X-ray selected quasars sample a different range of the optical luminosity function than the optical selected ones.333Whenever we talk about optical magnitudes or luminosities we do it in a broad sense including optical and ultraviolet. The magnitudes in the observed frame are measured in the optical, however they correspond to rest frame ultraviolet absolute magnitudes or luminosities.
There have been several studies of high redshift optically selected quasars detected in X-rays (e.g., Kaspi et al. 2000; Vignali et al. 2001; Brandt et al. 2002a, b; Bechtold et al. 2002; Vignali et al. 2002b, c). The overall properties of the high redshift population are similar to the low redshift quasars (Kaspi et al., 2000; Vignali et al., 2002b). The X-ray spectral slope appears to be similar at low and high redshift (e.g., Vignali et al. 2002a, b), although in some high redshift cases it is harder (Bechtold et al., 2002). The optical-to-X-ray spectral index, , nonetheless, appears to be steeper (optically stronger and/or X-ray weaker) at high redshift than locally (Vignali et al., 2001; Bechtold et al., 2002), although this trend may only be a result of the possible correlation of the optical-to-X-ray spectral index with optical luminosity. Vignali et al. (2002d), studying a sample of SDSS Early Data Release quasars, find that is correlated with rest-frame ultraviolet (UV) luminosity but does not depend significantly on redshift. They also find a correlation (with a slope different than unity) between X-ray and rest frame UV luminosities (see also references therein).
Here we present the discovery of CXOCY J125304.0-090737, a quasar selected in X-rays from Chandra archival images. Optical follow-up images were taken with the CTIO/4-meter telescope and the confirming optical spectrum was obtained with FORS2 on VLT. These observations were taken as part of the Calán-Yale Deep Extragalactic Research (CYDER) Survey (Castander et al., 2003; Treister & Castander, 2003). The CYDER survey is a deep optical and near-infrared imaging and spectroscopic program encompassing several scientific goals. One of the key aims is the characterization of the population of faint X-ray sources. Therefore, some of the fields of the CYDER survey were selected to overlap with deep Chandra pointings.
In §2 we describe the X-ray, optical and near-infrared observations that lead to the discovery of CXOCY J125304.0-090737, presenting the data reduction procedures followed. In §3 we discuss the observed characteristics of CXOCY J125304.0-090737 and compare them to those of the high redshift population of radio quiet quasars. We also discuss the differences between the X-ray and optically selected high redshift QSOs. Finally we present our conclusions in §4.
Throughout, we assume km s-1 Mpc-1, and . We define the photon index as the exponent giving a photon flux density X-ray spectrum in photons cm-2 s-1 keV-1.
2 Observations and Data Analysis
2.1 X-ray Data
The first X-ray field studied by the CYDER survey in the Southern Hemisphere was the Chandra pointing towards the Hickson group of galaxies HCG62 centered on (J2000) (PI: Vrtilek). This field was observed on January 25, 2000 with the ACIS-S detector configuration for a total 49.15 ks. We retrieved this image from the archive and analyzed it using standard techniques with the CIAO package.
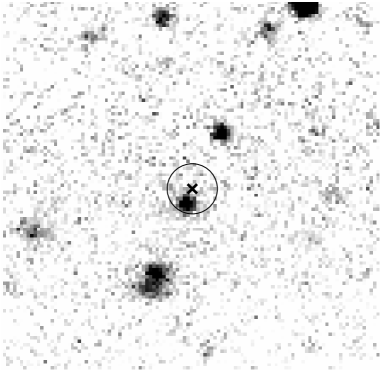
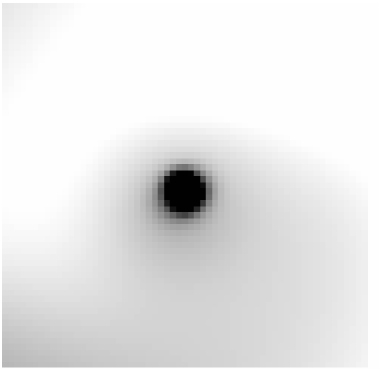
We remove bad columns and pixels using the guidelines specified on the ACIS Recipes,444See Clean the Data at http://www.astro.psu.edu/xray/acis/recipes/clean.html, and we remove flaring pixels using the FLAGFLARE routine. We use the full set of standard event grades (0,2,3,4,6) and create two images, one from 0.5 to 2.0 keV and one from 2.0 to 8.0 keV. We then use the WAVDETECT routine from the CIAO package to identify the point sources within these images, checking all wavelet scales from 1 to 16 separated by factors of 2. We detect 30 sources from 0.5-2.0 keV and 19 from 2.0-8.0 keV (with 15 detected in both bands, so that a total of 34 sources are detected) in the S3 ACIS CCD. We then use the PSEXTRACT script to extract spectra for these sources and provide a response matrix. CXOCY J125304.0-090737 was detected in both bands. Figure 2 shows a 30”30” cutout region centered on CXOCY J125304.0-090737 of the total (0.5-8.0 keV) band adaptively smoothed X-ray image. The total number of background subtracted photons detected were in the soft [0.5-2.0] keV band and in the hard [2.0-8.0] keV band. This analysis will focus on CXOCY J125304.0-090737; the sample as a whole will be discussed in a future work.
We then fit the spectrum for CXOCY J125304.0-090737 in XSPEC 11.0 with a power law model. We find a best fitting photon power law index of with no absorption and of ( errors for the spectral indices) when the Galactic neutral hydrogen column of (as calculated using the HEASARC nH tool) is accounted for. These fits are done with three spectral channels from 0.5 to 8.0 keV, which all suffer from statistics too poor for conventional fitting and the resulting values of are close to zero, indicating that the bins have too few photons. Still the same results are obtained when either the C statistic or the statistic are used, so they can be considered as robust as any spectral fits based on less than 30 photons. The 0.5-8.0 keV Galactic absorption corrected observed flux is ergs/sec/cm2 with either model. Figure 1 shows the observed cumulative energy distribution.

2.2 Optical and Near-Infrared Imaging Data
As part of the CYDER survey we obtained V and I images of this field with the CTIO 4m MOSAIC-II camera. The total integration time was 80 minutes in V and 25 minutes in I under 1.1” seeing conditions. Images were reduced using standard techniques with the IRAF/MSCRED package.555IRAF is distributed by the National Optical Astronomy Observatory, which is operated by the Association of Universities for Research in Astronomy, Inc., under cooperative agreement with the National Science Foundation. We search for optical counterparts of our X-ray detections in the resulting images. The source matching is relative simple given the good spatial resolution of Chandra. Using the brightest nine point sources in the optical we find an overall offset between the X-rays and the optical (tied to the USNO reference frame) of and (see Castander et al, in preparation for further details). There is only one detectable optical counterpart within the error circle of the X-ray source CXOCY J125304.0-090737 down to our magnitude limit ( and at 5). The offset between the X-ray and optical centroids are 1.3”. For this object we performed PSF fitting photometry measuring and . Image cut-outs of this object are shown in Fig 2.
Near-infrared data for this field was obtained at LCO using the DuPont 2.5m telescope with the Wide Field InfraRed Camera. The total integration time was 62 minutes in the band and 60 minutes in the band, with seeing of 0.7” and 0.6” respectively. We reduced the data with the IRAF DIMSUM package following standard procedures. We barely detect the optical counterpart in the band image at a magnitude of but we do not detect it in the image which reached a magnitude limit of (5).
2.3 Optical Spectroscopy
Follow up spectroscopy of this field was obtained at the ESO Cerro Paranal Observatory with the UT4/Yepun telescope using the FORS2/MXU instrument on the 14th February 2002. Three masks were design for the HCG62 field, one of which included a slit for the CXOCY J125304.0-090737 optical counterpart. We took three exposures with this mask for a total integration time of 1 hour 55 minutes in 0.9” seeing conditions. We used the V300 grism giving a resolution of (10.5 Å) for our 1” slit. The spectrum was reduced using standard techniques with IRAF and calibrated in wavelength using He-Ar comparison lamps exposures and the night sky lines. We also obtained spectra of the spectrophotometric standards Feige67 and LTT6248, which were used to provide a rough flux calibration of the spectrum.
Figure 3 shows the final spectrum together with the mean spectrum of quasars at found in the SDSS. The typical broad emission lines of a quasar are clearly distinguishable and marked in the figure. We measure a mean redshift of using all the emission lines but Lyman and NV.

3 Discussion
Table 1 presents the observed properties of CXOCY J125304.0-090737. In the optical, CXOCY J125304.0-090737 is a faint quasar with an absolute magnitude, and . At this absolute magnitude, one would expect that most of the observed flux is coming from the QSO itself with little contribution from its host galaxy, which is not resolved in our optical images. Its spectrum is typical of a quasar with broad emission lines (Figure 3). We measure a velocity width of km/s using the CIV emission line, which is lower than the one measured in the SDSS composite QSO spectrum ( km/s). On the other hand, the CIV rest-frame equivalent width ( Å) is larger than the SDSS QSO composite spectrum ( Å) as expected from the Baldwin effect, an anti-correlation between 1450 Å luminosity and CIV EW (Baldwin et al., 1977). The spectrum also presents a strong absorption feature between the Ly and NV emission lines. This feature is at approximately the same wavelength as the [OI] 6364 Å sky line and therefore its real strength is difficult to estimate. We are nevertheless confident that the absorption is real and not an artifact of the sky subtraction. We interpret this absorption line as intrinsic absorption of NV. It is approximately at 3000 km/s blue-ward of the emission line. Although the spectrum is noisy, one may tentatively argue that there are also absorption lines blue-ward of CIV and OVI at approximately the same velocity offset. If this were correct, that would imply the existence of material that could obscure the QSO. Another interpretation would be that the Ly emission line is narrow and that we are seeing the trough between emission lines. Although the wide red tail of NV would disfavor this hypothesis. The Ly flux deficit, , is a measure of the absorbed flux blue-ward of Ly (Oke & Korycansky, 1982; Schneider et al., 1991).We obtain a value of for CXOCY J125304.0-090737, which is typical of quasars at this redshift (e.g., Madau 1995). Our measurement is only approximate due to the difficulty of fitting the continuum red-ward of Ly in our poor signal-to-noise spectrum, which translates into a large uncertainty in the extrapolation of the continuum blue-wards to compute .
Using our photometry, we measure a color for CXOCY J125304.0-090737. This value is slightly bluer than the expected color obtained redshifting the SDSS composite spectrum (Vanden Berk et al., 2001) and convolving the spectrum with the filter responses. The similarity between these values argues against large amounts of intrinsic reddening (and thus optical extinction) in CXOCY J125304.0-090737. However, this argument is only qualitative and does not exclude small amounts of extinction. Overall, considering the possible relatively weak intrinsic absorption lines in our spectrum of CXOCY J125304.0-090737 and its not very red photometric properties, we conclude that there may be small amounts of extinction in CXOCY J125304.0-090737.
In X-rays, CXOCY J125304.0-090737 is also a faint QSO. The number of detected photon is low, in the soft [0.5-2.0] keV band and in the hard [2.0-8.0] keV band, and therefore fitting a power-law spectrum to the observed counts is difficult (see Figure 1). Nevertheless, the best photon index slope is , which is harder than the average radio-quiet QSO X-ray spectrum at low redshift (Yuan et al., 1998; George et al., 2000; Mineo et al., 2000; Reeves & Turner, 2000) (although part of the difference may be due to selection biases) and similar to the value of the X-ray background spectrum, (e.g., Gendreau et al. 1995; Gilli et al. 2001). We have used this value () to convert from observed count rate to X-ray flux. We measure an extinction corrected X-ray flux of erg cm-2 s-1 in the observed frame [0.5-8.0] keV band. This QSO is therefore the second faintest X-ray selected quasar detected so far (see Figure 4) and the fourth X-ray faintest high redshift quasar overall.
For spectra with low number of counts it is customary to characterize the spectral shape with the hardness ratio , where are the counts measured in a soft band and are the counts in a hard band. The measured hardness ratio for CXOCY J125304.0-090737 is , defining the soft and hard X-ray bands as 0.5-2.0 keV and 2.0-8.0 keV respectively. Although not many high redshift quasars have measured hardness ratios in the literature, the ones measured are typically softer than ours. That is their HR are lower and their ’s are higher. Vignali et al. (2002b) measure a typical value of compared to our , emphasizing the relative hardness of CXOCY J125304.0-090737 compared to other optically selected high redshift QSOs.
At redshifts , the observed Chandra band 0.5-8.0 keV corresponds to a rest frame band of 2.5-40 keV or higher. Any process changing the observed spectral slope is thus occurring at intrinsic higher energies than observed. Strong intrinsic absorption can certainly harden an observed X-ray spectrum. At redshift , Hydrogen column densities of are needed to produce noticeable spectral changes. In the case of CXOCY J125304.0-090737 neither the X-ray spectrum (Fig 1) nor the optical one (Fig 3) show any signs of such amounts of absorption. Processes, such as Compton reflection (e.g., Guilbert & Rees 1988) which cause deviations from a power law spectrum at high energies may therefore be important for understanding the X-ray spectral properties of high redshift quasars with hard spectra. The most prominent such features are iron emission lines, typically seen at 6.4 keV (from a neutral accretion disk) or 6.7 keV (from an ionized disk), iron absorption edges seen between 7.0 and 9.0 keV (with the energy again depending on the level of ionization in the disk), and a broad bump typically between 30 and 50 keV due to the Compton down-scattering of the hight energy photons. For typical parameters, the spectrum of a z=4.19 quasar can be hardened by 0.10-0.15 in with respect to the underlying power law by the reflection component. The effects of reflection components on the X-ray background have been studied in more detail in past work (e.g., Fabian et al. 1990; Zdziarski et al. 1993).

In order to compare the optical and X-ray emission we compute the effective optical-to-X-ray power law spectral slope, , defined as
| (1) |
where is the flux density and is the frequency of the given wavelength or energy. Neither flux density is measured at the given energy and wavelength and extrapolations are needed to compute this quantity. For CXOCY J125304.0-090737 we compute taking into account the error in the measured quantities and the errors in the extrapolations.

We have also computed for all high redshift quasars () with measured optical magnitudes and observed-frame 0.5-2.0 keV X-ray fluxes available in the literature. Figure 5 plots against the optical magnitude . The values of the X-ray selected QSOs are shallower (X-ray stronger and/or optically fainter) than the optically selected ones. A Kolmogorov-Smirnov (KS) test indicates that the probability of both distribution being drawn from the same parent distribution is less than 0.05%. The distribution of optical absolute magnitudes (or luminosities) is also statistically different in the X-ray and optically selected samples because the X-ray surveys are more sensitive but cover a much smaller area than the optical ones (see Figures 4 and 6). In order to understand the difference in the values, we plot the X-ray against the rest frame UV luminosity densities in Figure 6. We find that both observables are correlated with a functional form , shown as a dashed line in Figure 6. This slope is somewhat shallower than that found by Vignali et al. (2002d). But taking into account that the faint UV luminosity points, driving a shallower slope, are X-ray selected and assuming that the distribution of X-ray luminosities are the same at faint UV rest frame luminosities than at bright UV luminosities, our data are consistent with the correlation found by Vignali et al. (2002d), thus extending their result to fainter luminosities at high redshift with a larger sample.

CXOCY J125304.0-090737 was discovered in the first Chandra X-ray Southern field studied within the CYDER survey. One can ask how many high redshift QSOs one would expect to detect given the QSO luminosity function. We use Fan et al. (2001a) QSO optical luminosity function (LF), which is consistent with previous estimates (e.g., Kennefick et al. 1995; Schmidt et al. 1995). They compute the optically selected QSO LF in the range and . The optical absolute magnitude of CXOCY J125304.0-090737 is considerably fainter. If we extrapolate Fan et al’s power law LF down to the magnitudes reached by our search, the expected number of quasars in the ACIS-S S3 CCD with is 0.22. The probability of finding any quasars (one or more) is then 20%. If instead we extrapolate Fan et al’s LF to fainter luminosities using the shape of the optical QSO LF at lower redshifts (Boyle et al., 2000), the expected number of QSOs is even lower. Although, with just one detection these numbers are not significant, they are nevertheless indicative that the faint end slope of the QSO optical LF may be high (at least higher than at low redshift) or that optical surveys miss significant fractions of QSOs that may be obscured. In the case of CXOCY J125304.0-090737 is worth pointing out that its colors are typical of low redshift quasars and therefore a multi-wavelength optical survey reaching this magnitude limit should have been able to pick it up.
The number of expected quasars can also be computed from the X-ray luminosity function (XLF). Unfortunately, the XLF is poorly determined above , given the lack of X-ray selected QSOs at these redshifts. Compiling several X-ray surveys, Miyaji et al. (2001) derive an XLF up to , although at their highest redshift their XLF is only valid at the bright end. If we extrapolate their power-law parameterization of their last redshift bin () to the faint end and also assume that the XLF is the same beyond , then we would expect to detect 0.72 quasars at the X-ray flux limit reached in our first CYDER field. If we instead extrapolate Miyaji et al’s XLF with a smooth double power-law to the faint end similar to the one at lower redshifts and also extrapolate this function to higher redshift with a plausible evolutionary model (see Castander et al. in preparation for details), we obtain somewhat lower expectation values. The probability of finding any quasars would then be . We want to stress nevertheless that these numbers should be taken cautiously. They are only orientative to give a sense of how the faint end of the high redshift quasar luminosity function may behave.
The discovery of CXOCY J125304.0-090737, together with the other X-ray selected high redshift QSOs (Henry et al., 1994; Zickgraf et al., 1997; Schneider et al., 1998; Silverman et al., 2002; Barger et al., 2002), demonstrates the potential of X-ray techniques to detect high redshift QSOs. At redshifts , X-ray photons observed for example at 1 keV were emitted at energies keV, where the X-ray photons can penetrate even considerable amounts of extinction and therefore X-ray selected samples should be almost extinction-bias free. Only sources with intrinsic column densities cm2 should be affected. In particular, Chandra with its superior image quality that allows secure and economical identifications of optical counterparts will permit the completion of follow-up surveys, some of them which are already in progress, like the CYDER survey, that augur a new understanding of the quasar population at high redshift. For example, one can argue that one needs of the order of 100 high redshift quasars to constraint the high redshift LF. This could be achieved with 40-200 Chandra pointings (ACIS-I and ACIS-S) depending on whether the actual QSOs LF at the faint end is as our discovery implies or lower. Although demanding, current on-going X-ray follow up surveys may achieve these numbers. These discoveries will be complemented by deep wide-field multi-band optical surveys to provide a good understanding of the high redshift quasar population and thus the history of the accretion power onto black holes which is thought to be closely related to the galaxy formation and star formation rate history of the universe.
4 Conclusions
We present the discovery of CXOCY J125304.0-090737, a new high redshift quasar at found as part of the CYDER survey. CXOCY J125304.0-090737 is an optically faint quasar () with a typical QSO spectrum (Figure 3). In the optical, the quasar seems to be slightly obscured, although the data is also consistent with no extinction. In X-rays, CXOCY J125304.0-090737 is also X-ray faint ( ergs s-1 cm-2 in the [0.5-2.0] keV band) with a somewhat harder spectrum ( or ) than typical low redshift or high redshift optically selected quasars. We speculate that a reflection component can slightly harden the spectrum but by no means is this the only mechanism. The spectrum of CXOCY J125304.0-090737 and the other X-ray selected high redshift quasars is X-ray strong (and/or optically weak) compared to high redshift optically selected quasars. Given that both samples have different optical/ultraviolet absolute magnitudes, this result is a manifestation of the correlation between X-ray and rest frame ultraviolet luminosities. Taking into account selection biases, we find a slope for this correlation consistent with the value obtained by Vignali et al. (2002d). We therefore extend their result to lower luminosities at high redshifts using a larger sample.
The quasar space density implied by the discovery of CXOCY J125304.0-090737 is high: a factor larger than reasonable extrapolations of the quasar optical luminosity function at high redshift. Although not statistically significant, this number seems to indicate that the shape of the quasar luminosity is changing with the faint end slope becoming steeper with redshift or that current optical surveys at high redshift are missing considerable amounts of quasars. The space density predicted from the X-ray luminosity function is more a guess than a prediction. Anyway, if on-going and future X-ray surveys corroborate the numbers implied by the first field of the CYDER survey, the X-ray luminosity function will not differ much of its value at lower redshifts, . The combination of the currently ongoing optical and X-ray surveys with complementary regions of the parameter space sampled will help to determine the quasar luminosity function at high redshift with a better understanding of the biases involved with both selections. The CYDER survey promises to be one of the contributors to a better understanding of the quasar population at high redshift.
The CYDER survey participants and especially FJC and ET acknowledge support from the Fundación Andes. JM acknowledges support from FONDECYT.
References
- Anderson et al. (2001) Anderson, S. F., et al., 2001, AJ, 122, 503
- Baldwin et al. (1977) Baldwin, J. A., 1977, ApJ, 214, 679
- Barger et al. (2002) Barger, A. J., et al., 2002, AJ, 124, 1839
- Bechtold et al. (2002) Bechtold, J., et al., 2002, ApJ, in press, astro-ph/0204462
- Bennett (1962) Bennett, A. S., 1962, Mem. R. Astron. Soc., 68, 163
- Boyle et al. (2000) Boyle, B. J., et al., 2000, MNRAS, 317, 1014
- Brandt et al. (2001) Brandt W. N., et al., 2001, AJ, 122, 1
- Brandt et al. (2002a) Brandt W. N., Schneider D. P., et al., 2002a, ApJ, 569, L5
- Brandt et al. (2002b) Brandt W. N., Schneider D. P., et al., 2002b, in X-ray Spectroscopy of AGN with Chandra and XMM-Newton, eds, Boller et al, (Garching: MPE press), 235
- Castander et al. (2003) Castander, F. J., Treister, E., Maza, J., Coppi, P., Maccarone, T., Zepf, S., Guzmán, R. & Ruiz, M. T., 2003, AN, in press, astro-ph/0211643
- Edge et al. (1959) Edge, D. O., Shakeshaft, J. R., McAdam, W. B., Baldwin, J. E. & Archer, S., 1959, Mem. R. Astron. Soc., 68, 37
- Fabian et al. (1990) Fabian, A. C., et al., 1990, MNRAS, 242, P14
- Fan et al. (2001a) Fan X., et al., 2001b, AJ,121, 54
- Fan et al. (2001b) Fan X., et al., 2001c, AJ,122, 2833
- Gendreau et al. (1995) Gendreau, K. C., et al, 1995, PASJ, 47, L5
- George et al. (2000) George, I. M., et al., 2000, ApJ, 531, 52
- Gilli et al. (2001) Gilli, R., Salvati, M. & Hasinger, G., 2001, A&A, 366, 407
- Guilbert & Rees (1988) Guilbert, P. W. & Rees, M. J., 1988, MNRAS, 233 475
- Henry et al. (1994) Henry, P.J., et al., 1994, AJ, 107, 1270
- Kaspi et al. (2000) Kaspi S., Brandt, W. N. & Schneider, D. P., 2000, AJ, 119, 2031
- Kennefick et al. (1995) Kennefick, J. D., Djorgovski, S. G. & de Carvalho, R. R., 1995, AJ, 110, 2553
- Madau (1995) Madau, P., 1995, ApJ, 441, 18
- Mineo et al. (2000) Mineo, T., et al., 2000, A&A, 359, 471
- Miyaji et al. (2001) Miyaji, T., Hasinger, G. & Schmidt, M., 2001, A&A, 369, 49
- Oke & Korycansky (1982) Oke, J. B. & Korykansky, D.G., 1982, ApJ, 255, 11
- Reeves & Turner (2000) Reeves, J. N. & Turner, M. J. L., 2000, MNRAS, 316, 234
- Richards et al. (2003) Richards, G. T., et al., 2003, AJ, submitted
- Sandage (1965) Sandage, A., 1965, ApJ, 141, 1560
- Schneider et al. (1991) Schneider D.P, Schmidt, M. & Gunn, J. E., 1991, AJ, 101, 2004
- Schneider et al. (1998) Schneider D.P, et al., 1998, AJ, 115, 1230
- Schneider et al. (2002) Schneider D.P, et al., 2002, AJ, 123, 567
- Silverman et al. (2002) Silverman, J. D., et al., 2002, ApJ, 569, L1
- Schmidt (1963) Schmidt, M., 1963, Nature, 197, 1040
- Schmidt et al. (1995) Schmidt, M., Schneider, D. P. & Gunn, J. E., 1995, AJ, 110, 68
- Treister & Castander (2003) Treister, E. & Castander, F. J., 2003, AN, in press.
- Vanden Berk et al. (2001) Vanden Berk, D.E., et al., 2001, AJ, 122, 549
- Vignali et al. (2001) Vignali, C., et al., 2001, AJ, 122, 2143
- Vignali et al. (2002a) Vignali, C., et al., 2002a, in proceedings of the 5th Italian AGN Meeting ”Inflows, Outflows and Reprocessing around black holes”, astro-ph/0210001
- Vignali et al. (2002b) Vignali, C., et al., 2002b, AJ, in press, astro-ph/0210475
- Vignali et al. (2002c) Vignali, C., et al., 2000c, ApJ, in press, astro-ph/0210552
- Vignali et al. (2002d) Vignali, C., Brandt, W. N. & Schneider, D. P., 2000d, AJ, in press, (astro-ph/0211125)
- White et al. (2000) White, R.L., et al, 2000, ApJS, 126, 133
- York et al. (2000) York, D. G., et al., 2000, AJ, 120, 1579
- Yuan et al. (1998) Yuan, W., Brinkmann, W., Siefert, J. & Voges, W., 1998, A&A, 330, 108
- Zdziarski et al. (1993) Zdziarski, A.A., et al., 1993, ApJ, 405, 125
- Zickgraf et al. (1997) Zickgraf, F.-J., et al., 1997, A&A, 323, L21
| Parameter | Value |
|---|---|
| RA (J2000) | |
| Dec (J2000) | |
| NHaacalculated using HEASARC tool nh | cm-2 |
| V mag (Vega) | |
| I mag (Vega) | |
| J mag (Vega) | |
| Ks mag (Vega) | |
| (0.5-8 keV) | ergs s-1 cm-2 |
| (0.5-2 keV) | ergs s-1 cm-2 |
| (2.0-8 keV) | ergs s-1 cm-2 |
| Hardness Ratio |