Water ice growth around evolved stars
We present a model of the growth of water ice on silicate grains in the circumstellar envelopes of Asymptotic Giant Branch (AGB) stars and Red Super Giants. We consider the growth of ice by gas grain collisions, the thermal evaporation of ice from a grain, and sputtering. Our model contains several improvements compared to earlier models, including a detailed treatment of the effects of sputtering, a detailed calculation of the radiation pressure on the grain, and the treatment of subsonic drift velocities. In terms of drift velocity between the grains and gas in the envelope, we find that the ice formation process can be divided into three regimes: (i) a sputtering dominated regime where ice growth is heavily suppressed, (ii) an intermediate regime with moderately efficient condensation and (iii) a thermally dominated regime where ice formation is highly efficient. Sputtering is the critical factor which determines if ice formation can occur at all. We find that in Red Supergiants, ice formation is suppressed, while the winds of OH/IR stars allow for efficient condensation and can convert significant fractions of the available water vapor (tens of percent) into ice mantles on grains. Population II AGB stars hardly form ice due to their low dust to gas ratios. We also modify an analytical equation describing condensation and depletion (Jura & Morris, 1985) in order to give reasonable results for high and low drift velocities. Initially, ice will condense in crystalline form, but continuing condensation at low temperatures, and damage caused by interstellar UV photons favor the production of amorphous ice as well. We predict that a significant fraction of the ice formed will be amorphous.
Key Words.:
circumstellar matter – infrared: stars – stars: abundances – stars: AGB and post-AGB – stars: mass-loss1 Introduction
Asymptotic Giant Branch (AGB) stars represent the final phases of the evolution of stars with low or intermediate Main Sequence (MS) mass (). During the AGB phase, which lasts some , stars expel matter at a high rate ( to ). Mass-loss increases over time, eventually reaching rates in excess of . The outflowing matter creates a dusty molecular circumstellar envelope which may completely obscure the central star. As the dust is driven outwards by radiation pressure of the central star, it drags the molecules in the envelope along with it. Given the right conditions, some species of these molecules may condense onto the grains as ice further out in the outflow. The ice on these grains forms an important diagnostics. It can be detected by its infrared features and provides information about the physical conditions in the envelope. Ice mantles may also be chemically important, for example for the formation of carbonates (Kemper et al., 2002) or hydrous silicates. At the same time, the condensing molecules disappear from the gas, and the associated emission of molecular lines becomes weaker. This applies both to the main ice molecule (e.g. H2O) and derived species (e.g. OH maser emission). An understanding of the ice condensation process is therefore critical for the interpretation of both the solid-state and the molecular diagnostics of AGB envelopes.
Observations reveal that water ice is an important solid state component in the circumstellar environments of evolved stars. Water ice is found in the environments of AGB stars like OH 26.5+0.6, OH 127.8+0.0, OH 231.8+4.2 (see Omont et al., 1990, and references therein), post-AGB stars like HD 161796 (Hoogzaad et al., 2002), planetary nebulae like NGC 6302 (see e.g. Molster et al., 2001), and at least one Red Super Giant, NML Cyg (Molster et al., 2002). In these environments it has mainly been observed in a crystalline state. This has to a large extend been deduced from the presence of both a and feature in their Infrared Space Observatory (ISO, Kessler et al., 1996) spectra. Detailed studies of these spectra can be found in e.g. Barlow (1998) (who describes the features for different types of sources) and Sylvester et al. (1999) (who describe the features for AGB OH/IR stars specifically).
In this paper we present a detailed model which describes the growth of water ice on silicate grains in the circumstellar envelopes of oxygen-rich AGB stars. The model is also applicable to Red Super Giants. The general conditions for the formation of water ice in circumstellar envelopes have been described and discussed by Jura & Morris (1985); (hereafter refered to as JM). Their model includes most of the major processes involved in the formation of ice. However, as was already pointed out by JM, two ingredients are missing in their model: sputtering (the mechanical removal of ice lattice particles from the surface of the grain by energetic collisions with gas particles) and subsonic drift velocities (i.e. subsonic velocity differences between the dust and gas). We will show, that a detailed treatment of these ingredients is necessary if we wish to properly describe the ice formation process around evolved stars in a broad set of circumstellar environments. Compared to the JM model, our model also improves the calculation of the radiation pressure on the grain, taking into account the optical properties of the grain and the spectral energy distribution of the driving radiation.
In Sect. 2 we give a complete description of the model, while in Sect. 3 the results of the model will be presented and discussed. In Sect. 4 we apply our model to an OH/IR star, a Red Super Giant and a population II AGB star and discuss why ice does or does not grow in the circumstellar environments of these stars. The conclusions of this paper are given in Sect. 5. Sect. 3 will include discussions on 1) the effects of mass-loss rate, grain size and drift velocity on ice formation, 2) the distance dependence of ice formation and the question whether crystalline or amorphous ice will form, and 3) the derivation of a generally valid analytical expression for the depletion of water vapour from the envelope.
In a future paper (Dijkstra et al., in prep.) we will describe the observational applications of our model calculations in detail. In that paper we will use the model to predict the infrared spectra emitted by evolved stars under the influence of the ice formation process. The resulting spectra will be compared with observations of individual stars, and used to derive their stellar parameters.
2 The model
2.1 Radiation force, drag force and drift velocity
A silicate grain near an AGB star, will be blown away from the star by radiation pressure. As the grain moves away from the star it travels through the circumstellar envelope which surrounds the AGB star. On its journey the grain will hit gas molecules in the envelope. The collisions create a drag force on the grain. We will assume that the drag force will be in equilibrium with the radiation force at any time and place. We define to be the distance of the grain from the center of the star.
The radiation force on the grain is given by
| (1) |
where is the absorptivity efficiency of the grain at wavelength , and is the local Eddington flux at wavelength . For the calculation of we use the radiative transfer programme modust (Bouwman, 2001), which models the (emergent) spectrum of a spherical dust shell around a central star. is the radius of the grain and is the speed of light. Eq. 1 may be simplified to
| (2) |
where is the total luminosity of the star, i.e. the luminosity integrated over all . is the mean absorptivity efficiency integrated over all with respect to the local energy distribution. In Sect. 2.7 the calculation of will be discussed in detail.
The drag force is given by
| (3) |
as discussed by Dominik (1992). Here is the mass density of the gas in the envelope, while is its thermal speed. is defined to be where is the drift velocity, i.e. the velocity of the dust grain with respect to the gas.
Eq. 1 or 2 together with Eq. 3 can be solved for the drift velocity of the grain. Setting equal to we obtain
| (4) |
is an important quantity for the model since, as we will show later, for supersonic drift velocities it determines both the rate at which water molecules are collected from the gas and the rate at which these molecules are sputtered from the grain’s surface again, thus influencing the amount of ice that forms. also enters the expression for , the rate of change in radius of the icemantle as a function of distance to the star, which we will derive now.
If is the change in volume of the grain as it collects water molecules, each occupying a volume , from the gas in the envelope, then we have
| (5) |
The above equation assumes that all water molecules are distributed uniformly over the grain surface, i.e. the grain remains spherical at all times. For a given time interval , is given by (i) the rate at which water molecules from the gas in the envelope are collected by the grain, i.e. the growth rate , (ii) the rate at which water molecules are lost from the grain due to evaporation, i.e. the evaporation rate , and (iii) the rate at which water molecules are lost from the grain due to sputtering, i.e. the sputtering rate . With the velocity of the dust particle with respect to the star given by and the density of the ice in the mantle given by , where is the mass of a proton, we find
| (6) | |||||
yielding
| (7) |
enters Eq. 7 if we note that it can be expressed as , where is the speed of the gas in the envelope with respect to the star. is assumed to be an input parameter of the model. With this expression for we will now study , and in more detail.
2.2 The growth rate,
Assuming a Maxwell velocity distribution for the gas, the rate at which the dust grain collects water molecules from the gas is given by (Dominik, 1992)
| (8) | |||||
where is the number density of water molecules in the gas, is the sticking probability of a water molecule on the grain’s surface.
| (9) |
| (10) |
is the error function and
| (11) |
is the thermal speed of the water molecules in the gas. , the temperature structure of the gas and dust in the envelope as a function of distance to the central star, may be given as a power law or calculated using radiative transfer codes.
The sticking probability will be assumed in our calculations to be equal to one, since most of the ice formation will happen at low temperatures and with water molecules sticking to an ice surface. Because of the dipole forces in water ice, sticking is likely in this case. However, initially ice will grow on silicate cores and possibly on other materials, where sticking has to rely on van der Waals forces only. In this case it is possible that will drop below unity. Also at high drift velocites sticking may become inefficient. While we don’t treat the velocity dependence of , ice growth becomes automatically inefficient at those drift speeds because of sputtering.
For the limiting cases of small and large drift velocities may be written as
| (12) |
2.3 The evaporation rate,
Consider a mass of water ice surrounded by water vapour. The vapour pressure of water, , is defined to be the equilibrium pressure at which the rate in which the water ice evaporates from a surface is equal to the rate in which the water vapour condenses into ice on the surface. If the water gas pressure is larger (lower) than ice will grow (evaporate). We can (based on the Clausius-Clapeyron relation) express as
| (13) |
where is the water gas pressure in , is the number density of water vapour molecules at and is the temperature of the grain (Kouchi, 1987; Hoogzaad, 2001). We assume that . We will need in our calculation of the evaporation rate, .
The evaporation rate can be calculated from , using that in thermal equilibrium (TE) the growth rate must equal the evaporation rate, i.e. . The growth rate for a grain in TE is given by Dominik (1992) as (see also Eq. 12 in the limit )
| (14) |
| (15) | |||||
where we have defined as the supersaturation ratio. If ice evaporates from the surface, if it will grow (as discussed at the beginning of this section).
2.4 The sputtering rate,
As the grain moves outwards it experiences head-on collisions with gas particles in the envelope. Most of the gas in the envelope is present in molecular form and its main constituents are molecular Hydrogen (), Helium (He), Carbon monoxide (CO) and molecular Nitrogen (). As these particles collide with the grain, they may, for large enough drift velocities, mechanically remove lattice particles from the ice mantle of the grain. This is known as sputtering. We assume that the original silicate grain, which is the core of the dust particle, is not destroyed by sputtering111The silicate core is held together by chemical bonds, while the ice mantle is held together by physical bonds. Chemical bonds are generally stronger than physical bonds. This makes them less sensitive to sputtering.. To incorporate the effects of sputtering in our model, we follow the treatment by Woitke et al. (1993), who describe the sputtering process in detail. We have used their equations and will write them down below for completeness. We ignore chemisputtering, i.e. the removal of ice lattice particles by means of chemical reactions with other species.
In order to calculate the sputtering rate for a species , , we first derive the collision rate of the dust grain with the species. In the regime of supersonic drift velocities this rate is given by
| (16) |
where is the gas number density of species . The assumption of supersonic drift velocities at this point does not affect the results of our model, since in the ice forming regions (as we will show later) sputtering only occurs at supersonic drift velocities. Second, we calculate the sputtering rate for each species using
| (17) |
where is the sputtering yield for species . can be calculated from (Roth et al., 1978; Bohdansky et al., 1980; Strazzulla et al., 1985)
| (18) |
In these equations is the impact kinetic energy of the species as its collides with the grain and . is the mass of an individual member of a species , and is the mass of a (target) lattice particle. In our case this is equal to the mass of a water molecule, i.e. . The sputtering threshold energy, , is given by
| (19) |
where is the surface binding energy of a lattice particle on the target material. Sputtering shows a threshold behaviour. Only particles with sufficient energy, i.e. , are able to remove lattice particles. Particles with are not. The value of differs for each material and is lower for water ice () than for silicates like (). Notice that is roughly an order of magnitude larger for than water ice, which at least qualitatively justifies our assumption above that only the icemantle is affected by sputtering and not the silicate core. Representative values of for different species, including those mentioned here, are listed in Table 3 of Woitke et al. (1993).
Finally, with the sputtering yield for each species calculated we can now calculate the sputtering rate for each individual species and from this the total sputtering rate using (if there are species)
| (20) |
Another process which may lead to the removal of ice from the grains is grain-grain collisions. Grains of different sizes and/or optical properties will drift through the enevelope at different speeds and can therefore collide at significant speeds. Since the current models assume a single grain size, relative velocities between grains are zero and this effect can be ignored. However, in a future study with grain size distributions, it should be taken into account.
2.5 Depletion
As the grain moves outwards it collects water molecules from the gas, which are then no longer available to interact with new grains, i.e. the water molecules are depleted from the gas. The effects of depletion are incorporated into our models, by calculating the effects of the passage of grains on the number density of water molecules in the gas, . We have
| (21) |
for the change in as grains move a distance dr away from the star in a time interval dt and collect water molecules from the gas. is the number density of dust grains in the envelope. The first term on the right hand side of Eq. 21 takes into account the depletion effect. The second term takes into account the effect that as grains move outward, the surrounding gas dillutes into a larger volume and therefore drops. Dissociation of molecules by the interstellar UV field may also lead to a decrease of the available molecules. We have ignored this effect. It will only be important for low mass loss rate stars, where (as we will show below) sputtering prohibits ice formation.
is calculated using
| (22) |
where is the gas mass-loss rate, is the dust-to-gas ratio, is the radius of the silicate grain, and hence the initial radius of the core mantle grain that forms as ice grows on it, and is the bulk density of a silicate grain (which we took to be ). Due to the generally small values for () we assume that is not just the gas mass-loss rate, but the total mass-loss rate.
2.6 Crystalline or amorphous ice
Ice can exist in a crystalline or amorphous state. Crystalline ice can form if the mobility of the water molecules on the grain surface is large, and the flux of water molecules on the surface is relatively low. In this case, each water molecule has sufficient time to relax to a low energy configuration and hence help in the creation of a crystalline lattice. Amorphous ice forms when the mobility of the water molecules on the grain surface is small and the flux of water molecules on the surface is relatively high. Now the water molecules have no time to relax to a low energy configuration, resulting in an amorphous structure. A high (low) mobility of the water molecules can be achieved at high (low) temperatures.
In the infrared, crystalline ice will emit solid state features at and (Bertie et al., 1969), while amorphous ice will emit at but not at (Moore, 1999). In order to correctly predict and/or explain the infrared spectra emitted by the circumstellar envelopes of evolved stars, and hence the physical and chemical conditions inside these envelopes, the question whether crystalline or amorphous ice forms must therefore be addressed. We will present the spectra emitted by (the grains in) the circumstellar envelopes in a future paper. For completeness however, we already include the crystalline/amorphous ice discussion in this paper.
To investigate whether crystalline or amorphous ice will form we check if the following condition, originally derived by Kouchi et al. (1994), is full-filled
| (23) |
where is the growth flux of water molecules per unit area and is the socalled critical flux. is given by
| (24) |
while is given by
| (25) |
where , k is Boltzmann’s constant and . is the lattice constant of water ice, which is . We will once more assume that (see Sect. 2.3). Condition 23 summarizes the above considerations about whether crystalline or amorphous ice will form. Indeed, if, at a certain temperature (and therefore a certain mobility of the water molecules on the surface of the grain), the flux of water molecules on the surface is lower (larger) than a certain critical flux, crystalline (amorphous) ice will form. For completeness, we note that a discussion on the formation of crystalline or amorphous Carbon, in essence similar to that given here for water ice, is given by Gail & Sedlmayr (1984).
A third mechanism that determines the type of ice that is formed, besides fluxes and temperature, is UV radiation from the Interstellar Medium (ISM). Experiments done by Lepault et al. (1983) and Kouchi & Kuroda (1990) reveal that UV radiation can alter crystalline ice into amorphous ice when the temperature is below . This happens under the release of gas. Above the crystalline water ice is able to repair itself from UV radiation damage and remain crystalline. Moore & Hudson (1992) have shown that the unaltered fraction of crystalline water ice under the influence of UV radiation, can be given by
| (26) |
In this equation is the unaltered fraction of crystalline water ice after it has been irradiated with a dose of UV radiation. is given in eV. is given in molecules/eV and is a measure for the amount of water molecules in the crystalline lattice that can be reordered into an amorphous structure for each eV of UV radiation supplied. depends on the temperature of the ice. A graph showing this dependence is given by Moore & Hudson (1992): increases with decreasing temperature, meaning that for lower temperatures one eV of UV radiation can be used to amorphousize a larger fraction of ice.
At present, our model does not include the effects of the UV radiation from the ISM, since we expect its effects on the ice formation process to be negligible. However, we do recognize its importance regarding the type of ice that is created, and hence the spectrum that the final grain will emit. In Sect. 3 we will therefore include the issue of the UV radiation from the ISM into our discussion where needed.
2.7 Calculation of
As the grain collects ice it increases in radius and its optical constants, and hence , will change. The change in will affect , and so . This in turn will influence the (final) radius of the grain. We therefore calculate at each to incorporate this effect. Based on the value of the size parameter, , we either apply the routine bhcoat (taken from Bohren & Huffmann (1983) : used when ) or an effective medium calculation in combination with a MIE calculation (Bohren & Huffmann (1983) : used when ) to determine . The optical constants used in our calculations for the silicate core and the ice mantle were taken from Suh (1999) (cold silicate data) and Bertie et al. (1969) respectively.
3 Results and discussion
In this section we present and discuss the results of the ice growth model described in the previous section. First, we will discuss the effect of and the initial grain size, , on the formation of ice in the circumstellar envelope. Second, we will describe the effect of and on the depletion of water vapour from the envelope. Third, we discuss the distance dependence of ice formation and address the question whether crystalline or amorphous ice will form, followed by a discussion on the type of spectra produced by the core mantle grains formed in the envelope. Fourth we derive a generally valid analytical expression for the depletion of water vapour from the envelope. Finally, we apply our model to individual stars and compare our results with observations on these stars.
Our discussion on the above topics will largely be based on models of circumstellar envelopes with ranging between and . The choice of modelling above the more conventional upper limit of is based on observations of the post Red Super Giant binary system AFGL 4106 (Molster et al., 1999) and the post-AGB stars HD 161796 (Hoogzaad et al., 2002) and IRAS 16342-3814 (Dijkstra et al., in prep.). All these systems are thought to have experienced mass-loss rates of several times up to at some point during their history, or at least have had densities in the wind that, assuming spherically symmetric mass-loss, would require mass-loss-rates of the order of . Calculations of models with above therefore seem justified. The models contain a number of assumptions. Each envelope is composed of single sized particles with radii of either , , or . The initial abundance of water vapour (by number with respect to H) is . The dust-to-gas ratio is equal to . The velocity of the gas is given by . The central star has an effective temperature of and a radius , yielding a luminosity . We will address the importance of these assumptions where needed.
We used the radiative transfer programme modust (see Sect. 2.1) to provide a correct physical description of the temperature and radiative flux in the envelope. For (very) high mass-loss rates, and hence high optical depths, the modust models do not fully converge. When this problem occured, we resolved it by moving the inner radius of the circumstellar envelope outwards. Our results will not be severely affected by this.
3.1 Mass-loss rate and initial grain size

In Fig. 1 the relative increase in the mass of the core mantle grain (when the complete ice mantle has formed), , is shown as a function of for , , , and . Fig. 1 shows that for a given ice formation becomes more efficient as increases. For an increasing , the density, , increases and the drift velocity, decreases222As and hence increaeses the drag force on the grain increases. The drag force must balance the radiative force on the grain, which remains approximately constant. Therefore must decrease.. The increasing density increases the growth rate of the ice on the grain, while the decreasing drift velocity lowers the effect of sputtering on the grains, leaving newly formed ice layers intact and promoting ice formation as well. Fig. 1 also shows that for smaller values of , significant ice formation starts at lower . For smaller , is lower and sputtering is less important, again leaving newly formed ice layers intact. In Sect. 3.2 we will come back to the importance of sputtering.
We conclude that small grains have the best ability to grow ice and will most likely dominate the ice formation process if present in sufficient relative numbers. In grain size distributions we generally expect small particles to dominate (see e.g. Dominik et al., 1989). We may thus expect that models with small single sized particles and grain size distributions will yield similar results. If we for the moment take the behaviour of the smallest particles as typical, the curve for suggests that modest ice growth may already start at mass-loss rates of and that major ice formation only sets in when the mass-loss rate is typically of the order of several times to , i.e. during the SW phase of an AGB star (see Sect. 1).
3.2 Mass-loss rate, drift velocity, initial grain size and abundance
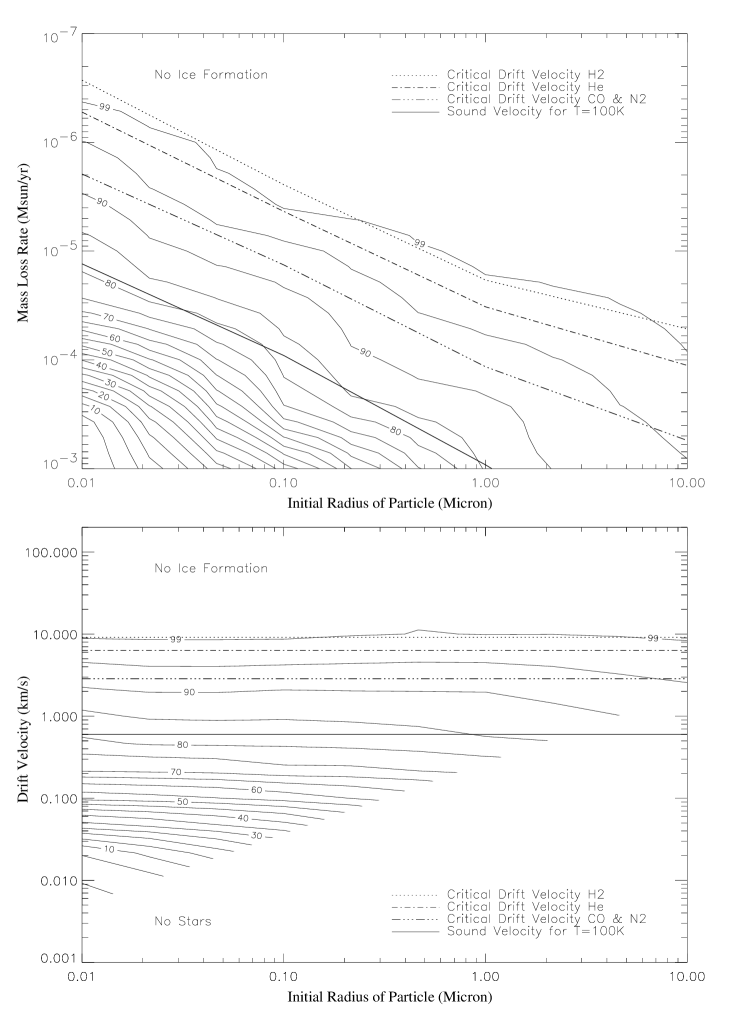
Fig. 2 shows two contour plots of , the final water vapour abundance in the circumstellar envelope after ice formation relative to the initial abundance, . In the upper panel of the figure is shown as a function of and and given in percentages. The contours, except for the contour, are shown at intervals. The unrealistic small scale curvatures in some of the contours (see e.g. the contour) are due to the interpolation of the contour values on the low resolution grid and may be ignored. is varied between and . These values correspond to those in Fig. 1. The lower panel shows the same contour plot, but this time with instead of on the horizontal axis. decreases as increases. Also shown in both contour plots are lines indicating where reaches the critical velocity for sputtering by , (), He, (), and CO and , (), and the sound velocity at , (). The ’No Ice Formation’ labels in these plots identify the regions where no ice formation occurs. The ’No Stars’ label in the lower contour plot indicates the region where exceeds and no stars are expected observationally.
The upper panel of Fig. 2 shows that decreases as increases and/or decreases. Also, ice formation becomes more and more efficient, as is suggested by the increasing density of the contours. As was discussed in Sect. 3.2, an increase in leads to higher densities and lower drift velocities, and hence larger growth rates and less sputtering. This promotes the formation of ice and makes smaller. A decrease in also leads to lower drift velocities, i.e. less sputtering, and (at a fixed ) it increases the total collecting area of the grains. Again, this promotes the formation of ice and makes smaller. The obtained values for cover the full range between and . , which corresponds to a total freeze out of all water vapour from the circumstellar envelope, is obtained in the most extreme cases, when and .
The contours of in the upper panel of Fig. 2 run parallel to the lines which indicate where the drift velocity reaches the critical velocity for sputtering by , He, and CO and , suggesting that the drift velocity is (indeed) a very important quantity in determining how much ice will grow. This is illustrated in the lower panel of Fig. 2.
In the lower panel the contours depend (almost) only on and not on . This allows us to characterize the ice formation process in terms of . The lower panel of Fig. 2 shows that for any given particle size, ice formation is impossible when . When ice formation is switched on, even though He, CO and still cause sputtering. The amount of ice formed in this regime is modest however (). Sputtering ceases below . From now on we will define the regime above as the sputtering dominated regime. Between and there is an intermediate regime where ice formation becomes increasingly more efficient (as can be seen by the increasing contour density), but still does not exceed . At subsonic drift velocities, i.e. when , seems to become very sensitive to , and a total freeze out of water vapour from the envelope occurs for the lowest drift velocities ().
We emphasize that in the subsonic or thermally dominated regime, it actually is not that controls the ice growth, but it is that does. Eq. 12 shows that for subsonic drift velocities the growth rate of ice on a grain does depend on the density , and thus , but not on . Only the thermal motions and density of the gas are important in this regime. The apparent rapid decline of with is thus simply the effect of the increasing mass-loss rate of the star. In the sputtering dominated regime it is also that we change, but now it is indeed the effect of that is truely important, since here it controls the sputtering yields (see Eq. 18), and thus for which gas species sputtering is switched on or off. In the intermediate regime, both and are important. In this regime sets the density in the envelope, and thus the growth rate, and it partially sets the value for ( depends on more variables than alone). also sets the growth rate, together with the time that the dust spends in a certain (ice formation) region of the envelope.
Fig. 2 can be used to derive the abundance of water vapour in the envelope of an evolved star, keeping in mind the assumptions discussed in Sect. 3. The assumptions that the dust-to-gas ratio is given by and the initial abundance of water vapour by are an important aspect of Fig. 2. When is lower (larger) than , the figure only provides an lower (upper) limit on , since there will be less (more) dust particles available to grow ice on. The effect of a changing is not trivial since it is dependent on multiple variables that continuously change throughout the envelope (see Eq. 21). Our models suggest that when is lower (larger) than , Fig. 2 provides an lower (upper) limit on . This is due to the overall decrease (increase) in the partial pressure of the water vapour, which brings the starting point of ice formation more outwards (inwards) in the envelope, and the decrease (increase) of the total collecting area of the grains at any given distance. In Sect. 3.4 an analytical equation for will be derived that is generally applicable.
3.3 Crystalline and/or amorphous ice?
We have investigated the question whether crystalline or amorphous ice will form in the circumstellar envelope. Our model shows that both types of ice may be present. As a typical example we briefly consider a star with and . We find that as the grain moves away from the central star, initially crystalline ice will be formed, meaning that condition 23 is met. At a distance of approximately and onwards, amorphous ice is formed. Since in condition 23, decreases as a function of distance to the star, it must be the decrease in which causes the breakdown of this condition. In this example, when the transition occurs. So from and onwards, each new water molecule that lands on the surface of the grain is immediately immobilised, preventing crystalline ice to form. We find that (not shown) the grain has reached about of its final radius, at the time the transition occurs. This means that a substantial fraction of the grain will be composed of amorphous ice, in this case a volume fraction of .

Fig. 3 shows the dependence of ice formation on the distance towards the central star. For a given initial grain size, the figure shows, as a function of mass-loss rate:
-
.
, the distance where ice formation starts (star symbols)
-
.
, the distance where ice condensation terminates because of too low H2O densities (diamond symbols).
-
.
, where the temperature drops below 70K. At higher temperatures, UV damage in crystalline ice is immediately repaired, while at lower temperatures, UV radiation converts crystalline ice into amourphous ice (squares).
-
.
, the distance outside which ice already condenses in amorphous form (triangles).
-
.
, the distance to which interstellar UV radiation can penetrate (crosses). Outside this radius, ice will be amorphisized unless the temperature is above 70K.
We have defined to be the distance where the grain has reached of its final size. We determine the distance to which the UV radiation can penetrate into the envelope, , by calculating where the UV optical depth of the envelope, (at wavelengths ), reaches unity. Generally, at a distance from the central star we have (using Eq. 22)
| (27) |
and thus
| (28) |
From this we calculate . We assume that , the absorptivity efficiency for UV radiation by the grain, is given by and . The shaded areas in Fig. 3 indicate those regions where crystalline ice is formed. In the unshaded regions amorphous ice forms.
Fig. 3 shows that increasing the mass-loss rate generally moves , , and inwards. So, ice formation starts closer to the central star, the final particle size will be reached earlier, and the transition point where amorphous ice instead of crystalline ice will be formed moves inwards. Meanwhile, moves outwards, due to the increasing optical depth of the circumstellar envelope. For envelopes with low optical depths (i.e. envelopes with low mass-loss rates and or large dust particles), the effect of the UV radiation is generally important throughout most of the envelope, and will most likely contribute to the formation of amorphous ice. However, the effect of the UV radiation can be reversed in regions close to the central star, where the temperature exceeds .
An increase of the initial grain size generally has a modest effect on the distance dependence of ice formation. Comparing the two panels in Fig. 3, it can be seen that , , and only show minor changes in general. However, changes over an order of magnitude, getting closer to the star as increases. This is again due to the decrease in the optical depth of the envelope. The effect of UV radiation from the ISM on the type of ice that forms is thus most important for stars with on average large particles in their envelopes.
As an AGB star evolves its mass-loss rate increases over time. Fig. 3 then suggests that the nature of the ice formation process will change over time as well. So, to get a qualitative impression on the evolution of the distance dependence of ice formation, one might wish to substitute the mass-loss rate on the horizonatal axis by a measure for the time that the AGB stars has spent on the AGB. It must be noted however, that as the star evolves, its luminosity will increase as well, an effect that is not incorporated in Fig. 3.
To illustrate the use of Fig. 3, we will look at an example given by the dotted line in the left panel. This example shows how the distance dependence of the ice formation process can be studied for a star which loses mass at a rate of and has particles of radius in its envelope. As a grain moves away from this star, the first ice will condense on its surface at . This ice will be crystalline. In this model we found that the temperature at the start of ice formation is approximately 94 K (not shown). For the other models we typically we found values between 92 and 104 K. At the temperature becomes too low to form crystalline ice. Instead amorphous ice will form. Finally, from onwards, interstellar UV photons will (start to) bombard the surface of the grain, most likely destroying all of the crystalline ice that is present. At most of the ice will have formed on the surface. Notice that if we had taken a star with , the UV photons of the ISM would only have become important after ice formation had already ceased. Again, any crystalline ice still present in the grain would most likely be destroyed.
3.4 A recipe for making ice
JM derived an equation for the final abundance, (also see Sect. 3.2), of a condensable species, like water, in the outflow of an evolved star. The model of JM considers the outer circumstellar envelope of the star, where the matererial has reached its terminal outflow velocity, . It is assumed that there is a condensation radius, , such that for , there is no condensation, while for almost every molecule sticks to the grain. Ice is collected by the grains through gas grain collisions and it is removed by thermal evaporation. The depletion of water from the gas phase is taken into account as well. Two very important assumptions of the JM model are that 1) sputtering is unimportant, since JM expect the drift velocities of the grains to be less than , and that 2) the grains are moving through the gas at supersonic drift velocities. Based on our results in Sect. 3.2 we can predict that assumptions 1) and 2) will cause the JM model to break down in respectively the sputtering dominated and thermally dominated regime. In the sputtering dominated regime, JM will predict ice growth, while sputtering will heavily supresses or completely block ice growth. In the thermally dominated regime the growth rate of the ice (also see Eq. 12) will be underestimated, and hence the amount of ice that grows. The equation of JM will only be valid in the intermediate regime, where assumptions 1) and 2) do apply. In this section we will study the equation given by JM, by applying it to the circumstellar envelopes described at the beginning of Sect. 3. We will compare its predicted depletion for these envelopes to the depletion predicted by our model calculations of these envelopes. Based on this comparison, we will provide a modified version of the JM equation that is valid in all regimes, i.e. the sputtering dominated, intermediate and thermally dominated regime.
According to JM the fraction of a species that remains in the gas phase, , is given by
| (29) |
where and is a measure of the UV optical depth between and . All other symbols have their usual meaning. The depletion of the species from the gas phase is (in general) given by
| (30) |

In the left panel of Fig. 4 we plot the depletion as predicted by JM, , against the depletion predicted by our model, , for the circumstellar envelopes described at the beginning of Sect. 3. (plotted on the horizontal axis) and (plotted on the vertical axis) are both given in percentages. The solid line shows where . The inset shows a close up view of the plot near the origin. It can be seen that for the JM model underestimates the depletion, i.e. it overestimates the true . The points for which this happens are indicated with stars. Also, for , the JM model predicts that the depletion is larger than zero, i.e. . Here JM thus overestimate and underestimate the true . The points for which this happens are indicated with crosses. Finally, for , the predictions of the JM model generally agree with our calculations (these points are indicated with diamonds). For small/large values of in this range, JM predict somewhat larger/lower values for the depletion however.
For reasons discussed at the begining of this section, the disagreement between the JM model and our model indeed occurs in the sputtering dominated regime (crosses) and the thermally dominated regime (stars), where we respectively have small and large depletions (also see Fig. 2 in Sect. 3.2). The intermediate regime (diamonds), where we have moderate depletions, is reasonable well described.
The discrepancy in the thermally and sputtering dominated regimes can be fixed once it is realized that in Eq. 29 is in fact the collecting speed of water molecules on the grain, . In the thermally dominated or subsonic regime this collecting speed is set by the thermal motions of the gas. The grain is practically at rest with respect to the gas and only the thermal motions of the gas particles determine the rate at which ice is formed (this is expressed in Eq. 12; see the case where in this equation). In the sputtering dominated regime this collecting speed may effectively be set to zero since there is no net ice formation due to sputtering (i.e. no net collection of water molecules on the surface). In the intermediate regime the collection speed is simply the drift velocity of the grain. We thus rewrite Eq. 29 into
| (31) |
with
| (32) |
Here is (see Sect. 3.2) and we took . With these new equations the predictions by JM are in better agreement with our model calculations. This is illustrated in the right panel of Fig. 2 where we have corrected for the effects of subsonic drift and sputtering. Notice that the thermally dominated regime and the sputtering dominated regime are much better described now.
In a part of the sputtering dominated regime, the predictions of JM still suffer from sputtering by He, CO and at small values of . In the intermediate regime they suffer from the onset of the thermal regime at the largest values of . This leads to respectively somewhat larger and smaller values predicted by JM compared to our models. The differences are very modest however.
In order to calculate in Eq. 32 for the intermediate regime, we may use
| (33) |
This equation is an approximation of Eq. 4, valid when . For a discussion on this equation and a derivation of it from first principles see for example Kwan & Hill (1977) and Jura & Morris (1985).
In summary we conclude that in order to calculate for a given (AGB) star, the original equation for as derived by JM will not suffice in many cases, unless thermal motions and sputtering are taken into account. This can be done by using the modifications given in Eqs. 31 and 32. In the next section we will apply the results of our model calculations, and the modified equation for derived in this section, to individual stars.
4 The model compared with observations :
modeling individual stars
In this section we will calculate the depletion of water ice from the circumstellar envelopes of different types of stars, based on Eqs. 27 and 31 thru 33. We will look at some of the details of the ice formation process around the modeled stars and discuss why ice does or does not grow. As examples we will consider an OH/IR star, a Red Super Giant (RSG) and a population II AGB star.
The depletion, , will be calculated in the following way. First, we determine from Eq. 33 and we check condition 32 to obtain the correct . Second, we calculate using Eq. 27, with . Third, we use and to derive in Eq. 31. Finally, we use Eq. 30 to find . All our models in this section will assume that m, , , (here we follow JM) , and .
For the condensation radius we take in the case of the OH/IR and population II AGB star. This choice is based on the results of Fig. 3 and seems to be a reasonable value when compared with observations (see e.g. Sopka et al. (1985)). In the case of a RSG we will take (see e.g. JM and references therein).
4.1 A typical OH/IR star
A typical OH/IR star has a luminosity of . It loses mass with rates between and . The outflow speed of the gas is typically . Taking we find that the depletion of water vapour is given by and for and respectively.
We thus predict that a typical OH/IR star may show depletions of water vapour in its envelope up to at least . In the above calculations we find that the drift velocity is in the order of or lower. This is near or in the intermediate regime where sputtering is unimportant and the grain moves supersonically through the gas. The absence of sputtering allows the ice formation to occur. The predicted presence of ice is in qualitative agreement with the infrared spectra of many OH/IR stars, which indeed reveal the spectral bands of water ice with a variety of band strengths (see e.g. Sylvester et al. (1999)). Examples of typical OH/IR stars modeled in this section are AFGL 5379 (e.g. Olivier et al., 2001) and OH 26.5+0.6 (e.g. Meyer et al., 1998).
4.2 A typical Red Super Giant
A RSG in some sense resembles the massive counterparts of AGB stars. Their MS mass is in the range ), and like AGB stars they are surrounded by a dusty envelope. It is interesting to see if ice can grow near these stars.
A typical RSG star has a luminosity of . It may lose mass with typical rates between and . In extreme cases the mass-loss rate may near values of (see e.g. AFGL 4106 (Molster et al., 1999)). The outflow speed of the gas is typically . Taking we find that the depletion of water vapour is given by , and for , and respectively.
Based on the results above we predict that near RSGs hardly any water ice will grow. Typically we may expect . Only in extreme cases up to about of the water vapout may be depleted into ice. The main reason for the inability of RSGs to form ice is that the drift velocity of the dust is generally too large. The above calculations show that for the drift velocity will typically be or higher. This is in the sputtering dominated regime where sputtering heavily suppresses or completely blocks ice growth. The large drift velocities are mostly due to the high luminosities of RSGs. Only for extreme mass-loss rates, like , efficient ice formation is possible since (intermediate regime) and hence sputtering is once more unimportant.
The presence of water ice towards typical RSGs (e.g. and VY CMa) has to our current knowledge not been frequently reported in literature, although in the case of NML Cyg water ice has been detected by Molster et al. (2002). Post-RSGs with signs that they had high mass-loss rates when they where still in the RSG phase do indeed reveal the presence of ice (e.g. AFGL 4106, HD 179821 and IRC+10420 (Molster et al., 2002)). This is in agreement with our findings in this section.
4.3 A typical population II AGB star
Finally we consider population II AGB stars which generally have low metallicities. The ice formation in this case is limited by the amount of dust present in the outflow. The dust-to-gas ratio is at most equal to the metalicity, which can be as low as . Taking , , , , and we find that the drift velocity of the dust is , which is close to the thermally dominated regime where ice formation is most efficient. However, the depletion of water vapour is only , caused by the low dust-to-gas ratio. We thus find that the depletion in population II AGB stars will be low, even for high mass loss rate cases.
5 Summary/Conclusions
The results of our study can be summarised as follows.
-
1.
For a given grain size, ice formation becomes more efficient as the mass-loss rate of the central star increases. An increase in increases the growth rate on the grains and reduces the effect of sputtering, promoting ice formation.
-
2.
In a circumstellar envelope, small dust grains will dominate the ice formation process if they are present in sufficiently large relative numbers. Compared to large dust particles, small particles have a better abillity to grow ice, since they are less sensitive for sputtering and, for a fixed , have a larger total collecting area.
-
3.
For small particle sizes (), modest ice growth may already start at mass-loss rates of and major ice formation only sets in when the mass-loss rates are typically of the order of several times to , i.e. during the superwind phase of an AGB star.
-
4.
The ice formation process can be characterised in terms of . For any given particle size, sputtering is an effective mechanism to heavily suppress or completely block ice growth at . Between and ice formation becomes increasingly more efficient as decreases, but no more than of the water vapour will form ice. When , more than of the vapour may condense. In this thermally dominated regime, it is that controls the amount of ice that growths.
-
5.
Both crystalline and amorphous ice can be formed in circumstellar envelopes. In the outflow, initially crystalline ice will form. When the dust temperature gets below , the molecules are immobilised on the grain, preventing crystals from forming and resulting in amorphous ice. A substantial fraction of the grain may be composed of amorphous ice ().
-
6.
For an increasing mass-loss rate, ice formation starts closer to the central star, the final particle size will be reached earlier, and the transition point where amorphous instead of crystalline ice will be formed moves inwards. In the meanwhile, the depth up to which UV photons from the interstellar medium can penetrate into the envelope, and make crystalline ice amorphous, moves outwards. An increase of the initial grain size generally has modest or no effect on the distance dependence of ice formation. Only the depth up to which UV photons from the interstellar medium can penetrate into the envelope may change several orders of magnitude, increasing for larger particle sizes.
-
7.
For a star with a low optical depth envelope, the effect of the UV radiation is generally important throughout most of the envelope, and will most likely contribute to the formation of amorphous ice. However, the effect of the ISM can be cancelled in the inner regions, where the temperature exceeds .
-
8.
We have improved upon an analytical equation, originally derived by Jura & Morris (1985), that predicts the depletion of water vapour from a circumstellar envelope.
-
9.
Applying our model results and the modified equation of Jura Morris to OH/IR stars, RSGs and population II AGB stars, we find that OH/IR stars reveal depletions up to at least . Population II AGB show very little depletion due to the low dust to gas ratio of these stars. OH/IR stars and population II AGB stars mainly occupy the intermediate and the thermally dominated ice formation regimes. Water ice will not or hardly form in the circumstellar envelopes of RSGs due to the generally large drift velocities of the dust in their envelopes, caused by their high luminosities.
References
- Barlow (1998) Barlow, M. J. 1998, Ap&SS, 255, 315
- Bertie et al. (1969) Bertie, J. E., Labbé, H. J., & Whalley, E. J. 1969, Chem. Phys.
- Bohdansky et al. (1980) Bohdansky, J., Roth, J., & Bay, H. L. 1980, Journal of Applied Physics, 51, 2861
- Bohren & Huffmann (1983) Bohren, C. & Huffmann, D. R. 1983
- Bouwman (2001) Bouwman, J. 2001, Ph.D. Thesis University of Amsterdam
- Dominik (1992) Dominik, C. 1992, Thesis Technischen Universität Berlin
- Dominik et al. (1989) Dominik, C., Sedlmayr, E., & Gail, H.-P. 1989, A&A, 223, 227
- Gail & Sedlmayr (1984) Gail, H.-P. & Sedlmayr, E. 1984, A&A, 132, 163
- Hoogzaad (2001) Hoogzaad, S. N. 2001, Master Thesis Vrije Universiteit (VU) Amsterdam
- Hoogzaad et al. (2002) Hoogzaad, S. N., Molster, F. J., Dominik, C., et al. 2002, A&A, 389, 547
- Jura & Morris (1985) Jura, M. & Morris, M. 1985, ApJ, 292, 487
- Kemper et al. (2002) Kemper, F., Jäger, C., Waters, L. B. F. M., et al. 2002, Nature, 415, 295
- Kessler et al. (1996) Kessler, M. F., Steinz, J. A., Anderegg, M. E., et al. 1996, A&A, 315, L27
- Kouchi (1987) Kouchi, A. 1987, Nature, 330, 550
- Kouchi & Kuroda (1990) Kouchi, A. & Kuroda, T. 1990, in Formation of Stars and Planets, and the Evolution of the Solar System, 193–196
- Kouchi et al. (1994) Kouchi, A., Yamamoto, T., Kozasa, T., Kuroda, T., & Greenberg, J. M. 1994, A&A, 290, 1009
- Kwan & Hill (1977) Kwan, J. & Hill, F. 1977, ApJ, 215, 781
- Lepault et al. (1983) Lepault, J., Freeman, R., & Dubochet, J. 1983, J. Microsc., 132, 3
- Meyer et al. (1998) Meyer, A. W., Smith, R. G., Charnley, S. B., & Pendleton, Y. J. 1998, AJ, 115, 2509
- Molster et al. (2001) Molster, F. J., Lim, T. L., Sylvester, R. J., et al. 2001, A&A, 372, 165
- Molster et al. (2002) Molster, F. J., Waters, L. B. F. M., Tielens, A. G. G. M., & Barlow, M. J. 2002, A&A, 382, 184
- Molster et al. (1999) Molster, F. J., Waters, L. B. F. M., Trams, N. R., et al. 1999, A&A, 350, 163
- Moore (1999) Moore, M. H. 1999, Solid interstellar matter: The ISO revolution
- Moore & Hudson (1992) Moore, M. H. & Hudson, R. L. 1992, ApJ, 401, 353
- Olivier et al. (2001) Olivier, E. A., Whitelock, P., & Marang, F. 2001, MNRAS, 326, 490
- Omont et al. (1990) Omont, A., Forveille, T., Moseley, S. H., et al. 1990, ApJ, 355, L27
- Roth et al. (1978) Roth, J., Bohdansky, J. J., & Martinelli, P. A. 1978, Proceedings of the Int. Conf. on Ion Beam Modifications of Materials
- Sopka et al. (1985) Sopka, R. J., Hildebrand, R., Jaffe, D. T., et al. 1985, ApJ, 294, 242
- Strazzulla et al. (1985) Strazzulla, G., Baratta, G. A., & Magazzu, A. 1985, Astronomy Express, 1, 143
- Suh (1999) Suh, K. 1999, MNRAS, 304, 389
- Sylvester et al. (1999) Sylvester, R. J., Kemper, F., Barlow, M. J., et al. 1999, A&A, 352, 587
- Woitke et al. (1993) Woitke, P., Dominik, C., & Sedlmayr, E. 1993, A&A, 274, 451+