M75, a Globular Cluster with a Trimodal Horizontal Branch.
II. photometry of the RR Lyrae Variables
Abstract
We present new CCD photometry, light curves, and ephemerides for 9 previously known, 29 newly detected RR Lyrae variables and one newly detected variable of an unknown type in the globular cluster M75. The photometry used for the detection of the additional variables was obtained with the image subtraction package isis. The data were acquired on an observing run in July 1999 and range over 7 observing nights. Estimates of fundamental photometric parameters are presented including intensity- and magnitude-averaged and magnitudes, magnitude-averaged colors, pulsation periods, and pulsation amplitudes. The mean period of the RRab variables, d, and the number fraction of RRc stars, , are both large for an Oosterhoff type I (OoI) globular cluster, suggesting that M75 may be Oosterhoff-intermediate. Possible conflicts between Oosterhoff-type determination based on the and diagrams are discussed. The physical parameters of the RRc and RRab variables, as obtained from Fourier decomposition of their light curves, do not show any clear deviation from normal OoI behavior.
1 Introduction
M75 (NGC 6864) is a distant globular cluster ( kpc; Harris 1996) lying on the other side of the galactic center. The cluster has a relatively high degree of concentration (; Pryor & Meylan 1993). Catelan et al. (2002, hereafter Paper I) found a metallicity of [Fe/H] = dex and dex in the Carretta & Gratton (1997) and Zinn & West (1984) scales respectively. Its reddening, , is mag (Paper I).
M75 has been the target of relatively few studies. Harris (1975) provided the first color-magnitude diagram (CMD). Paper I provided a CMD based on CCD data and showed that M75, suspected to have a bimodal horizontal branch (HB) by Catelan et al. (1998), actually has a trimodal HB. The focus of this paper, Paper II in the series, will be the RR Lyrae variables in M75.
RR Lyrae variables provide crucial information for estimating globular cluster ages and distances, as summarized by Smith (1995). They are easily identified by their distinctive light curves and are bright enough to be observed to considerable distances. Their absolute magnitudes appear to be quite restricted. The range of RR Lyrae luminosities is discussed in Carney (2001) and Harris (2001).
As we have shown in Paper I, M75 has a special HB morphology: it is one among only a handful of globular clusters with a bimodal—actually a trimodal—distribution of HB stars. The physical cause of HB bimodality is still not known (Rood et al. 1993; Catelan et al. 1998). RR Lyrae variables can provide precious information on the “second parameter(s)” that lead to HB bimodality (Borissova, Catelan, & Valchev 2001 and references therein), since different second parameter candidates are expected to affect RR Lyrae luminosities, masses and pulsational properties in different ways (see, e.g., Catelan 1996). For this reason, variability surveys of bimodal-HB globulars which contain sizeable RR Lyrae populations, such as NGC 1851 and M75, are of great potential importance in sheding light on the connection between bimodal HBs and the second-parameter effect. Our interest in these variables was furthered by the confirmation, in Paper I, of the suggestion by Harris (1975) that M75 seems to have a high number ratio of HB stars to red giant branch (RGB) stars, which could be explained by a higher-than-standard helium abundance (e.g., Iben 1968). If so, the M75 HB stars should be brighter than those in other clusters with “normal” , implying longer periods for their RR Lyrae variables.
The variables in M75 were previously studied by Pinto, Rosino, & Clement (1982, hereafter PRC82). Their study revealed ten RR Lyrae variables, although light curves were constructed for only six of them. Several hints existed that the PRC82 study was incomplete, thus making a new variability survey necessary: (i) M75 is a distant and dense cluster; (ii) PRC82 only obtained photographic photometry; (iii) Recent results (Kaluzny, Olech, & Stanek 2001) using the new image-subtraction techniques (Alard 2000; Alard & Lupton 1998) suggest that even nearby, well-studied globular clusters—particularly the more concentrated ones—suffer from significant incompleteness in their known RR Lyrae populations. The purpose of this paper is to present the first extensive CCD variability survey for M75.
2 Observations and Reductions
2.1 Observations
The CCD images used in this study were obtained with the 0.9-meter telescope at the Cerro Tololo Inter-American Observatory. The field was observed over a seven night interval in July 1999. Observing conditions were not good for three of the seven nights and data from these nights are not included here. The data reported here were obtained on the nights of 15/16, 19/20, 20/21, and 21/22 July 1999. The 20482048 Tek2K-3 CCD was used. Typical exposure times were 240 s for the frames and 360 s for the frames. The pixel scale was 0.395 arcsec giving a field of view of 13.5 arcmin.
2.2 Data Reductions
The raw data frames were processed following standard procedures to remove the bias, trim the pictures, and divide by mean dome flats obtained using color-balanced filters. No attempt was made to recover bad pixels or columns. Initially raw magnitudes were derived using allstar and daophot (Stetson 1994). In this reduction only 7 variables, all priviously identified, were clearly present. Next we applied allframe (Stetson 1994) to the images. The results yielded light curves for 9 of the previously identified variables and resulted in the discovery of 13 additional variables.
As a final attempt to improve the quality of the light curves and perhaps detect additional variables, we employed the image subtraction package isis V2.1 (Alard & Lupton 1998; Alard 2000). The resulting differential flux data produced improved light curves for all of the variables found using allframe and found an additional 17 variables, giving 39 variables in all. These results are consistent with the predictions by Kaluzny et al. (2001) of a greater than 30% incompleteness factor in the detection of RR Lyrae variables in globular clusters.111We cannot provide a finding chart identifying the new variables because they are in the crowded cluster center, and we do not have an exposure that shows individual stars there.
In order to convert the isis differential flux data to standard magnitudes we used allstar and daophot (Stetson 1994) to obtain instrumental magnitudes for each of the variables in the and reference images of the isis reductions. Due to the distance of the cluster and crowding in its center, the photometry for many of the variables was unreliable. We choose a value of 3.5 as the dividing line between reliable and unreliable photometry. With this criterion, 14 variables had reliable photometry in both the and filters, 13 had reliable photometry in but not , and 2 had reliable photometry in but not .
For those variables with allstar values of less than 3.5, the instrumental magnitude for each variable was converted to flux. The isis differential flux was then added to the reference flux to determine the total flux for each variable in each of the exposures, and these fluxes were converted back to instrumental magnitudes. Using the standard magnitude data from Paper I, transformation equations were derived to convert the instrumental magnitudes from the isis reductions into standard magnitudes. The 14 variables with less than 3.5 in both filters were transformed to the standard system using transformation equations of the following form:
| (1) |
| (2) |
The 15 variables with good photometry in only one of the filters were also put on the standard system for the appropriate filter. An appropriate value for the color (depending on the mode of pulsation) was assumed. That is, a value of instrumental was assumed that would give mag for RRc variables and mag for RRab variables. In this way standard magnitudes were computed for the 13 variables with good and bad instrumental magnitudes, and standard magnitudes were computed for the two variables with good and bad instrumental magnitudes. There are two sources of error associated with this. As an RR Lyrae pulsates its color changes in proportion to its amplitude, with having a maximum of about 0.4 mag. This effect will increase the amplitude of pulsation listed in Table 1 for the 13 stars with good and bad photometry by a maximum of about 0.044 mag (roughly a 0.02 mag extension at both the maximum and minimum brightness). This error in amplitude decreases with amplitude, being less than 0.022 mag for RRc variables. The color change over the pulsation cycle has very little effect on the average magnitudes. The second source of error involves assuming a particular value of for the RRab and RRc variables. The actual range of magnitude-averaged colors for each of these is about 0.12 mag. This could affect the average magnitudes by mag relative to the values listed in Table 1. Because of the form of the transformation equations, there is negligible effect on the values for amplitudes and magnitudes listed in Table 1 for the two stars with good and bad photometry.
3 Periods and Light Curves
Periods were determined using the period-search program “kiwi.” (“Kiwi” searches for periodicity by seeking to minimize the total length of the line segments that join adjacent observations in phase space, i.e., to maximize the smoothness of the light curve. The “kiwi” program was kindly provided to us by Dr. Betty Blanco.)
The location of the variables in arcsec from the center of the cluster as in Sawyer-Hogg’s (1973) catalog, and the new periods and ephemerides are given in Table 1. The data cover 7 days, spanning about 21 cycles for the shorter period variables and only about 9 cycles for the longer period variables. Because only the current data are used to determine periods, the periods are quoted to only four significant figures. Light curves based on the periods given in Table 1 are shown in Figure 1. For the variables with good photometry in both filters, the light curves are in standard magnitudes. For the other variables, the differential flux from the isis reduction is used to produce the light curves. It is obvious that the photometry is of good internal precision, with the scatter about the mean loci being on the order of 0.02 mag.
4 Light Curve Parameters
For each variable for which standard magnitudes were determined (either , , or both), the mean magnitudes have been derived by linear interpolation of the phase-magnitude diagrams. The mean values were derived both as magnitude- weighted and as intensity-weighted means (Storm, Carney, & Beck 1991). For the 14 variables with standard magnitudes in both and , the mean colors (the difference between magnitude-averaged and ) were determined. The and amplitudes were determined as the differences in the average maxima and minima of the light curves. These results are given in Table 1.
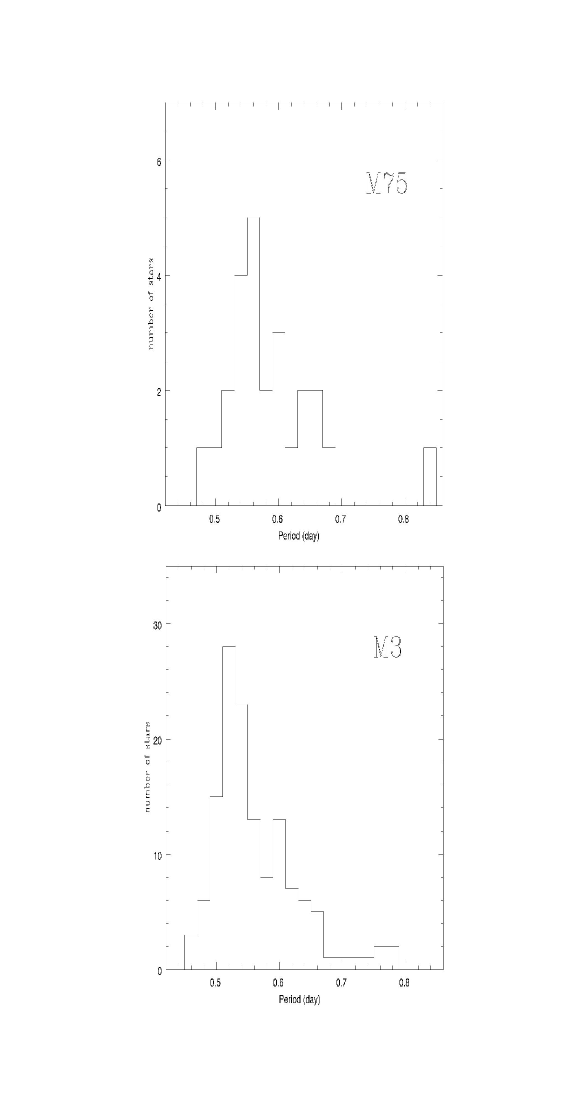
Figure 2 is a histogram of the M75 RR Lyrae periods with the RRab and RRc variables clearly separated. The 13 RRc variables all have periods less than 0.4 day while the 25 RRab variables all have periods greater than 0.45 day. The average period for the RRab variables is 0.5868 day and for the RRc variables is 0.3054 day. For its relatively high metallicity, one might expect M75 to be of Oosterhoff type I. However, the relatively long mean period of the M75 RRab variables would make it the Oosterhoff I cluster with the longest value of , as can be seen from Figure 4 in Clement et al. (2001). Interestingly, the number ratio is also large for OoI standards, being intermediate between OoI and OoII values—Clement et al. list for OoI clusters, and for OoII clusters. Therefore, in terms of mean RRab periods and RRab-to-RRc number fraction alike, M75 might classify better as an Oosterhoff-intermediate cluster, rather than as an OoI cluster as would be expected for its metallicity. We will further test the possibility that M75 is an Oosterhoff-intermediate cluster in §6 below, using the Fourier decomposition parameters of the M75 RR Lyrae light curves.
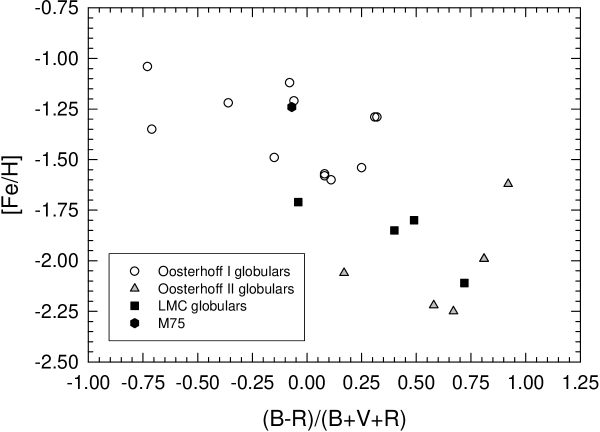
If M75 is confirmed to be an Oosterhoff-intermediate globular, it is important to note that there is one important property of M75 that distinguishes it from the the well-known Oo-intermediate globulars in the LMC (Bono, Caputo, & Stellingwerf 1994): It is much more metal-rich than the latter, occupying a completely different position in the HB morphology-[Fe/H] plane (Fig. 3). To produce Figure 3, we have utilized data from Bono et al. for the LMC and OoI clusters (replacing the metallicity values and HB types for the latter with data from Harris 1996), and included, among the OoII clusters, in order of decreasing metallicity, M2 (NGC 7089), M53 (NGC 5024), M68 (NGC 4590), NGC 5466, and M15 (NGC 7078). For these, the [Fe/H] and HB morphology values were also adopted from the Harris catalogue. This diagram shows that a different explanation might be required for M75’s Oosterhoff-intermediate classification, if this is confirmed, than has been proposed for the LMC globulars (Bono et al. 1994). A tantalizing possibility is that such an Oosterhoff-intermediate classification could be related to M75’s HB bimodality and peculiar -ratio (Paper I). On the other hand, it should be noted that there are also “regular” OoI clusters that present bimodal HBs, such as NGC 6229 (Borissova et al. 2001) and NGC 1851 (Walker 1998; but see also Bellazzini et al. 2001, especially their §4.6).
Figure 4 shows magnitude-averaged color as a function of period. Due to the strong temperature dependence implied by the period-mean density relation, it is expected that the longer periods correspond to the redder colors. NV8, NV3, and NV7 are somewhat anomalous in this plot, and will be discussed in further detail below.
Figure 5 is a Bailey diagram, a plot of amplitude as a function of log period. As has long been known, for the RRab variables, the amplitude decreases as the period increases, while for the RRc variables, the amplitude first increases and then decreases with increasing period (Sandage 1981a). Also shown in the figure are “typical” lines for OoII and OoI clusters. The OoII line was obtained from C. Clement’s (priv. comm.) corresponding line in the diagram, transforming amplitudes to amplitudes by means of the relation (Layden et al. 1999). The “OoI line” is the same relation as provided by Borissova et al. (2001) for M3.
The location of an RRab variable in the period-amplitude plane of Figure 5 is a measure of its average luminosity, which is determined by its surface temperature and radius (the Stefan-Boltzmann equation). Sandage (1981a, 1981b), Jones et al. (1992), Catelan (1998), and Sandquist (2000) have shown that the amplitude of an RRab variable is related to its effective temperature; the larger the amplitude, for a given metallicity, the higher the temperature (but see De Santis 2001). The pulsation equation relates the period of a variable star to its average density; the period is inversely proportional to the square root of the average density. Assuming that the masses of the variables are distributed in a narrow range, the period becomes a measure of the average size of the star; the longer the period, the larger the star. Thus, for a given amplitude (temperature), the longer period (larger) variables should be more luminous.
Assuming all of the variables are cluster members and thus at about the same distance, the position of a variable in the period-amplitude plane should correspond to its apparent brightness. There are, however, several anomalies. The three brightest RRab variables are NV23, NV24, and NV17 with intensity-averaged magnitudes of 16.960, 17.150, and 17.515 mag respectively. A higher luminosity for these stars is not consistent with their positions in the period-amplitude plane. In fact, NV23 with a short period (small size) and very low amplitude (low temperature) should have a relatively low luminosity. In fact, all three stars have small amplitudes for their periods.
It is possible, of course, that for NV23, NV24, and NV17, one or more are not cluster members, and that their greater brightness results from their being closer than the cluster. This seems unlikely in that they are within 9, 12, and 30 arcsec, respectively, of the cluster center. Another possible explanation for the fact that they are brighter than their pulsation properties would suggest is that these stars are blends. This might account for the unusually small amplitudes of NV23 and NV17 relative to what would be expected based on their periods. It should also be noted that the parameter (Jurcsik & Kovács 1996), as discussed in more detail in §6.2 below, also indicates all of these stars to be “anomalous.”
NV10 has a unique position in the period-amplitude plane. Its very long period (large size) relative to the other RRab variables of comparable amplitude (temperature) suggests a greater luminosity and hence brightness. In fact NV10 does have an intensity-averaged magnitude of 17.432, significantly brighter than the ZAHB. As discussed by Clement & Shelton (1999) and Lee, Demarque, & Zinn (1990), a higher luminosity for NV10 might indicate that it is in an advanced evolutionary stage. For a recent, critical discussion of the possible evolutionary history of such bright RR Lyrae stars, the reader is referred to Pritzl et al. (2002).
For the RRab variables in Figure 5, there is considerable scatter. Clement & Shelton (1999) pointed out that Blazhko variables introduce scatter into the period-amplitude diagram. The scatter is introduced when the light curve of a Blazhko variable represents it at less than its maximum amplitude. Thus yet another possible explanation for the low amplitudes of NV23 and NV17 (discussed above) is that they are Blazhko variables whose light curves represent them at much less than maximum amplitude. There is some evidence in the data that NV17 is in fact a Blazhko variable.
For most Blazhko variables the difference in amplitude would not be apparent over an observing interval of just seven days. However, NV17 reached maximum brightness on three consecutive nights of the observing run, and the corresponding magnitudes are 16.925, 16.969, and 17.024 mag. Although NV17 was not put on the standard system for , the differential fluxes corresponding to maximum brightness for the three consecutive nights are 8011.6, 6372.1, and 5917.7, showing the same pattern of decrease in maximum brightness. An additional test for Blazhko variables involves the Fourier decomposition parameters to be discussed in §6.
5 Color-Magnitude Diagram
The CMD for M75 has been provided in Paper I. Using these data, Figure 6 is a magnified CMD that highlights the HB and includes those variable stars for which we have values. In general, the variable stars fall in the appropriate areas of the instability strip according to their mode of pulsation. There are, however, two obvious anomalies. Based on its period, amplitude, and the shape of its light curve, NV3 is clearly an RRab variable. However, its color places it with the RRc variables on the CMD. A possible explanation is that it is blended with a bluer star. This is consistent with the fact that it is somewhat brighter than most other RR Lyrae variables and with the fact that it has an unusually low ratio of the to amplitudes (see Pritzl et al. 2002).
The other anomaly is NV7 which lies well to the red side of the instability strip. Its intensity-averaged magnitude also shows it to be fairly bright, and it has a high ratio of the to amplitude, so it also might be a blended star, in this case with a redder companion. These stars are, of course, also discrepant in the color-period plot (Fig. 4). There is, however, no indication of blending in the allstar round value for either NV3 or NV7. On the basis of their Fourier parameters (§6.2), only NV7 is classified as “anomalous.”
Another unusual feature of the CMD is that both NV10 and NV8 are considerably brighter than the ZAHB. Like NV3, NV8—an RRc star—has a low ratio of the to amplitudes and is probably blended with a bluer star.
6 Physical Properties of the RR Lyrae Variables from their Fourier Parameters
Fourier decompositions of the RR Lyrae light curves were done fitting to an equation of the form:
| (3) |
where , and for the RRab, and for the RRc (i.e., a sine decomposition was carried out for the RRab, but a cosine decomposition for the RRc). When the amplitude is found to be negative, we change its sign and add to the corresponding phase .
6.1 RRc Variables
Amplitude ratios and phase differences for the lower-order terms are provided in Table 2. Note that the phase differences are adjusted to a positive value between 0 and , which is accomplished by adding (or subtracting) multiples of to (from) as may be necessary. In this table (and in the ones to follow), uncertain values are indicated with a colon symbol (“:”), whereas unreliable ones are denoted by a double colon symbol (“::”), and are provided for completeness only. For NV29 and N30, whose RRc classification is uncertain (see Table 1 and Fig. 1), no measurements were attempted. The error in the coefficient was obtained from Eq. (16d) of Petersen (1986).
Simon & Clement (1993) used light curves of RRc stars obtained from hydrodynamic pulsation models to derive equations to calculate mass , luminosity , temperature and a “helium parameter” as a function of the Fourier phase difference and period. These correlations were based on light curves using magnitudes as a measure of variation in brightness. In their study of NGC 6229, Borissova et al. (2001) calculated physical parameters from the Simon & Clement relationships using light curves based on both apparent magnitudes (daophot, Stetson 1994) and differential fluxes (isis). The fact that some of the isis light curves were of better quality than the daophot ones resulted in reduced errors for some of the Fourier parameters, but there were no significant differences between the two analyses in the average values of the physical parameters.
Using Simon & Clement’s (1993) equations (2), (3), (6), and (7) and our apparent magnitude light curves, where available, and isis light curves otherwise, we computed , , and for the RRc stars in M75. These results are given in Table 4. Note that the “helium parameter” is not supposed to provide a good description of the helium abundance (Simon & Clement 1993), so that the deviations from canonical values for GC stars (i.e., ) that are apparent in this table should neither be considered reliable evidence for a high helium abundance in M75, nor necessarily a serious problem with the Simon & Clement method. However, it should also be noted that similarly high values have previously been reported, e.g., by Borissova et al. (2001) and Olech et al. (2001). In like vein, several of the mass values given in this table, particularly those for V9, NV8, and NV12, are clearly too low, being lower than even the helium core mass at the He-flash (Catelan, de Freitas Pacheco, & Horvath 1996 and references therein). Such low mass values are not uncommon in the literature either, having recently been reported, for example, by Borissova et al., Clement & Rowe (2000), Olech et al. (2001), and Pritzl et al. (2001, 2002). In our opinion, these low RRc mass values are unphysical, and represent evidence that the Simon & Clement method may indeed be affected by systematic errors.
The unweighted mean values and corresponding standard errors of the mass, log-luminosity, effective temperature and “helium parameter” are: , , K and , respectively.
6.2 RRab Variables
Amplitude ratios and phase differences for the lower-order terms are provided in Table 3. Note that, as in the cos decompositions for the RRc’s (§6.1), the phase differences are adjusted to a positive value between 0 and , which is accomplished by adding (or subtracting) multiples of to (from) as may be necessary. In this table, the Jurcsik-Kovács value, which is intended to differentiate RRab stars with “regular” light curves from those with anomalies (e.g., the Blazhko effect), is also given (eighth column).
Jurcsik & Kovács (1996), Kovács & Jurcsik (1996, 1997), Kovács & Kanbur (1998), Jurcsik (1998) and Kovács & Walker (2001) obtained empirical formulae relating the stellar metallicities, absolute magnitudes and temperatures to Fourier decomposition parameters for RRab stars with “regular” light curves. The only model-dependent ingredients in their calibrations are the zero point of the HB luminosity scale (adopted from Baade-Wesselink studies) and the color-temperature transformations (obtained from static model atmospheres). Again, although this method was designed for use with apparent magnitude light curves in , Borissova et al. (2001) have shown that the overall averages are little affected by using isis relative fluxes. As with the RRc variables, we have used a combination of apparent magnitude light curves and isis light curves for our Fourier analysis of the RRab variables.
The physical parameters of M75 RRab variables obtained from this method are given in Table 5. These values are determined using 5 RRab variables (V14, NV2, NV3, NV5, NV9) for which the parameter is less than 5.0. Variables with less than 3.0 are designated by Jurcsik & Kovács as regular, while those with larger values are called “peculiar.” The values were obtained from Eq. (6) and Table 6 in Jurcsik & Kovács (1996); [Fe/H], , and come from Eqs. (1), (2), (5) and (11) of Jurcsik (1998). Eqs. (6) and (9) of Kovács & Walker (2001) were used to compute the color indices and , respectively; then Eq. (12) of Kovács & Walker (1999) was used, assuming a mass of , to derive temperature values from Eq. (11) (for ) and Eq. (12) (for ) in Kovács & Walker (2001).
For the criterion less than 5.0 for regular variables, the unweighted mean value (and corresponding standard deviation) of [Fe/H] derived from is dex. Note that this value is in the Jurcsik (1995) scale; this corresponds to dex in the Zinn & West (1984) scale (in reasonable agreement with the value found in Paper I). Likewise, the mean absolute magnitude is mag. The faint HB is a reflection of the adoption of the Baade-Wesselink luminosity zero point in the calibration of this method (see Jurcsik & Kovács 1999 for a recent discussion). The temperature values based on the , and formulae are similar, the ones based on being higher than those based on the other color indices by , or about 75 K.
If the criterion for “regular” status is made more strict (), only V14 is removed from the list of “regular” variables, and the mean values of the physical parameters change only very slightly: The mean colors and temperatures become bluer (average change, considering the three temperature values: ), the metallicity increases by dex, and the RRab luminosity remains essentially unchanged ( mag).
For comparison purposes, we find, from the “bimodal” HB simulations (Paper I), the following mean values for all the RR Lyrae variables (RRab and RRc included): , , (the latter value is the average log-temperature; this corresponds to a K), mag.
6.3 The Oosterhoff Type of M75
As we have seen, the relatively large mean period of the M75 RRab, d, and the high number fraction of RRc variables, , do not clearly place M75 in the OoI group—as would be expected from its relatively high metallicity. In fact, as can be seen from Figure 7, the shift in periods with respect to M3, the prototypical OoI globular, seems to affect the whole distribution, not just the mean.
The longer periods of the M75 RRab, compared to the other OoI globulars’ mean RRab periods, could most plausibly be due to two effects: (i) A skewed temperature distribution, with the redder regions of the instability strip being preferentially populated in M75; (ii) A higher mean luminosity at any given temperature. The first possibility does not seem supported by our data, and would also appear inconsistent with the high fraction of RRc variables (which are, of course, bluer than the RRab). The second possibility, on the other hand, could explain the high -ratio for the cluster, as found in Paper I: For instance, an increase in the initial helium abundance for M75 would lead to both a higher -ratio and to a brighter HB, thus implying longer periods at any given temperature.
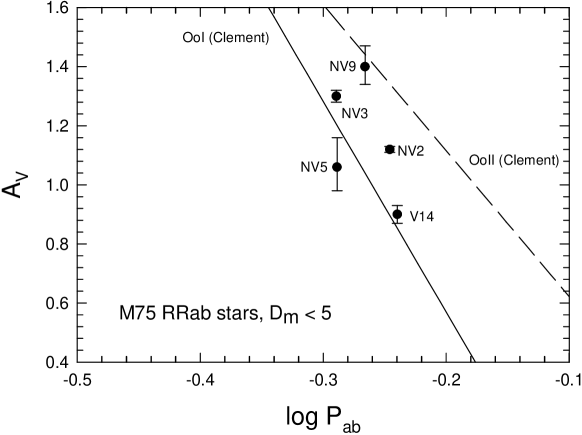
Clement & Shelton (1999) have found that the Bailey diagram for stars satisfying the Jurcsik-Kovács “compatibility condition” (i.e., with low values of ) provides a useful means to obtain the Oosterhoff class of a GC. How does this diagram look in the case of M75, once the “anomalous” stars (i.e., those with values of ) have been removed?
To answer this question, we had to pay special attention to the cases of V14, NV5, and NV9, for the values of these stars in the data were 4.1, 13.9, and 3.9, respectively, so they did not meet the criterion of (§2.2). The errors in their magnitudes were 0.0272, 0.1039, and 0.0801, respectively. We have used the errors in magnitude to recalculate the amplitudes assuming the stars in the isis reference image were brighter or dimmer by the amount corresponding to the errors in magnitude. For completeness, error bars were similarly computed for NV2 and NV3.
The resulting diagram is given in Figure 8. While the number of stars satisfying the compatibility condition is small, one can clearly see that the stars do not preferentially cluster around either of the OoI or OoII lines (kindly provived by C. Clement). Therefore, if we rely on the Clement & Shelton (1999) Oosterhoff classification scheme, we again find an indication that M75 is not of OoI type, better classifying as an Oo-intermediate globular.
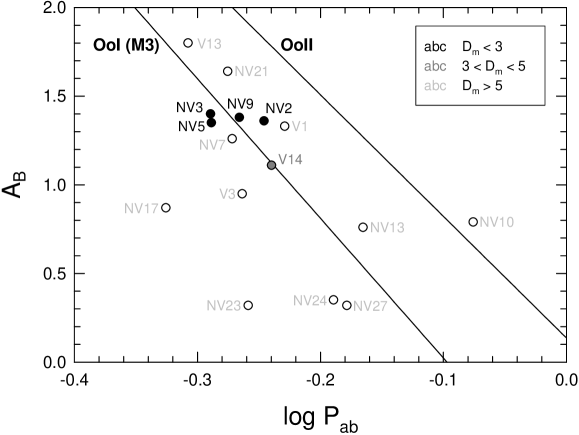
Borissova et al. (2001) found some surprising evidence that the position of a GC, in the Bailey diagram, may depend on whether or amplitudes are used. Is this the case for M75 as well?
In Figure 9, we plot the M75 Bailey diagram, focusing again on the RRab stars only. We used a gray-tone scheme for the symbols, with variables having largest values plotted in lighter gray. Unfortunately, the C. Clement lines are not available in the plane, so that we must use different reference lines as representative of the two Oosterhoff classes. Therefore, we followed the same approach as used in producing Figure 5.
Intriguingly, inspection of Figure 9 does not lead to a similar conclusion as Figure 8. The variables with “regular” light curves are now found to scatter around the OoI line, which is based on the M3 line derived by Borissova et al. (2001). NV3, which occupied an Oo-intermediate position in Figure 8, lies on a “sub-OoI” position in the new diagram. NV9, which was close to the OoII line, is now shifted down to a position close to the OoI line. The reason for this behavior is unclear, although it should be noted that the Borissova et al. M3 lines do differ from the C. Clement OoI lines, even when the amplitude is used. This is likely due to the fact that Clement based her selection criteria on the Jurcsik-Kovács compatibility criterion, whereas Borissova et al. only required that the variables showed no obvious indication of the Blazhko effect, or any other clear problems with their light curves.
As far as the OoII line goes, we can only point out that the relation used to transform amplitudes into amplitudes, from Layden et al. (1999), is probably not valid for the M75 variables, predicting too large amplitudes for a given amplitude. The Layden et al. relation was based on the Dickens (1970) photographic data for NGC 6171 (M107) stars. Using the Layden et al. relation we find that the derived amplitudes of the M75 RRab variables with are underestimated, in the mean, by (standard deviation). In any case, if our amplitudes are somehow incorrect due to problems with the derived isis light curves, the corresponding values, based as they are on the same light curves used to derive the amplitudes, should likely be very high—which they are not.
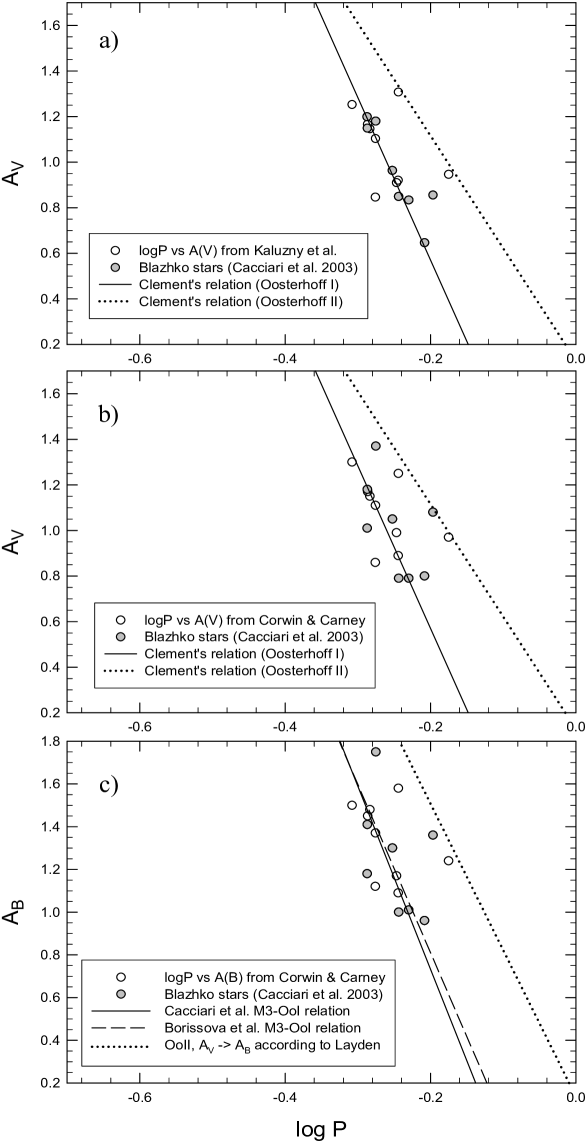
In order to further investigate this issue, we selected the variable stars from Kaluzny et al. (1998) with small values, since those appear to have been the ones primarily used by Clement & Shelton (1999) to derive their OoI line. These are shown in Figure 10a, in the plane. A few stars which, in spite of having small values, are Blazhko variables according to Cacciari, Corwin, & Carney (2003), are highlighted. The plot looks similar, though not identical, to Figure 1, top panel, in Clement & Shelton. In general, there is little scatter around Clement’s line, even if the Blazhko variables with small are included. One can see the two stars that Clement & Shelton call “Oosterhoff II” as well; they fall very close to Clement’s “OoII line,” which is actually based on Cen stars.
Next we plotted the very same diagram, for the very same stars, but using instead the amplitudes from Corwin & Carney (2001). The result can be seen in Figure 10b. One now finds a lot more scatter around Clement’s OoI line; four stars, instead of two, deviate toward the OoII region (but two of them are Blazhko variables, in spite of having small ). If one ignores these four stars, Clement’s OoI relation still provides a reasonable description of the mean behavior of the “OoI variables,” though one must now realize that there is somehow more scatter around the line than suggested in the Clement & Shelton (1999) original “Oosterhoff-classification” plot.
Finally, we again plotted the very same stars, but now in the diagram, in order to further investigate the reason for the differences between the M75 results in the diagrams using and (Figs. 8 and 9, respectively). The plot for M3 is shown in Figure 10c. The amplitudes come from Corwin & Carney (2001); Kaluzny et al. (1998) provided no amplitudes for their stars. For the “OoI line,” we used both the line that Cacciari et al. (2003) have obtained from the Corwin & Carney data, and the line from Borissova et al. (2001); they are very similar. For the OoII line, we transformed Clement’s relation to amplitudes using the relation from Layden et al. (1999), . What we find here may be relevant for the correct interpretation of the results from Figures 8 and 9. The main indications from Figure 10c are as follows: i) There is significant scatter, and the clustering of stars around the “Oo lines” does not appear as clear-cut as in Clement & Shelton (1999); ii) In this plane, the OoI line tends to provide more of an “upper bound” to the stars used by Clement & Shelton to obtain their OoI line than an actual description of their mean locus; iii) The “OoII line” based on the Layden et al. approach clearly fails to account for what Clement & Shelton call “OoII stars” in M3; such a line seems again to provide just an upper bound to the locus occupied by the “OoII stars.” A possible explanation may be that the Layden et al. relation may not be valid for M3 stars, either.
From these conclusions, and in order to obtain a completely equivalent diagnostic of Oosterhoff type as originally provided by Clement & Shelton (1999), we should probably apply slight shifts to both the OoI and OoII lines in the diagram. If we do this, the “Oo-intermediate” nature of M75, as suggested by the Clement classification scheme in the diagram, would perhaps be more strongly supported by the diagram as well. The main problem with this, of course, would be to interpret the reason why the OoI line, for the stars that Clement & Shelton used, might have to be slightly shifted towards smaller amplitudes in the plane, compared to the lines provided by Cacciari et al. (2003) and by Borissova et al. (2001).222As pointed out by the referee, it is important to note that the Oosterhoff classification according to the distribution of variable stars in the Bailey diagram is somewhat hampered by the scatter introduced by Blazhko RR Lyrae. The reason why the OoI line derived by Clement & Shelton (1999) needs to be shifted toward smaller amplitudes might depend on this effect. As a matter of fact, RR Lyrae stars attain their largest amplitude in the band, and therefore the spread in amplitude due to Blazhko RR Lyrae is larger in the band than in any other band. This means that accurate estimates of Oo mean lines in the vs plane may require even more accurate evaluations of the RR Lyrae affected by Blazhko RR Lyrae. On the other hand, the amplitudes themselves are also greater, so that the fractional effect upon scatter in the Bailey diagram may be little different for and .
Therefore, the Bailey diagram neither strongly supports nor rules out an Oosterhoff-intermediate classification for M75. Do the derived physical parameters for the RR Lyrae variables, based on the Fourier decomposition of their light curves, suggest that they are intermediate between OoI and OoII?
To answer this question, we compare the physical parameters of M75 with those similarly derived for other GCs in Tables 6 (RRc) and 7 (RRab). These tables represent up-to-date extensions of the compilations previously presented by Clement & Rowe (2000) for the RRc stars and by Kaluzny et al. (2000) for the RRab stars. To the RRc entries from Clement & Rowe, we have added values for NGC 6362 (Olech et al. 2001), M75 (this paper), NGC 6229 (Borissova et al. 2001), NGC 6934 (Kaluzny, Olech, & Stanek 2001), and NGC 2298 (Clement, Bezaire, & Giguere 1995). To the RRab entries from Kaluzny et al., we have added values for NGC 6362, M75, NGC 6229, and NGC 6934. In both Tables 6 and 7, the clusters are listed in order of decreasing metallicity, the latter having been obtained from the Harris (1996) catalogue. The metal-rich GCs NGC 6388 and NGC 6441, whose Oosterhoff class is unclear (Pritzl et al. 2001, 2002), are listed for completeness only; Trimble & Aschwanden (2001) classified them as “Osterhoff type III,” expanding on the suggestion by Pritzl et al. (2000) that these may be prototypes of a new Oosterhoff class, whose mean RRab periods are even longer than for OoII globulars.
Both Table 6 and Table 7 indicate normal values for the M75 RR Lyrae physical parameters, given its metallicity. Therefore, if one uses such parameters in order to provide guidance in obtaining the Oosterhoff classification of M75, the conclusion would be that the physical properties of the M75 variables are consistent with the cluster being OoI. In this case, the cluster’s HB not being anomalously bright with respect to other OoI clusters, and the mean temperature of the RRab’s also being similar to that for OoI clusters, we would be at a loss to explain why the RRab variables have longer periods than is typical for an OoI globular, and why its “normal” stars are shifted with respect to the OoI locus in the plane.
If M75’s HB is indeed not anomalously bright, the cause of the high -ratio that we found in Paper I must be related to the selective absence of bright red giants (compared to HB stars) in the regions over which the number counts were performed. On the basis of the current photometry, it seems that RGB stars could have a different radial distribution with respect to HB stars. This effect could be due to an observational bias or to the internal dynamics of the cluster. In order to clarify this issue, we are currently using HST archive data. The results of such an analysis, along with a full reevaluation of the number counts reported in Paper I, will be given in Ferraro et al. (2003, in preparation—Paper III). In any case, our preliminary revision of the HB number ratios indicate that the HB bimodality may be even more pronounced than indicated in Paper I.
Furthermore, if the brightness of M75’s HB is comparable to that in other OoI globulars, it immediately follows, from the discussion in Catelan, Sweigart, & Borissova (1998), that whatever the second parameter(s) that cause the HB bimodality in M75, it (they) must not have changed the brightness of the HB stars. Most second parameter candidates move stars vertically in the CMD at the same time as they “slide” them horizontally along the H-R diagram; this is the case, in particular, with the original helium abundance, helium mixing and core-mass changes (as due, e.g., to rotation of the cores of RGB stars; Mengel & Gross 1976). If any of these second parameter candidates were at play, being responsible for the extension of M75’s HB farther to the blue than is commonly the case among GCs of this metallicity, we would expect M75’s RR Lyrae to be brighter than in other OoI globulars. While this would be consistent with an Oo-intermediate classification for this cluster, it would obviously not explain why the Fourier decomposition parameters do not indicate the M75 RR Lyrae to be anomalously bright. In order to achieve a fully consistent picture, one might be forced to conclude that there are problems with the methods used to derive the physical parameters from the Fourier decomposition of the light curves, both for RRc and RRab variables. In fact, this is not totally unlikely: Challenging problems are indeed known to exist at the RRab side (e.g., Kolláth, Buchler, & Feuchtinger 2000), whereas, at the RRc camp, it is unclear whether the models used by Simon & Clement (1993) yield results that are consistent with the current generation of hydrodynamical RR Lyrae models; in fact, there is evidence that the Simon & Clement relations already break down for the RRc star U Comae (Bono, Castellani, & Marconi 2000). Unfortunately, it appears that one will have to wait until the Fourier decomposition methods of derivation of the physical parameters of RR Lyrae stars are placed on a more solid footing, before conclusively determining the Oosterhoff type of M75.
7 Summary
In the present paper, we have presented the first extensive CCD investigation of the variable star population in the GC M75 (NGC 6864). Several stars previously listed as variable and suspected to be RR Lyraes (V5, V6, V7, V10, and V15), do not appear to be variable on the time scale of a few days. We were able to derive periods and , light curves for nine priviously known RR Lyrae variables and for 29 newly discovered RR Lyrae variables. About half of the new discoveries we owe to an application of the image subtraction method developed by Alard (2000) and Alard & Lupton (1998), which does appear to be a very powerful tool to search for new variables and derermine their periods, especially in crowded regions such as the cores of GCs.
The confirmed RR Lyrae population in M75 consists of 13 RRc and 25 RRab stars. Although M75’s metallicity is typical for an OoI cluster, its unusually high average RRab period of 0.5868 d, its ratio of RRc to RRab stars (which is intermediate between OoI and OoII clusters) and its unusual HB morphology distinguish it from other OoI clusters. A Bailey diagram for the cluster is plotted in Figure 5 and variables whose position in the diagram appear to be anomolous are discussed. The positions of the (few) M75 variables which satisfy the compatibility criterion of Jurcsik & Kovács in the Bailey diagram also suggests that the cluster may be of Oo-intermediate type, since these variables do not cluster around the areas occupied by most RRab stars in either OoI or OoII clusters. However, the mean luminosity of the variables, according to the Fourier decomposition of their light curves, does not indicate a deviation from other “normal” OoI globulars. If confirmed, this would also imply that the anomalous -ratio of M75, as measured in Paper I, cannot be due to a high helium abundance; dynamical effects that somehow affect only RGB mass loss would have to be invoked. A more detailed investigation of the radial gradients and other indicators of dynamical effects in M75 will be carried out in the next paper of this series (Paper III).
References
- (1) Alard, C. 2000, A&AS, 144, 235
- (2) Alard, C. & Lupton, R. H. 1998, ApJ, 503, 325
- (3) Bellazzini, M., Fusi Pecci, F., Ferraro, F. R., Galleti, S., Catelan, M., & Landsman, W. B. 2001, AJ, 122, 2569
- (4) Bono, G., Caputo, F., & Stellingwerf, R. F. 1994, ApJ, 423, 294
- (5) Bono, G., Castellani, V., & Marconi, M. 2000, ApJ, 532, L129
- (6) Borissova, J., Catelan, M. & Valchev, T. 2001, MNRAS, 324, 77
- (7) Cacciari, C., Corwin, T. M., & Carney, B. W. 2003, in preparation
- (8) Carney, B. W. 2001, in Star Clusters, ed. L. Labhardt & B. Binggeli (Berlin: Springer), 1
- (9) Carretta, E. & Gratton, R. 1997, A&AS, 121, 95
- (10) Catelan, M. 1996, A&A, 307, L13
- (11) Catelan, M. 1998, ApJ, 495, 81
- (12) Catelan, M., Borissova, J., Sweigart, A. V., & Spassova, N. 1998, ApJ, 494, 265
- (13) Catelan, M., Borissova, J., Ferraro, F. R., Corwin, T. M., Smith, H. A. & Kurtev, R. 2002, AJ, 124, 364 (Paper I)
- (14) Catelan, M., de Freitas Pacheco, J. A., & Horvath, J. E. 1996, ApJ, 461, 231
- (15) Catelan, M., Sweigart, A. V., & Borissova, J. 1998, in ASP Conf. Ser. 135, A Half Century of Stellar Pulsation Interpretations, ed. P. A. Bradley & J. A. Guzik (San Francisco: ASP), 41
- (16) Clement, C. M., Bezaire, J., & Giguere, D. 1995, AJ, 110, 2200
- (17) Clement, C., et al. 2001, AJ, 122, 2587
- (18) Clement, C. M., & Rowe, J. 2000, AJ, 120, 2579
- (19) Clement, C. M., & Shelton, I. 1999, ApJ, 515, L85
- (20) Corwin, T. M., & Carney, B. W. 2001,
- (21) De Santis, R. 2001, MNRAS, 326, 397
- (22) Dickens, R. J. 1970, ApJS, 22, 249
- (23) Harris, W. E. 1975, ApJS, 29, 397
- (24) Harris, W. E. 1996, AJ, 112, 1487 (June 22nd, 1999 version)
- (25) Harris, W. E. 2001, in Star Clusters, ed. L. Labhardt & B. Binggeli (Berlin: Springer), 223
- (26) Jones, R. V., Carney, B. W., Storm, J., & Latham, D. W. 1992, ApJ, 386, 646
- (27) Jurcsik, J. 1995, AcA, 45, 653
- (28) Jurcsik, J. 1998, A&A, 333, 571
- (29) Jurcsik, J. & Kovács, G. 1996, A&A, 312, 111
- (30) Jurcsik, J. & Kovács, G. 1999, NewAR, 43, 463
- (31) Kaluzny, J., Hilditch, R. W., Clement C., & Rucinski, S. M. 1998, MNRAS, 296, 347
- (32) Kaluzny, J., Olech, A., & Stanek, K. Z. 2001, AJ, 121, 1533
- (33) Kaluzny, J., Olech, A., Thompson, I., Pych, W., Krzeminski, W., & Schwarzenberg-Cerny, A. 2000, A&AS, 143, 215
- (34) Kolláth, Z., Buchler, J. R., & Feuchtinger, M. 2000, ApJ, 540, 468
- (35) Kovács, G., & Jurcsik, J. 1996, ApJ, 466, L17
- (36) Kovács, G., & Jurcsik, J. 1997, A&A, 322, 218
- (37) Kovács, G., & Kanbur, S. 1998, MNRAS, 295, 834
- (38) Kovács, G., & Walker, A. R. 2001, A&A, 371, 579
- (39) Layden, A. C., Ritter, L. A., Welch, D. L., & Webb, T. M. A. 1999, AJ, 117, 1313
- (40) Lee, Y.-W., Demarque, P., & Zinn, R. 1990, ApJ, 350, 155
- (41) Mengel, J. G., & Gross, P. G. 1976, Ap&SS, 41, 407
- (42) Olech, A., Kaluzny, J., Thompson, I. B., Pych, W., Krzemiński, W., Schwarzenberg-Czerny, A. 2001, MNRAS, 321, 421
- (43) Olech, A., Woźniak, P. R., Alard, C., Kaluzny, J., & Thompson, I. B. 1999, MNRAS, 310, 759
- (44) Oosterhoff, P. 1939, Observatory, 62, 104
- (45) Petersen, J. O. 1986, A&A, 170, 59
- (46) Pinto, G., Rosino, L. & Clement, C. M. 1982, AJ, 87, 635
- (47) Pritzl, B. J., Smith, H. A., Catelan, M., & Sweigart, A. V. 2000, ApJ, 530, L41
- (48) Pritzl, B. J., Smith, H. A., Catelan, M., & Sweigart, A. V. 2001, AJ, 122, 2600
- (49) Pritzl, B. J., Smith, H. A., Catelan, M., & Sweigart, A. V. 2002, AJ, 124, 949
- (50) Pryor, C., & Meylan, G. 1993, in ASP Conf. Ser. 50, Structure and Dynamics of Globular Clusters, ed. S. Djorgovski & G. Meylan (San Francisco: ASP), 357
- (51) Rood, R. T., Crocker, D. A., Fusi Pecci, F., Ferraro, F. R., Clementini, G., & Buonanno, R. 1993, in ASP Conf. Ser. 48, The Globular Cluster–Galaxy Connection, ed. G. H. Smith & J. P. Brodie (San Francisco: ASP), 218
- (52) Sandage, A. 1981a, ApJ, 244, L23
- (53) Sandage, A. 1981b, ApJ, 248, 161
- (54) Sandquist, E. L. 2000, MNRAS, 313, 571
- (55) Sawyer Hogg, H. 1973, Publ. David Dunlap Obs, V. 3, No . 6
- (56) Simon, N. R. & Clement, C. M. 1993, ApJ, 410, 526
- (57) Smith, H. A. 1995, RR Lyrae Stars (Cambridge: Cambridge Univ. Press)
- (58) Stetson. P. B. 1994, PASP, 106, 250
- (59) Storm, J. Carney, B. W., & Beck, J. A. 1991, PASP, 103, 1264
- (60) Trimble, V., & Aschwanden, M. J. 2001, PASP, 113, 1025
- (61) VandenBerg, D. A., Swenson, F. J., Rogers, F. J., Iglesias, C. A., & Alexander, D. R. 2000, AJ532, 430
- (62) Walker, A. R. 1998, AJ, 116, 220
- (63) Zinn, R. & West, M. J. 1984, ApJS, 55, 45
Appendix A Notes On Individual Stars
V2, PRC82 – This star is bright and red relative to the RR Lyraes. It is not variable on the scale of a few days.
V5, PRC82 – This star is near the horizontal branch (HB) and red relative to the RR Lyraes. It is not variable on the scale of a few days.
V6, PRC82 – This star is near the HB and red relative to the RR Lyraes. It is not variable on the scale of a few days.
V7, PRC82 – This is two bright stars 3.6″apart. Neither star is variable on the scale of a few days.
V10, PRC82 – This star is near the HB and blue relative to the RR Lyraes. It is not variable on the scale of a few days.
V15, PRC82 – This star is near the HB and red relative to the RR Lyraes. It is not variable on the scale of a few days.
V16 and V17, PRC82 – These stars are red giants.
S1, S2, S3, and S4, PRC82 - These stars were checked for variability and found to be not variable on the scale of a few days.
NV3 – This RRab variable lies well into the RRc region of the instability strip (Fig. 6). This, together with the fact that its brightness places it above the mean level and that it has an unusually low ratio of the to amplitudes may indicate that it is a blended star.
NV7 – This RRab variable has a color well to the red of the instability strip (Fig. 6). This, together with the fact that its brightness places it above the mean level and that it has a high ratio of the to amplitudes may indicate that it is a blended star. Its value is high.
NV8 – This RRc variable is somewhat anomalous in Figure 4, in that it has a relatively long period for an RRc variable (0.3776 day) and yet it has a relatively high surface temperature ( mag). It also has an average magnitude well above the ZAHB level and is probably blended with a bluer star. The error in the phase difference does not stand out in comparison with the other RRc stars.
NV10 – This RRab variable has a unique position in the period-amplitude plane (Fig. 4). Its period is larger than for other variables with comparable amplitudes, indicating a more luminous star. It is in fact somewhat brighter than the mean for the other stars, as can be seen from Figure 6. This might indicate that it is a more highly evolved star, in which case it might be the progeny of one of the lower-mass modes of the M75 ZAHB mass distribution (see Paper I). NV10 has an appropriate position on the color-period plot (Fig. 3). Fourier analysis of its light curve was hampered by the presence of a gap in phase coverage in the range , which led to a spurious fit in that region.
NV17 – This RRab variable is at a position in the period-amplitude plane (Figure 4) that indicates an underluminous star. However its intensity-averaged magnitude indicates that it is bright relative to the other RR Lyraes. This might be explained by the fact that it is a foreground star, a blended star, or that it is a Blazhko variable at less than maximum amplitude. Its light curve suggests the possibility that it is a Blazhko variable. It has a value of , which is one of the lowest among the RRab with “anomalous” light curves, according to the Jurcsik-Kovács criterion.
NV18 – This variable has very unreliable photometry and its period and even its identification as an RRab variable are uncertain.
NV20 – This RRab variable has unreliable photometry and its period is uncertain.
NV22 – This RRab variable has unreliable photometry and its period is uncertain.
NV23 and NV24 – Like NV17, these RRab variables are in positions in the period-amplitude plane (Figure 5) that indicate underluminous stars while they are in fact relatively bright. Possible explanations, as with NV17, include their being foreground stars, blended stars, or Blazhko variables at less than maximum amplitude. The (uncertain) Fourier parameters indicate that both NV23 and NV24 have “anomalous” light curves (i.e., large values).
NV26 – This RRc variable has unreliable photometry and its period is uncertain.
NV28 – This RRc variable has an extremely small amplitude. Its positions in Figures 2, 4 and 5 do not indicate anything unusual about it otherwise. Because of the large scatter in the data, its period is uncertain.
NV29 – This RRc variable has very unreliable photometry and its period is uncertain. We have no data for this star.
NV 30 - This variable has very unreliable photometry and its period and variability type are uncertain. The shape of its light curve resembles that of an RS CVn variable. We have no data for this star.


| ID | (d) | Epoch (JD) | Comments | |||||||||
|---|---|---|---|---|---|---|---|---|---|---|---|---|
| v1 | 14 | -83 | 0.5901 | 2451379.696 | 1.33 | 18.311 | 18.250 | RRab | ||||
| v3 | 18 | 86 | 0.5451 | 2451379.501 | 0.95 | 0.73 | 18.308 | 18.278 | 17.831 | 17.810 | 0.477 | RRab |
| v4 | -18 | -85 | 0.2847 | 2451379.904 | 0.66 | 0.57 | 18.040 | 18.011 | 17.703 | 17.683 | 0.337 | RRc |
| v8 | -29 | -53 | 0.6503 | 2451379.403 | 0.54 | 17.812 | 17.797 | RRab | ||||
| v9 | 43 | -25 | 0.3492 | 2451379.713 | 0.70 | 0.63 | 18.055 | 18.030 | 17.751 | 17.729 | 0.304 | RRc |
| v11 | -121 | 85 | 0.2563 | 2451379.549 | 0.54 | 0.41 | 18.148 | 18.132 | 17.861 | 17.851 | 0.287 | RRc |
| v12 | 37 | 74 | 0.2706 | 2451379.530 | 0.66 | 0.54 | 18.146 | 18.125 | 17.865 | 17.848 | 0.281 | RRc |
| v13 | 127 | -59 | 0.4924 | 2451379.867 | 1.65 | 1.30 | 18.285 | 18.136 | 17.840 | 17.756 | 0.445 | RRab |
| v14 | 32 | -6 | 0.5758 | 2451379.670 | 1.11 | 18.223 | 18.163 | RRab | ||||
| nv1 | -9 | 56 | 0.5656 | 2451379.769 | RRab | |||||||
| nv2 | 1 | 39 | 0.5677 | 2451379.871 | 1.36 | 1.14 | 18.181 | 18.098 | 17.683 | 17.633 | 0.498 | RRab |
| nv3 | -7 | 25 | 0.5136 | 2451379.576 | 1.40 | 1.34 | 17.944 | 17.854 | 17.646 | 17.571 | 0.298 | RRab |
| nv4 | -27 | 8 | 0.2566 | 2451379.641 | 0.57 | 17.960 | 17.943 | RRc | ||||
| nv5 | 10 | -17 | 0.5144 | 2451379.482 | 1.35 | 18.110 | 17.999 | RRab | ||||
| nv6 | 15 | -20 | 0.6122 | 2451379.938 | 0.73 | 17.763 | 17.742 | RRab | ||||
| nv7 | -17 | -24 | 0.5349 | 2451379.665 | 1.25 | 0.86 | 18.371 | 18.298 | 17.698 | 17.665 | 0.673 | RRab |
| nv8 | 5 | -25 | 0.3776 | 2451379.967 | 0.30 | 0.30 | 17.205 | 17.200 | 16.969 | 16.964 | 0.236 | RRc |
| nv9 | 26 | -36 | 0.5421 | 2451379.813 | 1.38 | 18.096 | 18.014 | RRab | ||||
| nv10 | -14 | -40 | 0.8398 | 2451379.967 | 0.79 | 0.60 | 18.031 | 17.986 | 17.448 | 17.432 | 0.583 | RRab |
| nv11 | -34 | -42 | 0.2930 | 2451379.663 | 0.68 | 17.967 | 17.936 | RRc | ||||
| nv12 | 46 | 18 | 0.3536 | 2451379.765 | 0.68 | 0.50 | 18.204 | 18.178 | 17.767 | 17.752 | 0.437 | RRc |
| nv13 | 19 | 13 | 0.6834 | 2451379.862 | 0.76 | 18.319 | 18.290 | RRab | ||||
| nv14 | 15 | 4 | 0.2662 | 2451379.813 | 0.67 | 17.971 | 17.943 | RRc | ||||
| nv15 | 6 | -4 | 0.6262 | 2451379.600 | RRab | |||||||
| nv16 | 0 | -6 | 0.5651 | 2451379.720 | RRab | |||||||
| nv17 | -10 | -28 | 0.4724 | 2451379.680 | 0.87 | 17.548 | 17.515 | RRab | ||||
| nv18 | -11 | 5 | 0.5673 | 2451379.704 | RRab | |||||||
| nv19 | -13 | -4 | 0.3739 | 2451379.761 | 0.56 | 17.659 | 17.640 | RRc | ||||
| nv20 | -17 | 0 | 0.5969 | 2451379.643 | RRab | |||||||
| nv21 | -17 | -3 | 0.5304 | 2451379.908 | 1.64 | 18.118 | 17.969 | RRab | ||||
| nv22 | -1 | 6 | 0.6273 | 2451379.978 | RRab | |||||||
| nv23 | -4 | 8 | 0.5511 | 2451379.821 | 0.32 | 16.964 | 16.960 | RRab | ||||
| nv24 | -5 | -11 | 0.6468 | 2451379.707 | 0.35 | 17.154 | 17.150 | RRab | ||||
| nv25 | -1 | -13 | 0.5967 | 2451379.769 | RRab | |||||||
| nv26 | 0 | 3 | 0.2960 | 2451379.662 | RRc | |||||||
| nv27 | 42 | -71 | 0.6630 | 2451379.700 | 0.34 | 0.25 | 18.351 | 18.345 | 17.812 | 17.809 | 0.539 | RRab |
| nv28 | 15 | -30 | 0.2511 | 2451379.876 | 0.18 | 0.13 | 17.991 | 17.989 | 17.667 | 17.666 | 0.324 | RRc |
| nv29 | -11 | 6 | 0.3415 | 2451379.587 | RRc? | |||||||
| nv30 | -12 | -6 | 0.5642 | 2451379.390 | ? |
| ID | ||||||
|---|---|---|---|---|---|---|
| V4 | 0.153 | 0.090 | 0.067 | 4.691 | 1.705 | |
| V9 | 0.106 | 0.057 | 0.047 | 5.203 | 2.740 | |
| V11 | 0.149 | 0.013 | 0.018 | 4.611 | 2.656 | |
| V12 | 0.207: | 0.071: | 0.030: | 4.689: | 0.962: | |
| NV4 | 0.150 | 0.055 | 0.028 | 4.689 | 1.867 | |
| NV8 | 0.044 | 0.072 | 0.038 | 5.306 | 3.428 | |
| NV11 | 0.140 | 0.082 | 0.073 | 5.042 | 2.062 | |
| NV12 | 0.075 | 0.051 | 0.030 | 5.384 | 3.348 | |
| NV14 | 0.173 | 0.070 | 0.049 | 4.949 | 1.575 | |
| NV19 | 0.058: | 0.098: | 0.055: | 4.733: | 3.179: | |
| NV26 | ||||||
| NV28 | 0.012:: | 0.058:: | 0.023:: | 2.165:: | 5.298:: |
| ID | |||||||
|---|---|---|---|---|---|---|---|
| V1 | 0.486 | 0.290 | 0.163 | 2.586 | 5.494 | 2.139 | 161.80 |
| V3 | 0.457 | 0.191 | 0.047 | 2.975 | 0.038 | 1.796 | 117.91 |
| V8 | 0.376 | 0.157 | 0.042 | 2.648 | 5.749 | 3.127 | 118.16 |
| V13 | 1.089:: | 1.201:: | 0.846:: | 2.706:: | 4.405:: | 5.832:: | 160.72:: |
| V14 | 0.500 | 0.356 | 0.230 | 2.346 | 5.185 | 1.962 | 4.97 |
| NV1 | 0.564 | 0.395 | 0.226 | 2.724 | 5.905 | 2.695 | 10.49 |
| NV2 | 0.542 | 0.347 | 0.239 | 2.461 | 5.317 | 1.850 | 2.28 |
| NV3 | 0.502 | 0.365 | 0.236 | 2.347 | 5.099 | 1.526 | 2.52 |
| NV5 | 0.511 | 0.284 | 0.176 | 2.433 | 5.122 | 1.708 | 2.73 |
| NV6 | 0.460 | 0.281 | 0.109 | 2.659 | 5.590 | 2.486 | 6.30 |
| NV7 | 0.405 | 0.201 | 0.121 | 2.405 | 4.957 | 0.909 | 44.38 |
| NV9 | 0.527 | 0.373 | 0.232 | 2.402 | 5.146 | 1.629 | 2.71 |
| NV10 | 0.921:: | 0.774 | 0.659:: | 0.911:: | 2.374:: | 3.610:: | 100.57:: |
| NV13 | 0.416 | 0.199 | 0.056 | 2.646 | 5.741 | 2.822 | 111.79 |
| NV15 | 0.220: | 0.273: | 0.130: | 1.772: | 4.171: | 0.583: | 48.56: |
| NV16 | |||||||
| NV17 | 0.490 | 0.323 | 0.183 | 2.288 | 4.864 | 1.217 | 6.34 |
| NV18 | |||||||
| NV20 | |||||||
| NV21 | 0.525 | 0.326 | 0.231 | 2.202 | 4.637 | 0.899 | 40.03 |
| NV22 | |||||||
| NV23 | 0.491: | 0.277: | 0.113: | 2.763: | 5.568: | 1.727: | 30.52: |
| NV24 | 0.489: | 0.192: | 0.117: | 2.690: | 5.795: | 2.484: | 118.74: |
| NV25 | 0.624 | 0.335 | 0.252 | 2.611 | 5.204 | 1.847 | 8.91 |
| NV27 | 0.262 | 0.070 | 0.030 | 3.020 | 1.009 | 4.852 | 140.80 |
| ID | (K) | |||
|---|---|---|---|---|
| V4 | 0.588 | 1.665 | 7430 | 0.286 |
| V9 | 0.494 | 1.693 | 7311 | 0.284 |
| NV4 | 0.547 | 1.614 | 7551 | 0.304 |
| NV8 | 0.478 | 1.712 | 7261 | 0.280 |
| NV11 | 0.554 | 1.661 | 7430 | 0.289 |
| NV12 | 0.451 | 1.676 | 7345 | 0.292 |
| NV14 | 0.622 | 1.655 | 7464 | 0.287 |
| Mean |
| ID | [Fe/H] | |||||||
|---|---|---|---|---|---|---|---|---|
| V14 | 0.811 | 1.137 | 3.806 | 0.353 | 3.808 | 0.512 | 3.806 | |
| NV2 | 0.799 | 1.068 | 3.813 | 0.335 | 3.816 | 0.489 | 3.811 | |
| NV3 | 0.817 | 1.011 | 3.820 | 0.314 | 3.824 | 0.461 | 3.818 | |
| NV5 | 0.832 | 1.025 | 3.818 | 0.310 | 3.825 | 0.457 | 3.819 | |
| NV9 | 0.768 | 1.034 | 3.817 | 0.313 | 3.823 | 0.461 | 3.818 | |
| Mean |
| Cluster | Oo type | (K) | |||
|---|---|---|---|---|---|
| NGC 6441 | ? | 0.47 | 1.65 | 7408 | |
| NGC 6388 | ? | 0.48 | 1.62 | 7495 | |
| NGC 6362 | OoI | 0.53 | 1.67 | 7429 | |
| NGC 6171 (M107) | OoI | 0.54 | 1.65 | 7448 | |
| NGC 5904 (M5) | OoI | 0.54 | 1.69 | 7353 | |
| NGC 6864 (M75) | ? | 0.53 | 1.67 | 7399 | |
| NGC 6229 | OoI | 0.56 | 1.69 | 7315 | |
| NGC 6934 | OoI | 0.63 | 1.72 | 7290 | |
| NGC 5272 (M3) | OoI | 0.59 | 1.71 | 7315 | |
| NGC 6809 (M55) | OoII | 0.53 | 1.75 | 7193 | |
| NGC 2298 | OoII | 0.59 | 1.75 | 7200 | |
| NGC 4590 (M68) | OoII | 0.71 | 1.79 | 7145 | |
| NGC 7078 (M15) | OoII | 0.73 | 1.80 | 7136 |
| Cluster | Oo type | (K) | ||
|---|---|---|---|---|
| NGC 6441 | ? | 0.68 | 6607 | |
| NGC 6388 | ? | 0.66 | 6607 | |
| NGC 6362 | OoI | 0.86 | 6555 | |
| NGC 6171 (M107) | OoI | 0.85 | 6619 | |
| NGC 1851 | OoI | 0.80 | 6494 | |
| NGC 5904 (M5) | OoI | 0.81 | 6465 | |
| NGC 6864 (M75) | ? | 0.81 | 6529 | |
| NGC 6229 | OoI | 0.82 | 6478 | |
| NGC 6934 | OoI | 0.81 | 6455 | |
| NGC 5272 (M3) | OoI | 0.78 | 6438 | |
| NGC 6809 (M55) | OoII | 0.68 | 6325 |