The Radio Loud / Radio Quiet dichotomy: news from the 2dF QSO Redshift Survey
Abstract
We present a detailed analysis of a sample of radio-detected quasars,
obtained by matching together objects from the FIRST and 2dF Quasar
Redshift Surveys. The dataset consists of 113 sources, spanning a redshift
range , with optical magnitudes
and radio fluxes mJy.
These objects exhibit properties such as redshift and colour distribution in
full agreement with those derived for the whole quasar population, suggestive
of an independence of the mechanism(s) controlling the birth and life-time
of quasars of their level of radio emission.
The long debated question of radio-loud (RL)/radio-quiet (RQ) dichotomy is
then investigated for the combined FIRST-2dF and FIRST-LBQS sample, since they
present similar selection criteria. We find the fraction of radio detections
to increase with magnitude from % at the faintest levels up to
% for the brightest sources.
The classical RL/RQ dichotomy, in which the distribution
of radio-to-optical ratios and/or radio luminosities shows a lack of
sources, is ruled out by our analysis.
We also find no tight relationship between optical and radio luminosities for
sources in the considered sample, result that tends to exclude the mass of the
quasar black hole as the physical quantity associated to the level of
radio emission.
keywords:
galaxies: active - cosmology: observations - radio continuum: quasars1 INTRODUCTION
It was soon realized that not all the quasars, though first discovered by Schmidt in 1963 at radio wavelengths, are powerful radio sources (Sandage 1965). Several optically selected quasar samples have been observed in radio (e.g. Sramek & Weedman 1980; Condon et al. 1981; Marshall 1987; Miller, Peacock & Mead 1990; Kellermann et al. 1989), showing that typically only 10% - 40% of the quasars are radio detected.
From these studies it was suggested that quasars
can be divided into the two different populations of “Radio-Loud”
and “Radio-Quiet” on the basis of their radio emission.
Kellermann et al. (1989), performing
VLA observations of the Palomar-Green Bright Quasar Survey (the so-called PG
sample),
found that the radio-to-optical ratios of these objects – defined as the
ratio between radio and optical luminosity – presented a bimodal
distribution, clearly showing the occurrence of these two different
populations.
Miller, Peacock & Mead (1990) also found a dichotomy in the quasar population,
although this time based on radio luminosity as the parameter to define the
level of radio loudness.
A step forward in the study of the radio properties of quasars came with the
FIRST Survey with the VLA (Becker, White & Helfand 1995) which was able to
collect a large sample of quasars at faint flux levels.
Recent works based on this survey (FIRST Bright Quasar Survey; White et al.
2000 and Large Bright Quasar Survey; Hewett et al. 2001)
suggest that the RL/RQ dichotomy could be an effect
due to the brighter radio and optical limits of the previous studies.
The issue is however still under debate.
A recent work by Ivezic et al. (2002),
based on the cross-correlation of the Sloan Digital Sky Survey with the FIRST
Survey seems to find clear evidence for bimodality (see also Goldschmidt et
al. 1999).
From the theoretical point of view, despite the great advances in our ability of collecting unbiased sets of data, the physical mechanism(s) responsible for the radio emission in Active Galactic Nuclei is still unclear. It is generally accepted to be related to the processes of accretion onto a central black hole (BH) – the engine responsible for the optical-UV emission – but no correlation between radio and optical luminosity has been found so far in such objects (see e.g. Stocke et al. 1992). On the other hand, although controversial, there is some evidence for the fraction of radio-loud quasars to increase with increasing optical luminosity (Padovani 1993; La Franca et al. 1994; Hooper et al. 1995; Goldschmidt et al. 1999; but see also Ivezic et al. 2002 for a dissenting view), and more recent findings seem to identify the angular momentum of a spinning BH – extracted by a magnetic field – as the correct mechanism to provide the necessary energy to fuel radio jets (for a rewiew see Blandford 2000) and therefore turn a radio-quiet object into a radio-loud one.
A different approach deals with the possibility for radio loudness to be
connected with the intrinsic properties of the host galaxy.
Early studies in fact concluded that, while radio-loud quasars
reside in elliptical hosts, radio-quiet ones are mainly found in spiral
galaxies (Malkan 1984; Smith et al. 1986). Furthermore, it was observed a
preference for radio-quiet quasars to be located in environments considerably
less dense than those of radio-loud objects (Yee & Green 1987; Ellingson
et al. 1991).
More recent studies (Dunlop et al. 2002; Finn et al. 2001) however find
a very different picture whereby the hosts of both radio-loud and radio-quiet
quasars are massive elliptical galaxies with basic properties
(colors, environments, etc.) indistinguishable from those of quiescent,
evolved, low-redshift ellipticals of comparable mass.
The aim of this work is then to analyze a wide sample of radio detected quasars drawn from the joined use of the FIRST and 2dF QSO Redshift Surveys in order to answer some of the questions raised throughout this section, with particular emphasis on the issue of radio-quiet/radio-loud dichotomy.
The layout of this paper is as follows. In Section 2 we give a brief description of the FIRST and 2dF datasets and of the matching procedure used to cross-correlate them, while in Section 3 we analyse the properties of the sample obtained from the joined use of these two surveys. In Section 4 we study the dependence on redshift and optical luminosity of the fraction of radio-detected quasars and in Section 5 we discuss the problem of radio loudness with particular attention devoted to the issue of radio-loud/radio-quiet dichotomy. In Section 6 we summarize our conclusions. Throughout this paper we will assume , and .
2 The Datasets
2.1 The FIRST Survey
The FIRST (Faint Images of the Radio Sky at Twenty centimeters) survey (Becker et al. 1995) began in 1993 and will eventually cover square degrees of the sky in the North Galactic cap and equatorial zones. The beam-size at 1.4 GHz is 5.4 arcsec, with a rms sensitivity of typically 0.15 mJy/beam. Sources are detected using an elliptical Gaussian fitting procedure (White et al. 1997) with a detection limit of mJy. The positional accuracy in the FIRST survey is arcsec at the 3 mJy level, reaching the value of 1 arcsec only at the survey threshold.
The latest release (5 July 2000) of the catalogue covers 7988 square degrees of the sky, including most of the area , and , , and comprises approximately 722,354 sources down to a flux limit mJy. The surface density of objects in the catalogue is per square degree, though this is reduced to per square degree if one combines multi-component sources (Magliocchetti et al. 1998). The survey has been estimated to be 95 per cent complete at 2 mJy and 80 per cent complete at 1 mJy (Becker et al. 1995). Note that, as the completeness level quickly drops for flux levels fainter than 1 mJy, in the following analysis we will only consider sources brighter than this limit.
2.2 The 2dF Quasar Redshift Survey
For the purposes of this work we have considered the first release of the 2dF QSO Redshift Survey, the so called 2QZ 10k catalogue. A complete description of the catalogue can be found in Croom et al. (2001). Here we briefly recall its main properties. QSO candidates with were selected from the APM catalogue (Irwin, McMahon & Maddox 1994) in two declination strips centered on and , with colour selection criteria ; ; . Such a selection guarantees a large photometric completeness ( %) for quasars within the redshift range .
Redshifts for QSO candidates were determined via both cross-correlation of the
spectra with specific templates (AUTOZ, Miller et al. in preparation) and by
visual inspection. A flag was then assigned to each spectrum, where Q=1
corresponds to high quality identifications and redshift determinations, Q=2
means low-quality identifications and redshift determinations and Q=3
indicates no redshift assignment.
Only 2dF fields with a spectroscopic completeness (defined as the ratio
of objects observed in the field with Q=1 or Q=2 flags to the
total number of spectroscopically observed objects) of 85 per cent or greater
were included in this first release of the 2dF QSO catalogue. This corresponds
to a mean overall completeness of 93 per cent which – by also allowing for
sources not yet observed in the targeted fields – converts into an effective
area for the survey of 289.6 square degrees (see Croom et al. 2001).
The final catalogue contains objects with reliable (Q=1; Q=2)
spectral and redshift determinations, out of which are quasars
( % of the sample).
Whenever available, the 2QZ 10k catalogue also includes radio fluxes at
1.4 GHz from the NRAO VLA Sky Survey (NVSS; Condon et al. 1998) and X-ray
fluxes from the ROSAT All Sky Survey (RASS; Voges et al. 1999).
2.3 Matching Procedure
The overlapping region between the FIRST and 2dF Quasar Redshift Surveys is
confined to the equatorial plane: and .
Optical counterparts for a subsample of FIRST radio sources have
been obtained by matching together objects included in the radio catalogue
with objects coming from the APM survey (Maddox et al. 1990) in the considered
area (for a similar analysis see also McMahon et al. 2002).
By following this procedure, Magliocchetti & Maddox (2002) find 4075
identifications – out of a total of mJy radio sources – in the APM catalogue down to and for
a matching radius of 2 arcsec. This last value was chosen after a careful
analysis as the best compromise to maximize the number of real associations
(estimated to be %), and at the same time minimize the
contribution from spurious identifications down to a negligible 5 per cent.
While this procedure has been proved to work for the population of radio
sources as a whole since it mainly includes radio galaxies with point-like
radio structures (Magliocchetti et al. 2002), caution needs to be taken when
dealing with powerful radio sources such as quasars. These objects in fact
often show multiple components such as jets and/or hot-spots.
The algorithm introduced by Magliocchetti et al. (1998) and adopted in this
work to collapse sub-structured sources into single objects having radio
fluxes equal to the sum of the fluxes of the various components,
assigns positions to the final single-source products which correspond to
the median point between the different sub-structures.
Since multiple-component objects in general present quite complex morphologies,
it can be possible that a number of “collapsed” sources end up with radio
positions for their centroids which are displaced from their optical
counterpart by more than the originally chosen value of 2 arcsec.
For this reason, we relax the requirement on the matching radius to 5 arcsec
and consider as
true optical identifications all the radio-optical pairs offset by less than
this figure.
Following the above procedure, we end up with 1044 identifications
(hereafter called id-sample), down to a magnitude limit , which
optically show point-like structures typical of the population of QSOs
(see Magliocchetti & Maddox 2002 for further details).
Finally, in order to obtain redshift measurements and spectral features
for these sources, we looked for objects in the 2QZ 10k catalogue with
positions which differ by less than 2 arcsec from the optical positions of sources in
the id-sample. The choice of this value for the matching radius is based on
the 2 arcsec diameter of each 2dF fibre.
This procedure leads to 104 quasars included in the 2dF QSO catalogue and
endowed with radio fluxes mJy. The distribution of
offsets between optical and radio positions is shown in Figure 1.
Note that, despite the problems associated with multi-component structures
discussed in this section, the overwhelming majority (%) of
identifications still lie within 2 arcsec from the corresponding radio position. As
expected, only a few sources (almost all associated to multi-component
structures) present offsets .
As a final remark we note that, even though a choice for a larger matching radius in principle increases the number of spurious associations, this is not a concern in our analysis given the low space-density of 2dF quasars. In fact, for a 5 arcsec matching radius, the expected number of random coincidences on an area of 122 square degrees (effective area of the overlapping region between the FIRST and 2dF QSO Surveys) is about .

2.4 FIRST vs NVSS
To double check the reliability of our sample and to also investigate the different efficiency of the FIRST and NVSS surveys in detecting sources, we have then compared objects from the sample obtained as in section 2.3 with those sources included in the 2QZ 10k catalogue and endowed with a radio-flux measurement from NVSS.
42 sources from the combined FIRST-2dF dataset do not present
NVSS flux measurements in the 2QZ catalogue. A direct search for these objects
in the NVSS on-line database found 14 of them in the
flux range mJy. Out of these 14 sources,
three objects show multiple components and were therefore lost in the
2dF-NVSS matching procedure due to lack of a combining algorithm
for sub-structured objects. Three more are instead
single sources which show quite large radio-to-optical offsets ( arcsec).
The others are single objects with offsets arcsec and it is
not clear why they were not included in the 2QZ 10k catalogue.
The remaining 28 sources included in the combined FIRST-2dF catalogue show fluxes
mJy and were therefore lost by NVSS because of its relatively
bright ( mJy; Condon et al. 1998) flux limit.
Following the same procedure as above, we also found 9 of the 2dF quasars with NVSS fluxes to be missed by our matching procedure. After a direct search, it turned out that six of them are double/triple sources, with positions for the centroids (as assigned by our combining procedure) which were displaced from the centers of the optical emission by more than 5 arcsec. The last three objects are instead point-like sources with radio-to-optical offsets between 5 and 7 arcsec and therefore lost by our searching criteria. These 9 sources have been added to our original FIRST-2QZ 10k dataset and appear in Table 1.
As a final remark, note that the high resolution of the FIRST survey (beaming size 5.4 arcsec) might imply some of the flux coming from extended sources to be resolved out, leading to a systematic underestimate of the real flux density of such sources. In order to check for this effect, we have compared FIRST and NVSS (which, having a lower resolution – beaming size of 45 arcsec – should not be affected by this problem) fluxes for all the sources in the 2QZ 10k catalogue which show a radio counterpart in both of these radio surveys. The result of the comparison is shown in Figure 2. It is clear that the agreement between fluxes as measured by FIRST and NVSS is excellent and therefore no correction to the flux densities derived from the FIRST survey is needed.

3 The Samples
3.1 FIRST-2dF
Based on the procedure described in the previous section, the sample
derived from the joined use of the FIRST and 2dF QSO surveys is
constituted by 113 objects (hereafter called the FIRST-2dF sample)
with optical magnitudes and radio fluxes
at 1.4 GHz mJy. All the objects included in the
FIRST-2dF sample are presented in Table 1, whose columns respectively
indicate:
(1) 2dF name;
(2) Right Ascension, RA(J2000) and Declination, dec(J2000) which –
except for objects with multiple sub-structures where the
coordinates indicate the centroid of the source (obtained as in Magliocchetti et
al. 1998) – correspond to the FIRST radio coordinates;
(3) Offset (expressed in arcsec) of the optical counterpart in the
APM catalogue. An upper limit of 5 arcsec indicates those sources missed
by our matching procedure, but found in the 2QZ 10k catalogue, as explained in
section 2.4;
(4) magnitudes; (5) and (6) colours;
(7) Radio-flux density (in mJy) at 1.4;
(8) Redshift;
(9) Notes on the radio morphological appearance, where s stands for
point-like source, d for double source (i.e. presenting the
two characteristic lobes) and t indicates a core+lobes structure. This
information has been obtained by visual inspection of the images of each
source from the FIRST atlas;
(10) The radio spectral index , whenever available (see later in this
section).
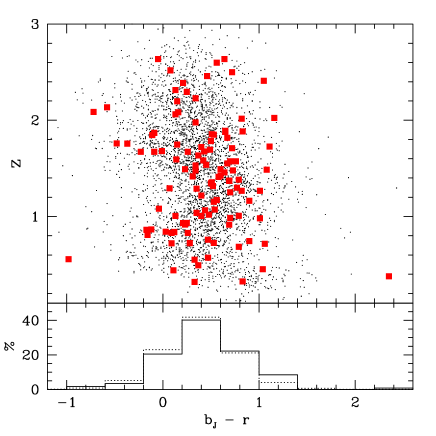
The redshift distribution of these sources is shown in the top panel of Figure 3 as a dotted line. For comparison, Figure 3 also shows the redshift distribution of the quasars from the 2QZ 10k catalogue found in the North Galactic Cap (indicated by the solid line). Interestingly, the two distributions present the same trend, as they both smoothly rise for , exhibit a maximum at about and then decline at higher redshifts. This could be suggestive of a similar fuelling mechanism which controls the birth and life-time of quasars, regardless of their radio-emission.
Note that the observed trend for the two redshift distributions beyond is biased by lack of completeness in the 2QZ 10k sample due to colour selection effects. For this reason, in the following analysis we will only consider objects in the redshift range . The total number of sources in the FIRST-2dF sample is then reduced to 94, which also includes 3 Broad Absorption Lines QSO (BAL).
The lower panel of Figure 3 shows the ratio between the two redshift distributions. This ratio is found to be % over the entire redshift range. As it will be extensively discussed in the following sections, the joined effects of selecting sources in the blue band and of using a relatively faint magnitude range, makes the above figure lower than what previously found in literature ( per cent; White et al. 2000; Hewett, Folz & Chaffee 2001; Ivezic et al. 2002).

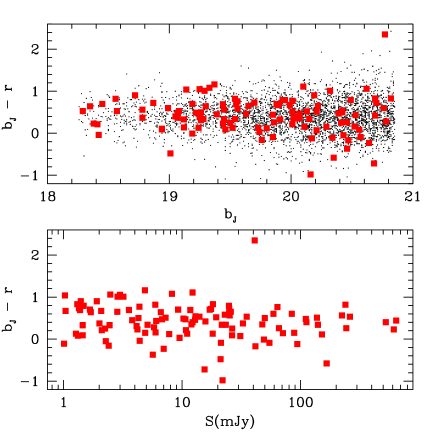
Figure 4 shows the distribution of colours for the
sample of FIRST-2dF quasars (filled squares) as a function of redshift (top
panel);
a large fraction of sources present values (see
lower panel), independent of redshift. For comparison,
the top panel in Fig. 4 also shows, in small dots, the distribution of
colours obtained for all the 2QZ quasars included in the
overlapping FIRST/2dF region (North Galactic Cap). As shown in Figure 5
the distribution of colours is also independent of apparent magnitude
and radio flux.
It is evident that radio-emitting sources follow
the same distribution as the one obtained for the quasar population as a whole,
suggestive of a radio activity not related to the colour of the
source.
Note that two objects present colours which greatly differ from the average
values, the first one showing and the second one having
. This is presumably due to their faint optical magnitudes
(found to be and respectively in the first and
second case), which allow for a non-negligible light contribution from
the host galaxy.
A further piece of information on the nature of sources in the FIRST-2dF sample
is given by the investigation of their radio spectral index
111Throughout this work we define the radio flux density as
.
In order to measure we searched
for observations performed at different (usually at 5 GHz) wavelengths
using NED (NASA/Ipac Extragalactic Database). Unfortunately, as objects in
our sample are relatively faint, we only managed to acquire radio fluxes at
5 GHz for the ten most luminous ( mJy; see Table
1) ones.
The distribution of their spectral indices is found to be completely uniform,
with five steep spectrum () and four
flat spectrum () sources, plus one object which presents a
negative value for the radio spectral index ().
As the remaining objects do not have any counterpart for radio
frequencies GHz, this suggests that sources in our sample
mainly present steep radio spectra, since values would make at least
some of them observable in surveys performed e.g. at 5 GHz.
With some confidence we can then assume
most of the quasars in the FIRST-2dF sample to have a steep spectrum and
associate them to a mean value for the radio spectral index, .
As a final step –
in order to facilitate comparisons between our
results and those found in literature – we decided to
convert magnitudes from the to the B band.
To compute the mean we used the composite quasar spectrum compiled
by Brotherton et al. (2001) from radio-selected quasars in the
FIRST Bright Quasar Survey (FBQS).
It turns out that in the redshift range
the difference between corresponding values in the
two bands is very small, , independent of
redshift. We therefore chose to apply a mean
correction .
Note that the k-correction in the B band has also been computed from the
Brotherton et al. (2001) composite quasar spectrum.
3.2 LBQS
In the previous section we have shown the main observational properties of the
FIRST-2dF quasars. Even though radio-emitting QSOs represent one
of the widest samples obtained so far, nevertheless – in order to increase the
statistics and cover larger portions of the plane –
we decided to combine our dataset with other existing samples.
Thanks to its selection criteria, the Large Bright Quasar Survey (LBQS) then comes as
the natural extension of our original dataset to
brighter magnitudes.
A detailed description of this survey
can be found in Hewett et al. (1995). Briefly, it consists of quasars optically
selected from the APM catalogue (Irwin et al. 1994) at bright ()
apparent magnitudes. Redshift measurements were subsequently derived for 1055
of them over an effective area of 483.8 square degrees. Due to the
selection criteria of the survey, quasars were detected over a wide redshift
range (), with a degree of completeness
estimated to be at the % level.
Recently, this sample has been cross-correlated with the FIRST radio survey (Hewett et al. 2001) by using a searching radius of 2.1 arcsec over an area of 270 square degrees. This procedure yielded a total of 77 quasars (hereafter called the FIRST-LBQS sample) with radio fluxes mJy, magnitudes in the range , and fractional incompleteness of % .
3.3 The Combined Sample
The joined FIRST-LBQS and FIRST-2dF samples span an extremely wide range in magnitudes – – providing a very good coverage of the plane. This can be seen in Figure 6 which represents the distribution of absolute magnitudes as a function of redshift for the two datasets. In the redshift range where our sample is complete () a wide portion of the plane is filled by sources, and this obtained with the advantage of using only two samples,drawn from the same parent catalogues (FIRST and APM) and with compatible selection criteria.

We remind here that low-redshift, low-luminosity quasars with
have their optical emission dominated by the host galaxy, and will therefore
be missed from the 2QZ catalogue as a result of the stellar appearance
selection criterion applied to the input catalogue.
Following the works by Boyle et al.(2000) and Croom et al.(2001), we then
exclude from the dataset all the low-luminosity quasars with .
As Figure 5 shows, this final sample exhibits a full
coverage of the plane, except for the narrow region at .
Note that the radio power-redshift plane (see Figure 7) is also widely covered;
only the region between is not entirely filled,
due to the 1 mJy flux limit of the FIRST survey.
To summarize, our final sample is made of 141 quasars, either coming from
the 2QZ 10k catalogue or from the LBQS dataset. These sources, brighter that
and , are found in the redshift range , and are endowed
with a radio counterpart in the FIRST catalogue with mJy.
The sample is estimated to be % complete with respect to the
optical selection criteria and spectroscopic data acquisition, and
80% complete in its radio component (with a completeness level reaching
100% for fluxes brighter than 3 mJy; see Becker et al. 1995).
In the following sections we will then exploit the potentialities of this sample,
homogeneous and deep both in radio and in optical, to investigate the
properties of radio-active quasars.

4 Fraction of Radio Detected Quasars
A key point on the properties of quasars is the determination of the fraction of
radio-emitting sources at a certain flux level, and its possible dependence
on redshift and optical luminosity.
As it was shown in Figure 3, from the FIRST-2dF sample we find
this fraction to be relatively small (%) when compared to previous
works ( per cent; White et al. 2000; Hewett, Folz & Chaffee 2001;
Ivezic et al. 2002), and independent of redshift.
The dependence of the fraction of radio-detected quasars on apparent B
magnitude is instead presented in Figure 8, both for the FIRST-LBQS
and the FIRST-2dF samples. Note that with “radio-detected” we indicate all the
quasars having radio fluxes greater then 1 mJy and therefore observed by FIRST.
As already noticed by Hewett et al. (2001), we find a significant decrement
for increasing magnitudes, with the fraction of radio-detections going from
% at B=17 to % at B=21.
These values are very different from the 25% of objects with magnitudes
deduced by White et al. (2000) from the First Bright Quasar Survey
(FBQS). However, Hewett et al. (2001) point out that by applying corrections for the
bandpass differences between the LBQS and the FBQS surveys (selected in and E band
respectively), the predicted fraction of
radio-detected quasars with magnitudes is found to be 15-17%,
which is close to the value obtained for the LBQS sample.
The observed behaviour of the fraction of radio-detected quasars
could be explained as either due to an intrinsic dependence of this fraction on
optical luminosity, as already suggested by Miller et al. (1990), or as simply given
by selection effects. In order to test these hypotheses,
in Figure 9 we have plotted the fraction of quasars from both the
2QZ 10k sample and the LBQS that have a counterpart
in the FIRST catalogue as a function of the
absolute magnitude , and for the two different redshift bins
and .
To minimize the selection effects, we have chosen to use only objects
with radio powers ,
since from Figure 7 it can be seen that the range
is not entirely filled with
sources due to the 1 mJy flux threshold of the FIRST.
It turns out that the fraction of radio-detected quasars is indeed dependent on their
optical luminosity: it grows from % in the case of
faint () objects, up to % for the most powerful
sources with . This trend is present in both of the redshift bins,
implying an optical luminosity function for the radio-detected quasars
flatter than the one measured for the quasar population as a whole.
This result is in agreement with what found by Goldschmidt
et al. (1999) from the Edinburgh Survey, who also observe the fraction of radio-detected
QSOs to slightly decrease for increasing look-back times.
Our data show something similar but,
because of the large error-bars associated to high optical luminosities, this
finding does not have great statistical significance.
In fact, if we perform a Kolmogorov-Smirnov (KS) test we find that, while
the hypothesis for the two samples of optical quasars and
radio-detected ones to have the same distribution in absolute magnitude
is discarded at a very high significance level (probability ),
the same test gives a probability of
for the data sets to be drawn from the same redshift distribution.


5 Radio Loudness
In this section we will tackle in more detail the issue of radio loudness,
with particular attention devoted to the problem of
RL/RQ dichotomy.
Two parameters have been proposed to define the radio-loudness of a quasar: the
first one is the radio-to-optical ratio defined as the ratio
between the rest frame radio luminosity at a given frequency and the
optical luminosity usually in the B band (Kellermann et al. 1989).
Miller et al. (1990) however argued that has a physical
meaning only if radio and optical luminosities are
linearly correlated, and therefore choose the radio power as a better
parameter to describe the level of radio loudness.
Several studies which used radio surveys at 5 and 8.5 GHz (Stocke et al. 1992; Padovani 1993; Hooper et al. 1995; Goldschmidt et al. 1999) argued for a gap in the distribution of radio powers and/or radio-to-optical ratios for the objects under exam. The same behaviour was also recently claimed by Ivezic et al. (2002). The presence of a bimodal distribution has been interpreted in the past as direct evidence for quasars to be divided into the two distinct populations of “radio-loud ” and “radio-quiet”, with different properties and probably also different mechanisms responsible for the radio emission. The threshold values at which the radio-quiet/radio-loud transition would happen have been inferred by these early works to be (corresponding to for objects with spectral index ) or .

It is worth remarking here that the above definitions are not equivalent. In fact,
if we consider our combined FIRST-2dF and FIRST-LBQS dataset and plot the
radio-to-optical ratio as a function of radio luminosity
(top panel of Figure 10), it becomes clear
that not all the sources (although still a great portion of them) satisfying
one of the two criteria can be accepted as radio-loud by the other one.
This is the reason why in the following sections – in order to assess the
possible presence of a RL/RQ dichotomy in our sample –
we will consider both the and distributions.
Note that if we apply the above definitions for radio loudness to the combined sample,
we then find % of the sources to be considered as “radio-loud”, with the
remaining objects probing part of the “radio quiet” regime.
As a last consideration before investigating in more detail the issue of dichotomy, we note that the distribution of radio-to-optical ratios for the combined sample is totally independent of both optical luminosity (middle panel of Figure 10) and redshift (bottom panel of Figure 10). This last finding is in agreement with the results obtained by White et al. (2000) for the First Bright Quasar Survey and Hewett et al. (2001) for the Large Bright Quasar Survey.

5.1 No Evidence for a Bimodal Distribution
The previous definitions of radio loudness were introduced in literature because
the distributions of radio power and for the objects under exam appeared to be
bimodal.
In order to test the presence of this bimodal behaviour in our dataset,
we have then considered the distribution of radio-to-optical ratios
for objects in the
combined sample. As Figure 11 illustrates, our data (shown by the solid
line) do not present any gap around , and the distribution
appears to be quite flat over a large range of radio-to-optical ratios,
the decline observed for being fully consistent with
effect of the 1 mJy flux limit of the FIRST survey.
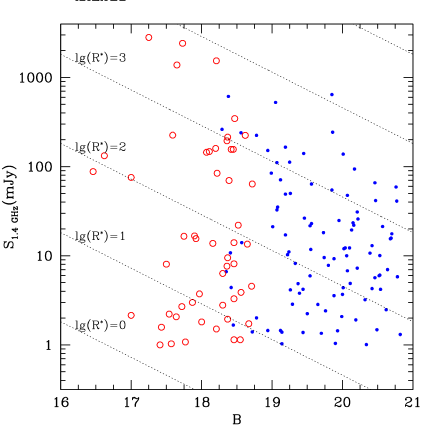
This effect becomes more clear if one considers Figure 12, where
the apparent optical magnitude
has been plotted as a function of the radio flux at 1.4 GHz both for the FIRST-2dF
and the FIRST-LBQS samples.
The dotted lines represent the loci of constant radio-to-optical ratio.
One can then see that the 1 mJy radio limiting flux
determines a loss of sources
which becomes progressively more relevant as the value of the
radio-to-optical ratio associated to such objects decreases.
To have an idea of the distribution of these “missing” sources, we
can plot (as shown by the dotted line in Figure 11) the distribution of
radio-to-optical ratios for those quasars found in the North Galactic Cap
of the 2QZ 10k Survey and in the Large Bright Quasar Survey which do not have a
counterpart in the FIRST catalogue, where
values for have been calculated by assuming an upper flux limit of 1 mJy.
We can reasonably conclude that
our data show no evidence for a gap,
in agreement e.g. with the White et al.(2000) results on the FBQS sample.
The presence of a bimodal distribution in
the population of quasars has been recently re-claimed by Ivezic et al.(2002)
who analysed a sample of
radio sources coming from the joined use of the FIRST and Sloan
Surveys. We believe their results to be highly biased by the cut
both in flux and in magnitude, which preferentially excludes sources with low
values of the radio-to-optical ratio and therefore generates an artificial
gap in the distribution of for
.
In fact, the authors select objects in a region of the apparent
magnitude-radio
flux plane enclosed by lines perpendicular to the loci of constant radio-to-optical
ratios (see their Figure 14). However, we argue that in order to obtain an unbiased
distribution, a weight should be applied to take into account
optical number counts,
since their steep rise for increasing magnitudes
determines a spurious detection of both the apparent peak at large values of
and a lack of sources with low radio-to-optical ratios.
No evidence for a “gap” is seen even if we use the radio-power as the parameter which separates quasars into radio-quiet and radio-loud ones. We remind here that the assumption for a bimodal distribution as expressed above would in fact imply a deficit of sources at radio luminosities (assuming a spectral index ). The absence of a gap is clearly shown in Figure 13. Again, the decline observed for is due to the lack of low-power sources in our sample caused by the 1 mJy completeness limit of the FIRST survey (see Fig. 7). Note that a very similar trend is obtained for quasars from the FBQS (dotted line in Figure 13). Because of the broader redshift range spanned by this survey (different selection criteria allow to also detect low – – redshift quasars), the FBQS can provide a better coverage of the faint end of the radio power distribution, even though the 1 mJy limit once again determines the decline of the distribution at low – – radio powers. It is nevertheless clear that none of the two distributions hints to the presence of a gap for , i.e. to a bimodal distribution for the quasar population.


An alternative way to look at this result is to consider the distribution of radio powers for the objects in our sample as a function of their optical luminosities. As Figure 14 shows, the coverage of the Lradio- Loptic plane is homogeneous, and the transition from those objects defined as “radio-loud” to those belonging to the “radio-quiet” population extremely smooth. Again, no gap is present, implying a continuous variation in the radio properties of quasars. This is in agreement with e.g. what found by Lacy et al. (2001) from the analysis of sources in the FBQS.
As a final remark, we note (see Figure 14) that there is no tight relationship between radio power and optical luminosity for the objects in our combined sample, since sources with a particular luminosity Loptic can be endowed with radio powers spanning up to three orders of magnitude. From the above result we can also have some hints that the radio properties of quasars are not related to the mass of the central blach hole. In fact, in the case of quasars it has been shown that the optical emission is tightly related to the bolometric one (Elvis et al. 1994). We can reasonably assume that these bright quasars are emitting close to the Eddington limit and in this case the bolometric luminosity can in turn be connected to the mass of the central black hole. Since we find a very spread relation between radio and optical luminosity, it seems unlikely that the mass of the central black hole dominates the level of radio emission.
6 Conclusions
We have presented a new sample of radio-emitting quasars, obtained by matching
together objects from the FIRST and 2dF Quasar Redshift Surveys. The dataset includes
113 quasars, found within the redshift range , with optical
magnitudes and radio fluxes at 1.4 GHz mJy.
This sample has then been combined with the FIRST-LBQS catalogue (Hewett et al. 2001)
in order to provide an
almost-complete coverage of the optical luminosity-redshift plane and increase the
statistical significance of our results. The main conclusions deriving from the joined
analysis of the two samples can be summarized as follows:
-
1.
The properties of radio-emitting quasars, such as their redshift distribution and colours, are in full agreement with those derived for the quasar population as a whole. This suggests the fuelling mechanism(s) responsible for the birth, colour and life-time of quasars to be independent of the level of radio emission.
-
2.
The fraction of radio detections decreases for fainter apparent magnitudes. This is also true if one considers the intrinsic luminosity of the sources, as the fraction of radio detections is found to grow from % at up to 20-30 % for the brightest () objects.
-
3.
The classical radio loud/radio quiet dichotomy, in which the distribution of radio-to-optical ratios and/or radio luminosities shows a “gap”, has been ruled out by our analysis. We found no lack of sources neither for nor for . Due to the selection effects – in particular the 1 mJy radio flux limit of the FIRST survey – we could not explore the low-P/low- regions of the distributions. However, at least in the observed ranges, it is suggestive of a smooth transition from the radio-loud to the radio-quiet regime.
-
4.
We find no tight relationship between radio and optical luminosity for the sources in our sample. For a given optical luminosity the scatter in the radio power is found to be more than three orders of magnitude. This result can give us some insight on the physical quantities responsible for the radio emission. In fact – since in the case of quasars the optical emission is tightly related to the bolometric one (Elvis et al. 1994), the bolometric luminosity ( under the assumption that quasars emit close to the Eddington limit) can in turn be connected to the mass of the central black hole – such a large scatter tends to exclude the mass of the central black hole as the relevant quantity which controls the level of radio activity.
It is clear that the above results – especially those concerning the radio-quiet/radio-loud dichotomy – need further investigation. While awaiting for wide-area surveys able to probe the low radio-power/low radio-to-optical ratio regime, we are testing the nature and behaviour of the radio emission of quasars, through Monte Carlo simulations. We plan to tackle this issue in a future paper.
Acknowledgments
We acknowledge the Italian MIUR and ASI for financial support.
References
- [Becker et al.1995] Becker R.H., White R.L., Helfand D.J., 1995, ApJ, 450, 559
- [Blandford2000] Blandford R.D., 2000, PTRSA, astro-ph/0001499
- [Boyle et al.2000] Boyle B.J., Shanks T., Croom S.M., Smith R.J., Miller L., Loaring N., Heymans C., 2000, MNRAS, 317, 1014
- [Brotherton et al.2001] Brotherton M.S., Tran H.D., Becker R.H., Gregg M.D., Laurent-Muehleisen S.A., White R.L., 2001, ApJ, 546, 775
- [Condon et al.1981] Condon J.J., O’Dell S.L., Puschell J.J., & Stein W.A. 1981, ApJ, 246, 624
- [Condon et al.1998] Condon J.J., Cotton W.D., Greisen E. W., Yin Q.F., Perley R.A., Taylor G.B., Broderick J.J., 1998, AJ, 115, 1693
- [Croom et al.2001] Croom S.M., Smith R.J., Boyle B.J., Shanks T., Loaring N.S., Miller L., Lewis I.J., 2001, MNRAS, 322, L29
- [Dunlop et al.2002] Dunlop J.S., McLure R.J., Kukula M.J., Baum S.A., O’Dea C.P., Hughes D.H., 2002, astro-ph/0108397
- [Ellingson et al.1991] Ellingson E., Yee H.K.C., Green R.F., 1991, ApJ, 371, 49
- [Elvis et al.1991] Elvis M., Wilkes B.J., McDowell J.C., Green R.F., Bechtold J., Willner S.P., Oey M.S., Polomski E., Cutri R., 1994, ApJS, 95, 1
- [Finn et al.2001] Finn R.A., Impey C.D., Hooper E.J., 2001, ApJ, 557, 578
- [Goldschmidt et al. 1999] Goldschmidt P., Kukula M.J., Miller L., Dunlop J.S., 1999, ApJ, 511, 612
- [Hewett et al. 1995] Hewett P.C., Foltz C.B., Craig B., Chaffee F.H., 1995, AJ, 109, 1498
- [Hewett et al. 2001] Hewett P.C., Foltz C.B., Chaffee F.H., 2001, AJ, 122, 518
- [Hoper et al. 1995] Hooper E.J., Impey C.D., Foltz C.B., Hewett P.C., 1995, ApJ, 445, 62
- [Irwin et al.1994] Irwin M.J., McMahon R.G., Maddox S.J., 1994, Spectrum, 2, 14
- [Ivezic et al. 2002] Ivezic Z., Menou K., Strauss M., Knapp G.R., Lupton H.R., vanden Berk D.E., Richards G.T.; Tremonti C., Weinstein M.A., Anderson S., et al., 2002, AJ, 124, 2364
- [Kellermann et al.1989] Kellermann K.I., Sramek R., Schmidt M., Shaffer D.B., Green R, 1989, AJ, 98, 1195
- [Lacy et al.2001] Lacy M., Laurent-Muehleisen S.A., Ridgway S.E., Becker R.H., White R.L., 2001, ApJL, 551, L17
- [La Franca et al.1994] La Franca F., Gregorini L., Cristiani S., De Ruiter H., Owen F., 1994, AJ, 108, 1548
- [Maddox et al. 1990] Maddox S.J., Efstathiou G., Sutherland W.J., Loveday J., 1990, MNRAS, 243, 692
- [Magliocchetti et al. 1998] Magliocchetti M., Maddox S.J., Lahav O., Wall J.V., 1998, MNRAS, 300, 257
- [Magliocchetti Maddox2002] Magliocchetti M., Maddox S.J., 2002, MNRAS, 330, 241
- [Magliocchetti et al2002] Magliocchetti M., Maddox S.J., Jackson C.A., Bland-Hawthorn J., Bridges T., et al., 2002, MNRAS, 333, 100
- [Malkan1987] Malkan M.A., 1984, ApJ, 287, 555
- [Marshall1987] Marshall H.L., 1987, ApJ, 316, 84
- [McMahon2002] McMahon R.G., White R.L., Helfand D.J., Becker R.H., 2002, ApJS, 143, 1
- [Miller et al.1990] Miller L., Peacock J.A., Mead A.R.G., 1990, MNRAS, 244, 207
- [Padovani1993] Padovani P., 1993, MNRAS, 263, 461
- [Sandage 1965] Sandage A., 1965, ApJ, 141, 1560
- [Schmidt 1963] Schmidt M., 1963, Nature, 197, 1040
- [Smith et al. 1986] Smith E.P., Heckman T.M., Bothun G.D., Romanishin W., Balick B., 1986, ApJ, 306, 64
- [Sramek 1980] Sramek R.A., & Weedman D.W., 1980, ApJ, 238, 435
- [Stocke et al. 1992] Stocke J.T., Morris S.L., Weymann R.J., Foltz C.B., 1992, ApJ, 396, 487
- [Voges et al. 1999] Voges W., Aschenbach B., Boller T., Bruninger H., Briel U., et al., 1999, AA, 349, 389
- [White et al.1997] White R.L., Becker R.H., Helfand D.J., Gregg M.D., 1997, ApJ, 475, 479
- [White et al.2000] White R.L., Becker R.H., Gregg M.D., Laurent-Muehleisen S.A., Brotherton M.S., et al., 2000, ApJS, 126, 133
- [Yee & Green1987] Yee H.K.C. & Green R.F., 1987, ApJ, 319, 28