11email: eduard_vorobev@mail.ru 22institutetext: Sternberg Astronomical Institute, Universitetsky prospect 13, Moscow, Russia; Isaac Newton Institute of Chile, Moscow Branch; Department of Physics, UTEP, El Paso, Texas, USA
22email: dmbiz@sai.msu.ru
Propagation velocities of gas rings in collisional ring galaxies
The propagation velocity of the first gas ring in collisional ring galaxies, i.e. the velocity at which the maximum in the radial gas density profile propagates radially in the galactic disk, is usually inferred from the radial expansion velocity of gas in the first ring. Our numerical hydrodynamics modeling of ring galaxy formation however shows that the maximum radial expansion velocity of gas in the first ring () is invariably below the propagation velocity of the first gas ring itself (). Modeling of the Cartwheel galaxy indicates that the outer ring is currently propagating at km s-1, while the maximum radial expansion velocity of gas in the outer ring is currently km s-1. The latter value is in marginal agreement with the measurements of Higdon (Higdon2 (1996)) based on HI kinematics. Modeling of the radial color gradients of the Cartwheel ring galaxy also indicates that the outer ring is propagating at km s-1 for the adopted distance to the galaxy of 140 Mpc. On the other hand, the azimuthally averaged surface brightness profile of the Cartwheel’s outer ring does not peak exterior to those in K- and B-bands, contrary to what would be expected for such a high propagation velocity. We show that a combined effect of 41∘ inclination, finite thickness, and warping of the Cartwheel’s disk might be responsible for the lack of angular difference in the peak positions. Indeed, the radial surface brightness profiles obtained along the Cartwheel’s major axis, where effects of inclination and finite thickness are minimized, do peak exterior to those at K- and B-bands. The angular difference in peak positions implies = 110 km s-1, which is in agreement with the model predictions. We briefly discuss the utility of radio continuum emission and spectral line equivalent widths for determining the propagation velocity of gas rings in collisional ring galaxies.
Key Words.:
Galaxies: individual: The Cartwheel – Galaxies: photometry1 Introduction
Collisional ring galaxies are thought to originate in galactic collisions. A near-central axial passage of a companion galaxy through the disk of a target galaxy initiates a series of expanding ring density waves both in gas and stellar components of the target galactic disk. An expanding ring gas density wave (hereafter, gas ring) triggers high rates of massive star formation along its perimeter, if the gas density exceeds a threshold (Appleton & Struck-Marcell Appleton (1987)). The propagation velocity of gas ring, i.e. the velocity at which the maximum in radial gas density profile propagates radially in the galactic disk, is usually inferred from the radial expansion velocity of gas in the ring. Indeed, kinematical models predict that a determination of the radial expansion velocity of an individual star or HII region in the first ring gives a good indication of the ring propagation velocity (Toomre Toomre (1978)). This is usually not true for higher order rings. However, rings are rather wave phenomena than material features, which implies a possible difference between the ring propagation velocity and the radial expansion velocity of particles forming the ring. Indeed, recent N-body modeling of ring galaxy formation by Athanassoula et al. (Athan (1997)) have shown that the propagation velocity of the first stellar ring is usually higher than the mean velocity of stellar particles in the ring. Hence, the propagation velocity of the first gas ring may also not coincide with the radial expansion velocity of gas in the ring. If so, this would have important implications for the age estimates of collisional ring galaxies (hereafter, ring galaxies), since in many well-known systems, most notably in the Cartwheel, the rings are essentially a gas dynamical phenomenon.
In this paper we attempt to estimate the propagation velocity of gas ring from the optical and near-infrared photometry, as well as non-thermal radio emission and spectral line equivalent widths of ring galaxies. If an expanding gas ring indeed triggers high rates of star formation as predicted by Appleton & Struck-Marcell (Appleton (1987)), then its propagation velocity might be inferred from the properties of young stellar component formed in the ring. In Sect. 2 we explore the utility of the radial optical and near-infrared color gradients measured in the Cartwheel’s disk (Marcum et al. Marcum (1992)) for estimating the propagation velocity of the Cartwheel’s outer ring. In Sect. 3 we determine the relationship between the propagation velocity of the first gas ring and the maximum radial expansion velocity of gas in the ring. The Cartwheel’s radial surface brightness profiles in Ks-band, B-band and are compared with those predicted by a density wave model in Sect. 4. In Sect. 5 we discuss the utility of radio continuum emission and spectral line equivalent widths for determining the propagation velocity of gas rings in ring galaxies. Our main results are summarized in Sect. 6.
2 Radial optical and near-infrared color gradients in the Cartwheel’s disk
Theory of ring galaxy formation predicts that in gas-rich galactic disks an expanding ring gas density wave might trigger a co-existing expanding wave of star formation (Appleton & Struck-Marcell Appleton (1987)). As such a density-wave-induced ring wave of star formation propagates radially from the nucleus, it leaves behind evolved stellar populations, with the youngest stars located at the current position of the wave. This might result in a radial color distribution of stars in the galactic disk, with the inner regions being redder than the outer parts of the disk. Indeed, observations of the Cartwheel ring galaxy (Marcum et al. Marcum (1992)) and some other ring galaxies (Appleton & Marston Marston (1997)) revealed the presence of the optical and near-infrared radial color gradients in the galactic disks.
Recent attempts by Korchagin et al. (Korch2 (2001)) and Vorobyov & Bizyaev (VB (2001), hereafter VB) to model the Cartwheel’s radial color gradients using the above scenario yielded a clear success. One of the results of Korchagin et al. (Korch2 (2001)) was to show that the model radial color gradients are sensitive not only to the metallicity of star-forming gas, but also to the propagation velocity of gas ring. Indeed, faster rings are expected to produce younger stellar populations provided that the rings have propagated to the same diameter in the galactic disk. This motivated us to investigate the utility of the Cartwheel’s radial color gradients for estimating the ring propagation velocity.
In our previous paper (VB) we postulated the propagation velocity of the Cartwheel’s outer ring as an average of all the available measurements (55 km s-1) and varied the metallicity of star-forming gas in the Cartwheel’s disk in order to find a better agreement between the model and observed radial color gradients. In this paper we perform a more comprehensive modeling of the Cartwheel’s radial color gradients and color indices by varying the propagation velocity as well. Our intuitive expectations are that the Cartwheel’s radial color gradients cannot be reproduced equally well for any value of the outer ring propagation velocity. If so, we would be able to estimate the outer ring propagation velocity from the available optical and near-infrared photometry of the Cartwheel ring galaxy. The equations and methods used to model the colors and color indices are explained in detail in VB and references therein. The population synthesis code used in this work is explained in detail in Mayya (Mayya (1995), Mayya2 (1997)). Using stellar evolutionary (Schaller et al. Schaller (1992)) and atmospheric (Kurucz Kurucz (1992)) models, this code synthesizes a number of observable quantities in the optical and near-infrared passbands, which are suitable for comparison with the observed properties of giant star-forming complexes. Since the Cartwheel is a recent phenomenon, this code is especially suitable for our purposes. The results of this code are compared with those of other existing codes by Charlot (Charlot (1996)).
A major difference of our modeling from that of VB is in the adopted distance to the galaxy, with the value of a Hubble constant being = 65 km s-1 Mpc-1 instead of 100 km s-1 Mpc-1. The need for this change comes from the realization that the results of our modeling depend on the adopted distance to the galaxy. For example, choice of km s-1 Mpc-1 instead of km s-1 Mpc-1 would double the linear diameter of the Cartwheel’s disk. The time it takes for the density wave of constant propagation velocity to cross the Cartwheel’s disk would grow accordingly, which will inevitably influence the colors of density-wave-born stellar populations in each radial annulus of the Cartwheel’s disk. There are distinct signs of convergence between different estimates of a Hubble constant to the value of km s-1 Mpc-1 (Binney & Merrifield Binney (1998)). Therefore, in this work we adopt km s-1 Mpc-1, which assumes 140 Mpc for the distance to the Cartwheel galaxy.
We consider several propagation velocities of the outer ring starting from 25 km s-1 and ending with 120 km s-1. We focus on three values, namely 25 km s-1, 55 km s-1, and 90 km s-1 as implied by the measurements of gas expansion velocity by Amram et al. (Amram (1998)), Higdon (Higdon2 (1996)), and Fosbury & Hawarden (FH (1977)). For each value of propagation velocity we explore a wide range of metallicities from to in order to achieve a better agreement between the model and observed photometry. The properties of the pre-collision stellar disk are chosen typical for the late-type Freeman disks, with the V-band central surface brightness and the scale length kpc respectively. In this paper we do not model the colors of the Cartwheel’s inner ring and the nucleus, as it requires additional assumptions on the star formation history in the Cartwheel (see VB for details).
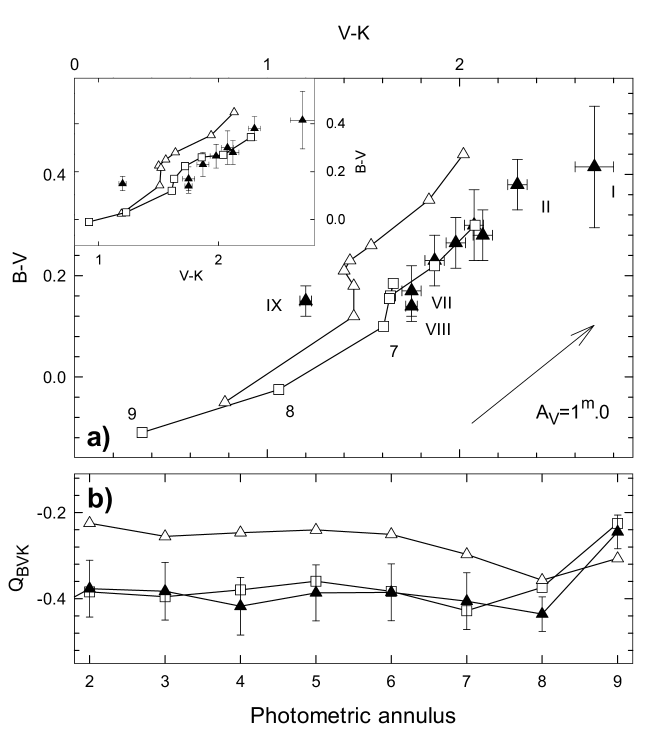
The Cartwheel’s and the model colors/indices obtained for the outer ring propagation velocity of 25 km s-1 and 90 km s-1 are shown in Fig. 1. Open triangles in Figs. 1a and 1b represent the model radial color gradients and combined color indices obtained for km s-1, while the open squares indicate the corresponding values obtained for km s-1. For the latter velocity, the model colors of three outermost annuli are indicated in Fig. 1a by Arabic numbers. The filled triangles with error bars represent the radial color gradients and combined color indices of the Cartwheel ring galaxy. The Cartwheel’s colors were obtained by Marcum et al. (Marcum (1992)) for nine annuli and the nucleus (see their Plate I) and numbered in Fig. 1a according to radius, beginning with the inner ring (annulus I) and ending with the outer ring (annuli VIII-IX).
The fast outer ring can nicely reproduce the Cartwheel’s indices, if metallicity gradient of star-forming gas ranges from in the inner parts (annuli II-IV) to in the outer parts (annuli V-IX). The indices minimize the uncertainties in the observed colors introduced by dust extinction. Hence, a good correspondence between the model and the Cartwheel’s indices indicates that the difference in each annulus between the model colors shown in Fig. 1a by the open squares and the Cartwheel’s colors might be due to dust extinction in the Cartwheel’s disk. The value of color excess implied by this difference can be used to estimate the surface densities of gas in each annulus using standard gas-to-dust ratio (Bohlin et al. Bohlin (1978)). The estimated surface densities of gas are below the detection upper limits for each annulus, which indicates that internal extinction is indeed responsible for the difference between the Cartwheel’s colors and the model colors shown in Fig. 1a by the open squares.
On the other hand, the slow outer ring cannot reproduce the Cartwheel’s indices. Disagreement between the model and Cartwheel’s indices is less severe, if metallicity gradient of star-forming gas ranges from in the inner parts (annuli II-IV) to in the outer parts (annuli V-IX). Nevertheless, the model indices shown by the open triangles in Fig. 1b lie beyond the observed limits, which indicates that the difference in each annulus between the model colors shown in Fig. 1a by the open triangles and the Cartwheel’s colors cannot be attributed to dust extinction in the Cartwheel’s disk.
We considered other propagation velocities of the outer ring and found that the Cartwheel’s colors and color indices could be acceptably reproduced for 55 km s120 km s-1. The best-fit value is km s-1. Stellar populations born in each annulus by a slower wave are older than those born by a faster wave. Strong dependence of colors on the age of young stellar populations allows us to constrain the propagation velocity of the Cartwheel’s outer ring.
Three assumptions can possibly influence our color modeling results: the assumed properties of the pre-collision stellar disk, the adopted value of a Hubble constant, and the population synthesis model used in color gradient modeling.
a) The pre-collision stellar populations. To understand how the model colors depend on the properties of the pre-collision disk, we gradually reduced down to 23.5 mag and increased up to 5 kpc imitating transition from the late-type galactic disk to the low surface brightness (LSB) disk. Again, for km s-1 the model colors and indices totally disagree with those of the Cartwheel galaxy. The acceptable agreement between the model and the Cartwheel’s radial color gradients and color indices is found for higher propagation velocities of 90 km s-1, though the model indices tend to lie systematically above the observed values. This again favors to the pre-collision Cartwheel being a normal late-type galaxy rather than a LSB galaxy (VB).
b) Distance to the Cartwheel. We recomputed the model colors for a Hubble constant of km s-1 Mpc-1, which assumed 90 Mpc for the distance to the Cartwheel galaxy. The adopted distance to the Cartwheel affects the model radial color gradients. A general tendency is that the acceptable agreement between the model and the Cartwheel’s colors and indices can now be achieved for lower values of the ring propagation velocity, more specifically, for km s-1. The best-fit value is now km s-1. For the ring propagation velocities higher than 90 km s-1, the correspondence between the model and the Cartwheel’s colors/indices of the four outermost annuli worsens.
c) Population synthesis model. We tested our results of color gradient modeling with another population synthesis code, namely Starburst99 (Leitherer et al. Leitherer (1999)). This code was developed for synthesizing observable quantities in starburst galaxies. Since the Cartwheel harbors a moderate burst of star formation ( yr-1), Starburst99 is best suited for comparison with the code assumed in this work ( Mayya Mayya (1995)). The results of color modeling with Starburst99 are plotted in the insert of Fig. 1a for both the fast outer ring ( km s-1, the open squares) and the slow outer ring ( km s-1, the open triangles). It is clearly evident that the fast outer ring can well reproduce the Cartwheel’s colors. On the contrary, the slow outer ring cannot reproduce the Cartwheel’s optical and near-infrared colors. Starburst99 uses a new atmospheric model of Lejeune et al. (Lejeune (1997)) and the latest Geneva evolutionary models, which are different from those used by Mayya in his population synthesis code (Mayya Mayya (1995)). Nevertheless, the results of color modeling with both codes are very similar. Hence, our main conclusions are not affected by the population synthesis model assumed in this work.
Direct estimate of the Cartwheel’s outer ring propagation velocity from the color gradient modeling performed in this section is problematic since our results are sensitive to the assumed value of a Hubble constant. Nevertheless, our modeling indicates that the propagation velocity of the Cartwheel’s outer ring cannot be lower than 40 km s-1 for any reasonable value of a Hubble constant. Determining the ring propagation velocity may be in fact even more difficult, because it may not coincide with the expansion velocity of gas in the ring. Indeed, rings are rather wave phenomena than material features (Athanassoula et al. Athan (1997)) and the difference between the ring propagation velocity and the radial expansion velocity of particles forming the ring is not totally unexpected. In the next section two dimensional numerical simulations of a Cartwheel-like ring galaxy are performed. We restrict ourselves to the planar geometry in order to find the relationship between the maximum radial expansion velocity of gas in the ring and the propagation velocity of the gas ring itself.
3 Numerical simulations of a Cartwheel-like ring galaxy
3.1 Initial conditions
An extensive study of the Cartwheel galaxy by Higdon (Higdon1 (1995), Higdon2 (1996)) provided important observational constrains on the parameters of our numerical model. The indicative mass of the Cartwheel, which generally represents the total mass to within a factor of about 2, is for the adopted km s-1 Mpc-1 (Higdon Higdon2 (1996)). An estimate of the luminous stellar mass in the Cartwheel is derived by multiplying its blue luminosity (Higdon Higdon1 (1995)) by a late spiral ratio =3 (Faber & Gallagher Faber (1979)). This results in . The total HI mass of the Cartwheel is (Higdon Higdon2 (1996), corrected for km s-1 Mpc-1), with the total gas mass () amounting to . The Cartwheel galaxy thus appears to be halo-dominated. This assumption was also used by Appleton & Higdon (Appleton2 (1993)) in their hydrodynamic models of the Cartwheel galaxy.
We consider a Cartwheel-like galaxy consisting of a self-gravitating thin gaseous disk of and a rigid halo of . Marcum et al. (Marcum (1992)) found no evidence for old pre-collision stellar populations in the outer parts of the Cartwheel. Numerical modeling of the radial color gradients confirmed that the pre-collision stellar populations dominate only in the inner parts of the Cartwheel (VB). Moreover, our numerical simulations indicate that stellar density waves propagate only 2-3 disk scale lengths and become significantly less defined as compared to gas density waves, the result also found in numerical simulations by Hernquist & Weil (HW (1993)). Hence, we expect that the stellar density wave would have little effect on the dynamics of gas at the radii of the Cartwheel’s outer ring.
The radial distribution of gas in the pre-collision Cartwheel is unknown. Our modeling of radial color gradients measured in the Cartwheel’s disk (VB) suggested that this distribution most probably showed a mild exponential decline with a surface density contrast between the nucleus and the position of the outer ring being a factor of 3.5. More importantly, the lack of old stellar component at the outer parts of the Cartwheel implies that the surface density of gas in the pre-collision Cartwheel was below the critical surface density for gravitational instability everywhere except probably the innermost radii. The critical surface density is defined as
| (1) |
where is the speed of sound and is the epicyclic frequency (Martin & Kennicutt Martin (2001)).
Initially, the rotating gaseous disk is balanced by self-gravity of the disk, the radial pressure gradient, and gravity of the spherically symmetric rigid halo
| (2) |
where is the rotational velocity, is the gas pressure, is the halo potential, and is the potential of gaseous disk defined in the polar coordinates as
| (3) | |||||
We adopt an isothermal equation of state (), which is an usual approximation used for modeling the interstellar medium in disk galaxies (Mihos & Hernquist Mihos (1994)). Struck (Struck (1997)) has demonstrated that the ring structure and dynamics in the isothermal and non-isothermal simulations are similar. We also tried an adiabatic equation of state and found little difference in the first ring structure and dynamics, though the second ring structure and dynamics showed substantial differences with respect to the isothermal case.
A slightly modified form of rotation curve in a softening point-mass potential is adopted
| (4) |
where is the effective halo radius. The power index 0.9 allows us to model a Keplerian decline in rotation curves at larger radii. Parameters of the rotation curve (eq. 4) are chosen so that the halo mass
| (5) |
is equal to . As the rotational curve is fixed by eq. (4) and the disk potential is determined by numerically integrating eq. (3), the gradient of halo potential can be calculated using eq. (2). Parameters used in numerical simulations are listed in Table 1.
| Parameter | Value |
|---|---|
| Inner disk radius () | 0.2 kpc |
| Outer disk radius () | 34 kpc |
| Disk scale length () | 20 kpc |
| Central surface density of gas ( | 23.5 |
| Gas temperature () | |
| Disk mass () | |
| Halo mass () | |
| Mass of a companion () | |
| Companion’s softening parameter () | 5 kpc |
3.2 Computational techniques
We use the ZEUS-2D numerical hydrodynamics code incorporating a self-gravitating thin gaseous disk and a fixed spherically symmetric halo potential. A usual set of isothermal hydrodynamics equations in the polar coordinates () is solved using the method of finite-differences with a time-explicit, operator split solution procedure explained in detail in Stone & Norman (Stone (1992)). The interaction is treated by computing the gravitational force exerted on the disk by the softened point-mass potential of a companion galaxy. Equations of motion of the companion in the combined gravitational potential of the halo and the gaseous disk are numerically solved using the Runge-Kutta scheme. The gravitational potential of the thin disk (eq. 3) is evaluated numerically using the fast Fourier transform (Binney & Tremaine 1987). The code was verified against a standard set of test problems described in Stone & Norman (Stone (1992)).
3.3 Results of modeling.
We attempt to find the relationship between the propagation velocity of ring gas density wave and the maximum radial expansion velocity of gas in the wave generated by a near central passage of a companion galaxy through the disk of a Cartwheel-like galaxy. We have chosen the model parameters typical for the Cartwheel galaxy in order to compare the results of numerical simulations with those of Sect. 2. By varying the initial rotation curve, the mass of a companion, and the impact point we try to reproduce the morphology, kinematics, and radial distribution of gas in the Cartwheel’s disk. Below we briefly describe the parameter space investigated in our simulations.
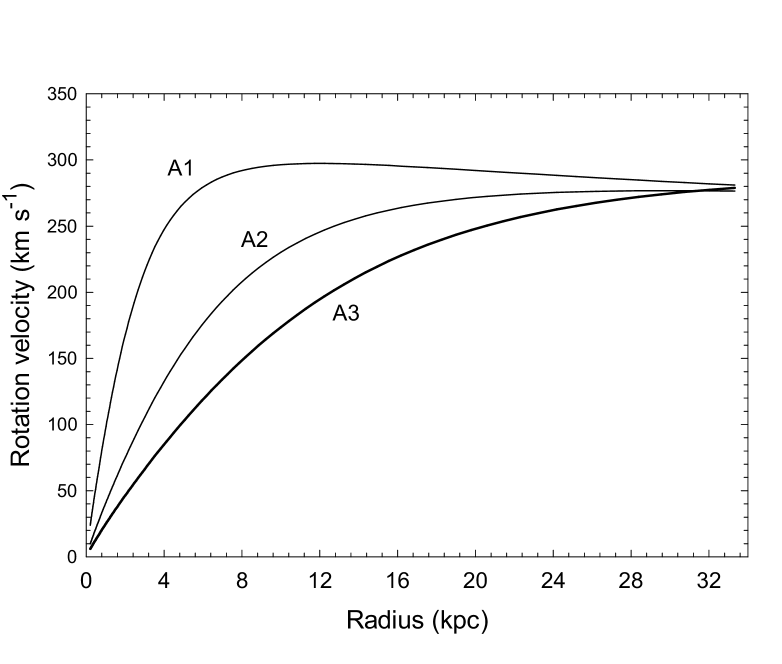
Initial rotation curve. We consider three initial rotation curves shown in Fig. 2 and find that the Cartwheel’s HI morphology and kinematics are best reproduced for A2 curve. A1 curve produce too small a spacing between the inner and outer rings as compared to that of the Cartwheel, while A3 curve does not develop the inner ring at all.
Mass of a companion. We consider a wide range of companion galaxy masses from to , which is roughly of the Cartwheel’s total mass. The indicative mass of a companion G3, most massive in the Cartwheel’s group (Higdon Higdon2 (1996)), is . This mass is not enough to reproduce the radial surface density profiles of HI in the Cartwheel. Such a low-mass companion gives a weak first response, with less than a enhancement in gas densities over the unperturbed values. At the time when the first ring reaches 24 kpc radius (the current location of the Cartwheel’s outer ring), the actual mass of gas locked in the ring is only of the total gas mass, while in the Cartwheel the outer ring contains about 85% of total HI (Higdon Higdon2 (1996)). The low mass companion does not reproduce the observed spacing between the inner and the outer Cartwheel’s rings, with the radius of the model second ring being almost twice bigger than that of the Cartwheel’s inner ring.
We find that companions with masses no less than of the Cartwheel’s total mass can acceptably reproduce the HI distribution in the Cartwheel’s disk. In our simulations the companion’s mass is , which is roughly of the total mass of the Cartwheel. A companion generates stronger response, with more than a 100% enhancement in gas surface densities over the unperturbed values. There are no companions to the Cartwheel large enough to fit the companion’s mass we determine. The companion’s optical and HI line widths give mass estimates that are only of the Cartwheel’s (Davies & Morton Davies (1982), Higdon Higdon2 (1996)). However, determining accurate galaxy masses is difficult enough in strongly perturbed galaxies like the Cartwheel’s companions. Passing through the Cartwheel’s disk causes the companion to lose mass due to tidal and ram pressure stripping. Indeed, Higdon (Higdon2 (1996)) reported HI plumes stretching from the Cartwheel toward G3 companion. Ring galaxy simulations by Tsuchiya et al. (Tsuchiya (1998)) found that massive companions ( of ring galaxy’s mass) can loose around of their halos, or nearly a third of their total mass, due to the interaction. The gas disks in massive companions were also greatly truncated ( of original radius). If much of the companion’s mass resided in a halo, one would in fact significantly underestimate its total mass. The apparent low masses of the companion galaxies are a problem, but it is likely to be a consequence of the ring galaxy formation process. More work is clearly needed in estimating masses of ring galaxy companions to see if this is a general result.
Impact points, impact angles, and relative velocities. In our simulations the companion placed initially at a distance of 35 kpc above the Cartwheel’s plane, which was roughly of the Cartwheel’s radius, was given an initial relative velocity of 80 km s-1 toward the Cartwheel. Varying the initial distances from the axis of the Cartwheel, we obtained a wide range of impact points starting from a nearly bull’s-eye collision (=0.1 kpc) and ending with an essentially off-center collision (=10 kpc). The former produces symmetric rings with negligible azimuthal variations in gas surface densities around the ring, while the latter results in crescent or spiral-like density waves. Neither of these ultimate cases resembles the actual HI distribution in the Cartwheel’s outer ring. We find that the Cartwheel’s HI kinematics and morphology are best reproduced for a slightly off-center =2.5 kpc collision. The relative velocity of the companion at the time of impact is 480 km s-1. We also considered other distances above the Cartwheel’s plane and other relative velocities as the initial parameters of the companion. For the initial distance of 70 kpc and initial relative velocity of 80 km s-1 toward the Cartwheel, the relative velocity at the time of impact was km s-1. For the initial distance of 35 kpc and initial relative velocity of 380 km s-1 toward the Cartwheel, was 610 km s-1. Hence, is largely determined by the parameters of the Cartwheel. Variations of in the relative velocity affect insignificantly the gas dynamics after the collision. Angles of impact from the axis of the Cartwheel are 5-15∘ in all considered cases. We have not made special efforts to model highly inclined collisions.
See figure3.gif
Figure 3 shows the model velocity field of gas superimposed on the contour plot of gas surface density obtained for A2 curve and model parameters listed in Table 1. The contrast between in the outer ring and the inter-ring region is in agreement with observations. between the rings in Fig. 3 never exceed 7 pc-2 and falls below 5 pc-2 behind the densest regions in the outer ring. Maximum and average around the outer ring are 18.5 and 15 pc-2, however the observed high density condensations up to 60 pc-2 are not found in simulations. is below 7 pc-2 beyond the outer ring. High density clumps are found in the inner ring and central regions, with 60-100 pc-2 and even higher. Development of such high density clumps is interesting, since high densities and low temperatures are thought to favor HI transitions in giant gas clouds. Indeed, Horrellou et al. (Horellou2 (1998)) detected a substantial amount of molecular hydrogen in the Cartwheel’s inner part. For the solar metallicity implied by color gradient modeling in Sect. 2, mass within the inner ring amounts to according to Horellou et al. (Horellou2 (1998)). In our simulations, the inner ring contains of the gas mass or , which is roughly consistent with the detected mass. In Sect. 3.1 we neglected a possible contribution of molecular hydrogen to the gas mass of the Cartwheel as it was only a small fraction to the total mass of the Cartwheel galaxy () and would not affect noticeably the companion’s dynamics.
While the inner ring in Fig. 3 has on average higher surface densities of gas than the outer ring, it contains less than of the total disk mass. On the contrary, the outer ring in Fig. 3 comprises more than of the total disk mass. No obvious spokes were obtained for either of three initial rotation curves. Indeed, HI observations of Higdon (Higdon2 (1996)) have shown that the Cartwheel’s spokes are HI poor. The solid line in Fig. 3 outlines the regions where exceeds the critical surface density for gravitational instability defined by eq. (1). The regions where star formation is supposed to occur correlate with the regions of maximum in the outer ring. This is not the case for the Cartwheel, where a pronounced anticorrelation between and surface brightness was found (Higdon Higdon2 (1996)). Among other reasons such as a blow-out in giant supershells formed by multiple supernova explosions, this might be explained as the consumption of the gas supply by the starburst. Inclusion of star formation processes in the code is required to check this hypothesis.
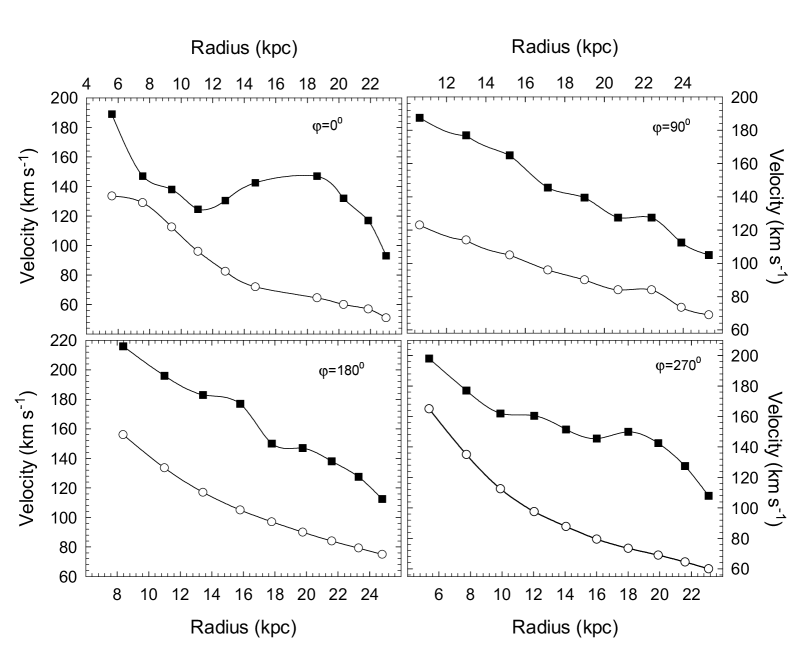
The velocity field in Fig. 3 shows all basic features of HI kinematics found in the Cartwheel: (1) a general increase in expansion velocity of gas for kpc, (2) inflow of gas towards the inner ring for kpc. The flow of gas inside the inner ring is complicated. However, a general expansion of gas is clearly seen in this innermost region. We determine the relationship between the propagation velocity of the outer ring (i.e. the propagation velocity of gas density wave) and maximum radial expansion velocity of gas in the outer ring at different ring expansion phases. The regions of maximum density enhancements in the outer ring are used to trace the outer ring position during the runs. We start from very early times when the outer ring was only kpc in radius and stop at the outer ring current position of kpc. Due to obvious asymmetric structure of in Fig. 3, these velocities were traced along four different polar angles of , , , and . The results are shown in Fig. 4. The propagation velocities of the outer ring (the filled squares) are systematically higher than the maximum radial expansion velocities of gas in the ring (the open circles). Both velocities generally decline as the outer ring propagates outwards. At the time when the outer ring reaches its current location at the radius of 24 kpc, and slow down on average to 102 km s-1 and 65 km s-1 respectively. However, sinusoidal azimuthal variations in the values of both velocities are evident in Fig. 4. The value of km s-1 is consistent with the estimates of Sect. 2, where best agreement between the the model and observed radial color gradients was found for km s-1. The value of km s-1 is close to the upper estimate of Higdon (Higdon2 (1996)) based on HI kinematics in the Cartwheel’s outer ring. The value of km s-1 obtained by Amram et al. (Amram (1998)) using kinematics of ionized gas stands apart. It is known that dynamics of different interstellar phases may considerably differ in disk galaxies. Inclusion of multiphase gas dynamics and star formation in the code is needed to determine the dynamical properties of ionized gas in ring galaxies.
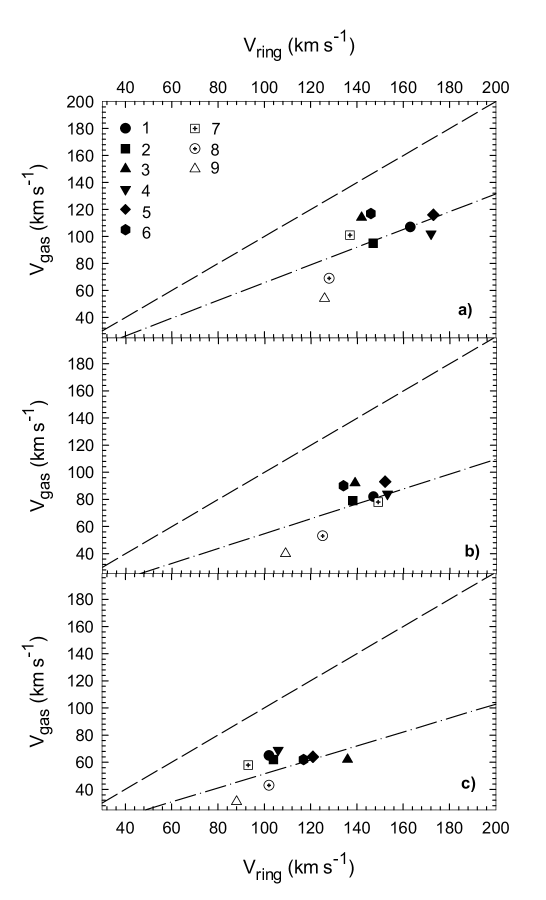
We performed a series of computations with different values of , , , , and different initial rotation curves. In Figs. 5a-5c we plot the maximum expansion velocities of gas in the ring at the radii of 12 (the upper frame), 18 (the intermediate frame), and 22 kpc (the lower frame) as a function of the azimuthally averaged propagation velocities of the first ring at the same radii. Parameters of each run labeled by Arabic numbers in Fig. 5a are listed in Table 2. Impact points and impact angles vary slightly in the range 1.5-3 kpc and 5-15∘ respectively. We find that the inequality holds in all cases, though the resulted morphology and kinematics of gas may hardly resemble those of the Cartwheel. Both velocities are generally higher at the smaller radii and they decline at the larger radii. Higher mass companions produce a stronger response with higher ring propagation velocities and maximum radial expansion velocities of gas in the ring, thus leaving the relation between them unchanged. It appears that the inequality holds for the first gas rings triggered by the passage of a companion through the disk of a halo-dominated target galaxy. The least-squares fit to a linear function shown in each panel of Fig. 5 by a dash-dotted line gives for the rings of 12 kpc, for the rings of 18 kpc, and for the rings of 24 kpc. A linear function is plotted for comparison in each panel of Fig. 5 by a dashed line. We also considered gas rings in ring galaxies with comparable disk and halo masses, for which we obtained an average value of for the rings of 12, 18, and 24 kpc. In higher order resonant rings (i.e. the second rings) the flow is more complicated and inequality is no more valid. The inequality contradicts the predictions of a simple kinematical model of ring galaxy formation, which argues that a determination of the expansion velocity of an individual star or HII region in the first ring gives a good indication of the ring propagation velocity (Toomre Toomre (1978)).
Higdon (Higdon2 (1996)) reported the narrow HI line widths and the absence of strong shear in the Cartwheel’s outer ring. He concluded that the outer ring appeared to initiate star formation activity primarily through concentration of the interstellar medium in the ring rather than through high-speed disruptive cloud collisions ( km s-1) as advocated by Olson & Kwan (Olson (1990)) for starburst activity in interacting/merging galaxies. Apparent lack of molecular hydrogen in the outer ring (Horellou Horellou (1995)) argues against compact dense clouds. Hence, we have chosen a smooth initial gas distribution for the pre-collision Cartwheel rather than a clumpy medium. In the wider context of a disparity in ring propagation velocity versus gas expansion velocity in ring galaxies, the inequality has to be proved for a clumpy gas distribution. In this connection, sticky particle codes (Combes & Gerin Combes (1985)) could be very useful. We note here that N-body simulations of stellar rings in ring galaxies by Athanassoula et al. (Athan (1997)) have also shown that the expansion velocity of the first stellar ring is usually higher than the mean velocity of stellar particles constituting the ring (their Fig. 17, the upper frame). Hence, a disparity in ring propagation velocity versus expansion velocity of gas/stars constituting the ring might be a general property of ring galaxies.
| N | |||||||||
|---|---|---|---|---|---|---|---|---|---|
| 1 | 3 | 50 | 15 | 20 | A2 | 163 | 107 | 102 | 65 |
| 2 | 3 | 50 | 15 | 20 | A1 | 147 | 95 | 104 | 62 |
| 3 | 3 | 50 | 15 | 10 | A2 | 142 | 114 | 136 | 62 |
| 4 | 3 | 50 | 15 | 100 | A2 | 172 | 102 | 105 | 68 |
| 5 | 3 | 50 | 21 | 20 | A2 | 173 | 116 | 121 | 64 |
| 6 | 3 | 50 | 15 | 20 | A3 | 146 | 117 | 117 | 62 |
| 7 | 6 | 45 | 15 | 20 | A2 | 137 | 101 | 93 | 58 |
| 8 | 3 | 50 | 10 | 20 | A2 | 128 | 69 | 102 | 43 |
| 9 | 3 | 50 | 7.5 | 20 | A2 | 126 | 54 | 88 | 31 |
1 in .
2 in kpc.
3 Rotation curve as labeled in Fig. 2.
4 and at 12 kpc radius.
5 and at 22 kpc radius (position of the Cartwheel’s outer ring).
The inequality for the first gas ring in ring galaxies has an important implication. Measurements of the radial expansion velocity of gas in the Cartwheel’s outer ring based on HI and kinematics appear to underestimate the true propagation velocity of the outer ring. Moreover, the radial expansion velocity of gas itself may be underestimated. Indeed, is derived assuming that all the gas motions are in the plane of the ring. The plane geometry neglects any non-planar component of that may be present in warped rings. Results of numerical experiments performed by Struck (Struck (1997)) indicate that the Cartwheel’s disk might be slightly warped. Hence, the measurements of gas expansion velocity in the Cartwheel’s outer ring may underestimate , which in turn underestimates the true propagation velocity of the outer ring. The same might be true for other ring galaxies. If so, ring galaxies are generally younger than they have been previously thought. If rings are younger then we can expect to see even fewer of them - they should be relatively rarer.
4 Radial B-band, K-band, and surface brightness profiles of the Cartwheel galaxy
Marston & Appleton (Marston2 (1995)) found that unlike normal galaxies the azimuthally averaged radial intensity profiles in and K-band of most ring galaxies peak at the position of the ring. Specifically, for the majority of ring galaxies the peak in the radial profile lies at the larger radii than the peak in the K-band radial profile. Indeed, a standard scenario of ring galaxy formation predicts that the K-band and peaks in radial intensity profiles of density-wave-born stellar populations are spatially separated, with the peak in lying on the leading edge of the wave where most star formation takes place, and the peak in K-band lying progressively behind the wave as the density-wave-born stellar populations evolve (Korchagin et al. Korch (1998)).
See figure3.gif
Applying the model used to compute radial color gradients in Sect.2, we found that the linear difference between the K-band and peak positions depends not only on the wave velocity, but also on the metallicity of star-forming gas. Specifically, this difference is proportional to the wave velocity. For metallicities of star-forming gas below 1/5 of the solar there is no peak in K-band at the position of the ring and the model K-band radial surface brightness profile shows a monotonous decline at all radii. The peak appears at higher metallicities and becomes more pronounced with increasing metallicity. In Fig. 6 we present the model azimuthally averaged radial surface brightness profiles of the Cartwheel galaxy in K-band (filled squares), B-band (open circles), and (filled triangles). All model parameters of the gas density wave and pre-collision stellar populations are chosen as in Fig. 1. The model surface brightness profiles peak at/near the position of the Cartwheel’s outer ring at 24 kpc. Analysis of Fig. 6 indicates that the difference between the and K-band peak positions is expected to be around 1.1 kpc (1.65′′) for the adopted distance of 140 Mpc and the outer ring propagation velocity of 90 km s-1. The peak difference is 0.7 kpc (1.05′′). We note here that the underlying ring stellar density wave may influence the peak position in K-band. To exclude this effect, density-wave-born stellar populations must dominate the ring emission, which appears to be the case for the Cartwheel galaxy (Marcum et al. Marcum (1992), VB).
We compare our model predictions with the actual angular differences between the peaks in the azimuthally averaged B-band, Ks-band and radial surface brightness profiles of the Cartwheel’s outer ring. Images of the Cartwheel together with the calibrating frames were obtained from the public archives. The near-infrared images in Ks-band were provided by ESO VLT archive. Images in the HST’s WFPC2/F450W (B) band were taken from the Hubble Space Telescope archive. Hereafter, we refer to this band as the ”B-band”. Images in and ”-free continuum” were provided by the CFHT archive. All the data were reduced in the standard way. Since we were interested only in determining the angular difference between the peak positions in different passbands, the flux calibration was not applied. All the images were aligned using the standard MIDAS routines. The estimated accuracy of alignment is better than 0.03′′. Finally, an angular resolution of 0.76′′ was achieved for the image. When the B and Ks images are considered separately from the image, a better resolution of is achieved. At the adopted distance of 140 Mpc, this corresponds to a spatial resolution of 500 pc for the image and 300 pc for the images in Ks- and B-bands.
See figure3.gif
Figure 7 shows the image of the Cartwheel galaxy in Ks-band. The north is down and the east is to the right. As is seen in Fig. 7, the geometrical center of the outer ring does not coincide with the nucleus. To take this peculiar morphology into account, a series of elliptical annuli were constructed, with the smallest ellipse centered on the nucleus and the centers of larger ellipses slightly shifted so as the largest ellipse is centered on the geometrical center of the outer ring. These elliptical annuli were then used to determine the azimuthally averaged Ks-band, B-band, and radial surface brightness profiles shown in Fig. 8.

Surprisingly, we find no noticeable angular difference between the peak positions of the azimuthally averaged radial surface brightness profiles in the Cartwheel’s outer ring, contrary to what is expected from our modeling (see Fig. 6). Absence of such a difference is also evident in Fig. 4 of Higdon (Higdon1 (1995)). This implies that either the outer ring velocity is too slow for this difference to be resolved or considerable inclination of the Cartwheel acts to smear out this difference. Indeed, if the Cartwheel’s disk is warped (Struck Struck (1997)), then the elliptical annuli might not be a good choice for obtaining the azimuthally averaged radial profiles. Another geometry effect may also affect the azimuthally averaged profiles in considerably inclined ring galaxies. For an inclined disk of finite thickness, the line-of-sight flux comes from density-wave-born stellar populations located at different radii, and hence having different ages and different photometric properties. This line-of-sight overlapping of stellar populations of different ages may have a significant effect on the azimuthally averages surface brightness profiles, if most of the radiation flux comes from regions close to the minor axis and the line-of-sight thickness of the disk is comparable to the expected shift between the peaks in different passbands.
Rough estimates of this effect can be done by assuming that the total stars+gas surface density in the ring () is of order 20 pc-2 and using a typical value of the stellar velocity dispersion of young stellar populations km s-1. For the case of a self-gravitating disk, the isothermal scale height of the ring is near 0.2 kpc. The vertical thickness of the outer ring is thus 0.4 kpc. The gravitational potential of a dark halo makes a disk thinner, but not very significantly (Bahcall Bahcall (1984)). At the same time, disk thickness is expected to be twice bigger for interacting galaxies (Reshetnikov & Combes Resh (1997)). Results of numerical experiments also indicate that the Cartwheel’s outer ring might be thick and slightly warped (Struck Struck (1997)).
Our model predicts that the linear difference between the and K-band peaks is of order of a kiloparsec and this value is thus comparable to the line-of-sight thickness of the Cartwheel outer ring for the adopted inclination of (Higdon Higdon2 (1996)). Hence, we expect that both the line-of-sight overlapping and the warping act to smear out the difference between the peak positions of the azimuthally averaged radial surface brightness profiles shown in Fig. 8. Fortunately, overlapping should have little effect in the regions located along the major axis of the Cartwheel.

We apply an alternative method for determining the angular difference between the peak positions of radial profiles in different photometric bands. Instead of computing the fluxes from each elliptical annulus shown in Fig. 7, i.e. the fluxes averaged over the whole azimuth, we make a series of radial cuts drawn from the Cartwheel’s nucleus with an angular separation of . A series of 360 radial surface brightness profiles of the Cartwheel’s outer ring were then constructed by azimuthally averaging these cuts over a sector. Peaks were located by both fitting a Gaussian to each profile and determining the ”center of mass” of each profile. The radial positions of each peak were corrected for a 41∘ inclination of the Cartwheel and re-calculated for a zero inclination.
Both methods give very similar results. Angular differences in arcsec between the peak positions are shown in Fig. 9 as a function of position angle, which is measured counterclockwise from a line extending north from the outer ring center. The Ks-band and B-band peaks are located at smaller radii than the peak in for almost all position angles. The angular difference between the Ks-band and peaks is systematically bigger than between the B-band and peaks (Fig. 9b), which is in full agreement with our model predictions.
Let us now consider the effects of finite thickness of the Cartwheel’s disk in more detail. Let us assume that the Cartwheel’s disk has a radially non-constant thickness, with the inner regions being thicker than the outer regions. This assumption is justified, since the inner regions of the Cartwheel are expected to be older and hence thicker than the outer regions. Internal dust extinction is known to be considerable in the Cartwheel’s outer ring (Fosbury & Hawarden FH (1977), VB). We assume a limiting case when part of the Cartwheel’s outer ring that is located below the galactic plane is totally unseen. Under these assumptions, the angular differences between the peak positions should have maximums along the minor semi-axis that is drawn on the galaxy’s near side. The minima of angular differences are then expected to be along the minor semi-axis drawn on the galaxy’s far side. We smoothed Fig. 9 with a wide median filter in order to minimize the noise. The results are shown by the solid lines in each panel of Fig. 9. The angular differences between all three bands are minimal along the southern minor semi-axis at position angles 180∘-220∘. On the opposite side, along the northern minor semi-axis at position angles 20∘-40∘, the angular differences in Fig. 9 show an expected tendency to grow and reach a maximum. This places the southern part of the Cartwheel on the galaxy’s far side. Our conclusion is consistent with the analysis of Higdon (Higdon2 (1996)), who deduced the galaxy’s orientation indirectly from the form of rotation curve and spokes. There is however an unexpected maximum in the and angular peak differences at position angles 320∘-340∘, while the angular peak difference is minimal there. This may be a manifestation of an warp in the Cartwheel’s outer ring.
As it has been noted above, differences between the peak positions measured along the major axis are not influenced by the finite thickness of a ring galaxy. Hence, they might be considered as an indicator of the Cartwheel’s outer ring propagation velocity. The angular peak differences along the Cartwheel’s major axis determined from the smoothed curves in Fig. 9 are =1.97′′, =1.29′′, and =0.67′′. They correspond to the linear peak differences of =1.3 kpc, =0.85 kpc, and =0.45 kpc for the adopted distance of 140 Mpc. These values are even bigger than those predicted by our modeling for the Cartwheel’s outer ring velocity of 90 km s-1, implying that the outer ring is currently propagating at km s-1. We note that these estimates cannot be considered as very accurate, though they clearly show that the Cartwheel’s outer ring is indeed expanding, and probably with a considerable velocity as predicted by modeling of color gradients in Sect. 2 and numerical hydrodynamics modeling in Sect. 3. We derive km s-1 as an average of estimates obtained in Sect. 2-4. Since the wave velocity most probably decrease with time, we conclude that the Cartwheel galaxy is no older than 250 Myr.
5 Other possibilities for estimating the propagation velocity of ring gas density waves
5.1 CaII triplet equivalent widths
The CaII triplet (CaT) lines originate in the atmospheres of cool stars with the absorption being the strongest in red supergiants. While studying numerically the evolutionary behavior of the CaT equivalent widths (EW(CaT)) in starbursts of different metallicities, Mayya (Mayya2 (1997)) found that besides the primary peak around 10 Myr the EW(CaT) show a well defined secondary peak around 60 Myr in the solar metallicity starbursts. The time separation between the primary EW(CaT) peak around 10 Myr and the secondary EW(CaT) peak around 60 Myr might be in principle used to infer the propagation velocity of gas density waves in ring galaxies.
We illustrate this possibility for the Cartwheel ring galaxy. We assume that the Cartwheel’s outer ring is currently propagating at =90 km s-1. For the time being, we assume that the Cartwheel’s gaseous disk has the solar metallicity. We also neglect the possible input to EW(CaT) from the pre-collision stellar populations, which is indeed minimal at the Cartwheel’s outer parts (VB). The filled triangles in Fig. 10 show the model radial profile of EW(CaT) after the outer ring has propagated 24 kpc in the galactic disk. Two well-defined peaks of EW(CaT) at 19.1 kpc and 23.5 kpc are clearly evident. For the outer ring propagation velocity of 90 km it takes exactly 50 Myr to cross the distance between these two peaks in Fig. 10. The angular difference between the peak positions of 6.6” should be easily detected. Now given the linear difference between the primary and secondary peak positions is known from observations of a ring galaxy, one can calculate the propagation velocity of gas density wave by dividing on the value of . Or alternatively, if propagation velocity is known from independent measurements or/and detailed modeling, one can calculate , thus breaking new ground for the distance-independent estimates of a ring galaxy linear diameter. Hence, EW(CaT) may provide the means for a Hubble-constant-independent estimate of a distance to a ring galaxy.
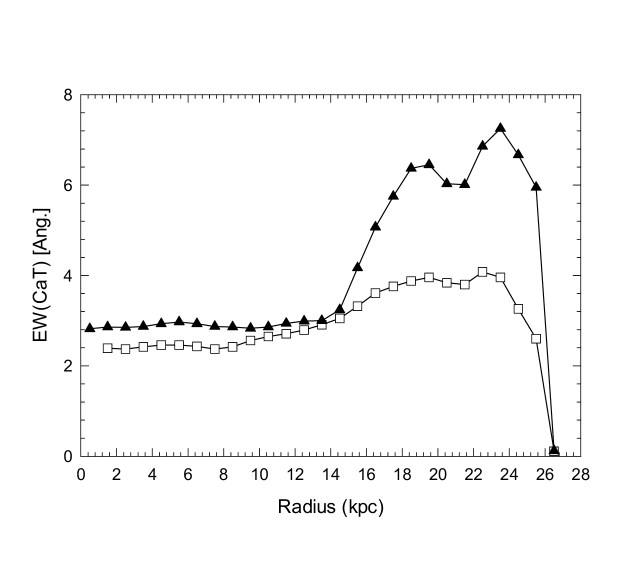
This method of evaluating the propagation velocity of gas density waves is most effective in the solar metallicity environments. For sub-solar metallicities however the primary and secondary peaks in EW(CaT) become much less pronounced as shown by the open squares in Fig. 10 for the metallicity. In fact, the primary peak almost disappear for metallicities below . Furthermore, the absolute values of EW(CaT) generally decrease for progressively lower metallicities (Mayya Mayya2 (1997)). These difficulties make the observational detection of the primary and secondary peaks problematic in the sub-solar metallicity environments. For the Cartwheel galaxy, the solar metallicity is expected only in the central parts. The outer parts are most probably of sub-solar metallicity and this method will not work. Unfortunately, heavy element abundance measurements of Bransford et al. (Bransford (1998)) indicate that individual star-forming knots in the rings of all ring galaxies in their sample have sub-solar metallicities in the range from to . We have to look for metal-rich ring galaxies in order to apply this method for determining the propagation velocity of gas density wave.
5.2 Other spectral lines
Some other prominent absorption lines might be used for estimating the propagation velocity of gas density waves in ring galaxies. Synthesized spectra of a single-burst stellar population (PEGASE2 or Starburst99) indicate that the equivalent widths of such optical absorption lines as Mg b, Na D, and some of strong Fe lines have a local maximum/minimum between 10 and 250 Myr. A set of these lines can help to establish ”time labels” along the radius of a ring galaxy under an assumption that most stars in the galaxy were born in a single star formation event. Even two localizations of such extremes in the radial profiles of absorption line equivalent widths can provide us with the ages of stellar populations at different radii and hence give us an insight into the value of propagation velocity of gas density wave that triggered the star formation event. Use of a large aperture telescope in combination with a contemporary spectrograph makes it possible to obtain high signal-to-noise spectra of ring galaxies in a few hours of integration time (Moiseev Moiseev (2002)).
5.3 Non-thermal radio emission
Evolved stellar populations in the wake of an expanding ring density wave explode as supernovae. Type II supernova remnants are responsible for strong non-thermal radio emission. Condon and Yin (CY (1990)) argue that most Type II supernova remnants and their consequent non-thermal radio emission result from stars with masses just over 8 , while stars more massive than 20 account for most of the ionizing radiation and consequent emission. If so, we might expect to observe the difference between the peak positions of the radial profiles of non-thermal radio emission and surface brightness in ring galaxies. Indeed, the ring galaxy VII Zw 466 does show signs of such a difference when radio emission peaks on the inside edge of the disk and does not coincide with the prominent HII region complexes. The radial difference between the peaks in and non-thermal radio emission might be used to infer the propagation velocity of gas density waves in ring galaxies in the same manner as in Sect. 4.
6 Conclusions
Our numerical hydrodynamics modeling of ring galaxy formation demonstrates that the maximum radial expansion velocity of gas () in the first ring is always below the propagation velocity of the first ring itself () The inequality is less strict in ring galaxies of comparable disk/halo masses than in halo-dominated ring galaxies. Numerical hydrodynamics modeling of the Cartwheel galaxy indicates the outer ring is currently propagating at km s-1, while the maximum radial expansion velocity of gas in the outer ring is currently km s-1. The latter value is in marginal agreement with the measurements of Higdon (Higdon2 (1996)) based on HI kinematics, but substantially disagree with the measurements of Amram et al. (Amram (1998)) based on kinematics of ionized gas. We conclude that the dynamical properties of neutral and ionized gas may differ significantly in ring galaxies.
We demonstrate that the radial color gradients, together with the extinction-free indices, can be used for estimating the value of in ring galaxies. Modeling of the radial color gradients measured in the Cartwheel disk by Marcum et al. (Marcum (1992)) is sensitive to the assumed value of a Hubble constant. Nevertheless, the color gradient modeling imposes the lower limit of km s-1 on the propagation velocity of the outer ring for any value of a Hubble constant in the range km s-1 Mpc-1. For the adopted in this work km s-1 Mpc-1, the best agreement between the model and observed radial color gradients is achieved for velocities of 90 km s-1 and even higher.
Our modeling of the Cartwheel galaxy demonstrates that the angular differences between the peaks in the , K-, and B-band radial surface brightness profiles are =1.65′′ and =1.05′′, which should be detected with the achieved resolution. On the other hand, we find that the azimuthally averaged radial surface brightness profile of the Cartwheel’s outer ring does not peak exterior to those in Ks- and B-bands, contrary to the predictions of our model for km s-1. We conclude that a 41∘ inclination, along with a finite thickness and warping of the Cartwheel’s disk, act to smear out the angular differences between the peaks in the , Ks, and B radial profiles. Indeed, we construct a series of the radial surface brightness profiles azimuthally averaged over a 1∘ sector. These pie-chart-like radial profiles do show an expected tendency and the radial profile peaks exterior to those in Ks- and B-bands at the position of the Cartwheel’s outer ring. The and peak differences are the biggest along the Cartwheel’s major axis, where effects of inclination and finite thickness are minimized, and are in close agreement with our model predictions. The peak differences obtained along the Cartwheel’s major axis imply 110 km s-1. Azimuthal variations in , , and peak differences support our assumptions about a thick and non-flat nature of the Cartwheel’s outer ring. We conclude that the Cartwheel’s outer ring is currently propagating at km s-1, which is in agreement with our numerical hydrodynamics results.
We show that the equivalent widths of some spectral lines, such as the CaII triplet, might be used for determining the propagation velocity of ring density waves in solar metallicity environments. Solar metallicity rings have not been detected so far (Bransford et al. Bransford (1998)), but they may be expected in young ring galaxies where the rings have not yet expanded out to the metal-unpolluted regions. Non-thermal radio emission is also a promising tool for determining the wave velocity in ring galaxies with high rates of star formation like the Cartwheel.
Acknowledgements.
We are thankful to the referee, Dr. A.P. Marston, for his suggestions and critical comments, which helped us to improve the paper. The authors are grateful to Dr. Y.D. Mayya for providing his population synthesis code. We thank Dr. S.Popov for help with data collection. The paper is based on observations made with ESO Telescopes at the Paranal Observatory under program ID 66.B-0666(B). Some of the data presented in this paper were obtained from the Multimission Archive at the Space Telescope Science Institute (MAST). STScI is operated by the Association of Universities for Research in Astronomy, Inc., under NASA contract NAS5-26555. Support for MAST for non-HST data is provided by the NASA Office of Space Science via grant NAG5-7584 and by other grants and contracts. The paper is based on archival data taken from the Canadian Astronomy Data Center, which is operated by the Dominion Astrophysical Observatory for the National Research Council of Canada’s Herzberg Institute of Astrophysics.References
- (1) Amram, O., Mendes de Oliveira, C., Boulesteix, J., & Balkowaki, C. 1998, A&A, 330, 881
- (2) Appleton, P. N., & Higdon, J. L. 1993, ApJ, 411, 108
- (3) Appleton, P. N., & Marston, A. P. 1997, AJ, 113, 201
- (4) Appleton, P. N., & Struck-Marcell, C. 1987, ApJ, 318, 103
- (5) Athanassoula, E., Puerari, I., & Bosma, A. 1997, MNRAS, 286, 284
- (6) Bahcall, J. 1984, ApJ, 276, 156
- (7) Binney, J., & Merrifield, M. 1998, in Galactic Astronomy, eds. P. Ostriker and D.N. Spergel, Princeton University Press, 442
- (8) Bohlin, R. C., Savage, B. D., & Drake, J. F. 1978, ApJ, 224, 225
- (9) Bransford, M. A., Appleton, P. N., Marston, A. P., & Charmandaris, V. 1998, ApJ, 116, 2757
- (10) Charlot, S. 1996, in From Stars to Galaxies, ed. C. Leitherer, U. Fritze-v. Alvensleben, & J. Huchra (San Francisco: ASP), ASP Conf. Ser., 98, 275
- (11) Combes, F., & Gerin, M. 1985, A& A, 150, 325
- (12) Condon, J. J., & Yin, Q. F. 1990, ApJ, 357, 97
- (13) Davies, R. L., & Morton, D. C. 1982, MNRAS, 201, 69P
- (14) Faber, S. M., & Gallagher, J. S. 1979, ARA&A, 17, 135
- (15) Fioc, M. & Rocca-Volmerange, B. 1999, astro-ph/9912179
- (16) Fosbury, R. A. E., & Hawarden, T. G. 1977, MNRAS, 178, 473
- (17) Hernquist, L. & Weil, M. L. 1993, MNRAS, 261, 804
- (18) Higdon, J. L. 1995, ApJ, 455, 524
- (19) Higdon, J. L. 1996, ApJ, 467, 241
- (20) Horellou, C., Casoli, F., Combes, F. et al. 1995, A& A, 298, 743
- (21) Horellou, G., Charmandaris, V., Combes, F. et al. 1998, A& A, 340, L51
- (22) Korchagin, V., Mayya, Y. D., Vorobyov, E. I., & Kembhavi, A.K. 1998, ApJ, 495, 757
- (23) Korchagin, V., Mayya, Y. D., & Vorobyov, E. I. 2001, ApJ, 554, 281
- (24) Kurucz, R. L. 1992, Stellar Populations of Galaxies, ed. B. & A. Renzini (New York: Kluwer), IAU Symp., 149, 225
- (25) Leitherer, C., Schaerer, D., Goldader, J. D., et al. 1999, ApJS, 123, 3
- (26) Lejeune, T., Buser, R., & Cuisinier, F. 1997, A& AS, 125, 229
- (27) Marcum, P. M., Appleton, P. N., & Higdon, J. L. 1992 ApJ, 399, 57
- (28) Marston, A. P., & Appleton, P. N. 1995, ApJ, 109, 1002
- (29) Martin, C, & Kennicutt, R. 2001, ApJ, 555, 301
- (30) Mayya, Y. D. 1995, AJ, 109, 2503
- (31) Mayya, Y. D. 1997, ApJL, 482, L149
- (32) Mihos, J. C. & Hernquist, L. 1994, ApJ, 437, 611
- (33) Moiseev, A. 2002, astro-ph/0211104, private communication
- (34) Olson, K. M., & Kwan, J. 1990, ApJ, 349, 480
- (35) Reshetnikov, V., & Combes, F. 1997, A&A,324, 80
- (36) Schaller, G., Schaerer, D., Meynet, G., & Maeder, A. 1992, A& AS, 96, 269
- (37) Stone, J. M. & Norman, M. L. 1992, ApJSS, 80, 753
- (38) Struck, C. 1997 ApJS, 113, 269
- (39) Toomre, A. 1978, in The Large-Scale Structure of the Universe, IAU Symp. No. 79, ed. M.S. Longair and J. Einasto, D. Reidel Publications, Holland, 109
- (40) Tsuchiya, T., Korchagin, V., & Wada, K. 1998, ApJ, 505, 607
- (41) Vorobyov, E.I., Bizyaev D. 2001, A&A, 377, 835 (VB)