Monte Carlo Simulations of Globular Cluster Evolution. III. Primordial Binary Interactions
Abstract
We study the dynamical evolution of globular clusters using our 2D Monte Carlo code with the inclusion of primordial binary interactions for equal-mass stars. We use approximate analytical cross sections for energy generation from binary–binary and binary–single interactions. After a brief period of slight contraction or expansion of the core over the first few relaxation times, all clusters enter a much longer phase of stable “binary burning” lasting many tens of relaxation times. The structural parameters of our models during this phase match well those of most observed globular clusters. At the end of this phase, clusters that have survived tidal disruption undergo deep core collapse, followed by gravothermal oscillations. Our results clearly show that the presence of even a small fraction of binaries in a cluster is sufficient to support the core against collapse significantly beyond the normal core collapse time predicted without the presence of binaries. For tidally truncated systems, collapse is easily delayed sufficiently that the cluster will undergo complete tidal disruption before core collapse. As a first step toward the eventual goal of computing all interactions exactly using dynamical three- and four-body integration, we have incorporated an exact treatment of binary–single interactions in our code. We show that results using analytical cross sections are in good agreement with those using exact three-body integration, even for small binary fractions where binary–single interactions are energetically most important.
Accepted for publication in ApJ
1 Introduction
The realization about 10 years ago that primordial binaries are present in globular clusters in dynamically significant numbers has completely changed our theoretical perspective on these systems (see, e.g., the review by Hut et al., 1992a). Most importantly, dynamical interactions between hard primordial binaries and other single stars or binaries are thought to be the primary energy generation mechanism responsible for supporting a globular cluster against core collapse (Goodman & Hut, 1989; McMillan et al., 1990, 1991; Gao et al., 1991). The term “binary burning” is now often used by analogy with hydrogen burning for stars. In the same way that hydrogen burning allows a star like the Sun to remain in thermal equilibrium on the main sequence for a time much longer than the Kelvin-Helmholtz timescale, primordial binary burning allows a globular cluster to maintain itself in quasi-thermal equilibrium and avoid core collapse for a time much longer than the two-body relaxation timescale.
In addition, strong dynamical interactions involving binaries can explain very naturally the large numbers of exotic objects found in dense star clusters. Exchange interactions between hard primordial binaries and neutron stars inevitably produce large numbers of X-ray binaries and recycled pulsars in globular clusters (Hut et al., 1991; Sigurdsson & Phinney, 1995; Davies & Hansen, 1998; Rasio et al., 2000). Resonant interactions of primordial binaries result in dramatically increased collision rates for main-sequence stars in globular clusters and even open clusters (Bacon et al., 1996; Cheung et al., 2003; Leonard, 1989; Leonard & Linnell, 1992). Direct observational evidence for stellar collisions and mergers of main-sequence stars in globular clusters comes from the detection of large numbers of bright blue stragglers concentrated in the dense cluster cores (Bailyn, 1995; Bellazzini et al., 2002; Ferraro et al., 2001). Previously it was thought that primordial binaries were essentially nonexistent in globular clusters, and so other mechanisms such as tidal capture and three-body encounters had to be invoked in order to form binaries dynamically during deep core collapse. However, these other mechanisms have some serious problems, and are much more likely to result in mergers than in the formation of long-lived binaries (Chernoff & Huang, 1996; Kochanek, 1992; Kumar & Goodman, 1996; Portegies Zwart & McMillan, 2002; Kim & Lee, 1999; Kim et al., 1998; Lee & Ostriker, 1993). Multiple mergers of main-sequence stars and runaway collisions in young star clusters could lead to the formation of a massive central black hole in some systems (Lee, 1993; Gebhardt et al., 2002; Portegies Zwart & McMillan, 2002).
The primordial binary fraction is therefore a key input parameter for any realistic study of dense star cluster dynamics (Hut et al., 1992a). Early determinations of binary fractions in globular clusters came from observations of spectroscopic binaries with red giant primaries (Pryor et al., 1988, see, e.g., Cote et al. 1996 for a more recent study) as well as eclipsing binaries (Mateo et al., 1990; Yan & Mateo, 1994). Hubble Space Telescope observations have provided direct constraints on primordial binary fractions in the central regions of many globular clusters, where binaries are expected to concentrate because of mass segregation. Rubenstein & Bailyn (1997) used observations of a broadened main sequence in NGC 6752 to derive a binary fraction in the range 15%–38% for the inner cluster core. Their method has now been applied to many other clusters. For example, Bellazzini et al. (2002) derive a similar binary fraction, in the range 0.08–0.38, in the central region of NGC 288. Adding proper motion information can lead to much tighter constraints, as in the case of NGC 6397, where Cool & Bolton (2002) derive a binary fraction % near the center.
Despite the crucial role of primordial binaries in the dynamical evolution of a dense star cluster, the overall evolution of the binary population within a cluster, and its direct implications for the formation rate of observable systems such as recycled pulsars and blue stragglers, remains poorly understood theoretically. One reason is that the relative importance of binary interactions in a cluster, like many other dynamical processes, depends in a complex manner on the number of stars in the system. This makes it difficult to extend results obtained from small direct -body simulations to realistic globular cluster models. In particular, the rate at which binaries are “burned” and, ultimately, destroyed or ejected from the cluster depends on the size of the cluster. When the initial primordial binary fraction is below a certain critical value, a globular cluster core can run out of binaries before the end of its lifetime, i.e., before disruption in the tidal field of the Galaxy (McMillan & Hut, 1994). Without the support of binaries, the cluster will then undergo a much deeper core collapse, perhaps followed by gravothermal oscillations (Sugimoto & Bettwieser, 1983; Breeden et al., 1994; Makino, 1996). At maximum contraction, the core density may increase by many orders of magnitude, leading to greatly enhanced interaction rates.
Detailed numerical studies of globular cluster evolution with primordial binaries are still lacking, for several reasons. First, the inclusion of even a modest fraction of primordial binaries adds a very significant computational overhead to -body simulations. This is mainly due to the extra computations required to treat binary interactions, but also because the lifetime of a cluster can be significantly extended (by up to many orders of magnitude) through binary burning. In addition, in direct -body simulations, the extremely large ratio of the overall cluster dynamical time to the orbital period of close binaries (as large as in a globular cluster!) introduces many computational difficulties. This makes -body simulations with primordial binaries prohibitively expensive for stars, although special-purpose supercomputers such as the new GRAPE-6 may increase this limit in the near future (Makino, 2001). Orbit-averaged calculations, like direct Fokker-Planck integrations and Monte Carlo simulations, get around this problem by treating binaries just like single stars, except during brief periods of strong interactions. Unfortunately, this requires that cross sections for strong interactions involving binaries be known accurately, for a wide range of binary parameters (masses, semi-major axes, and eccentricities). These cross sections are difficult to determine in general, and reliable semi-analytic fits to numerical scattering experiments are only available for simple configurations such as those involving equal-mass stars. For these reasons, most previous numerical studies of globular clusters with primordial binaries have been limited either to clusters with equal-mass stars (Gao et al., 1991; Spitzer & Mathieu, 1980), or to very small clusters with stars (Heggie & Aarseth, 1992; Hurley et al., 2001; McMillan et al., 1990, 1991; McMillan & Hut, 1994). Simplified treatments have also been employed in which the dynamics of the binaries was followed in a static cluster background (Hut et al., 1992b) or in a background cluster modeled as an evolving gas sphere (Giersz & Spurzem, 2000).
The results of Gao et al. (1991, hereafter GGCM91), based on direct Fokker-Planck integrations, were the first to clearly illustrate the dominant effect of even a small fraction of primordial binaries on the evolution of a globular cluster. In this paper, we present the first study of globular cluster evolution with primordial binaries based on self-consistent Monte Carlo simulations with a realistically large number of stars (). Partly in order to allow better comparison of our results with those of GGCM91, we use similar initial conditions and cross sections for binary–binary and binary–single interactions, even though our method for implementing these cross sections in the Monte Carlo scheme is completely different. In addition, the results of GGCM91 were obtained using a 1-D Fokker-Planck method (in which isotropy in velocity space is enforced). More realistic 2-D (anisotropic) Fokker-Planck calculations with primordial binaries have never been reported in the literature, to the best of our knowledge. Even for the 1-D calculations, and with only a single parameter representing the internal structure of binaries (namely, their binding energy), the inclusion of binary–binary interactions significantly increased the overall computation time. Since the Fokker-Planck method uses distribution functions to represent the system, every new parameter adds a new dimension to the phase space, making the Fokker-Planck equation more difficult to solve numerically. It has also been shown recently that the 1-D treatment is inadequate in dealing with some aspects of the evolution, such as the escape rate from tidally truncated clusters (Takahashi & Portegies Zwart, 1998, 2000). Many difficulties in the direct Fokker-Planck approach come from the basic representation of the system in terms of smooth distribution functions. Neglecting the discrete nature of the system makes it impossible to follow the details of individual interactions, such as binary–single or binary–binary interactions. The implicit assumption that also makes it difficult to scale the results of direct Fokker-Planck simulations to finite systems with different numbers of stars.
Our Monte Carlo method provides an intermediate approach, which combines many of the benefits of direct -body simulations (such as the description of the cluster on a star-by-star basis and the possibility to treat each individual interaction in detail) with the speed of an orbit-averaged calculation. Our method is also 2-D in velocity space by construction, and hence properly accounts for any velocity anisotropy in the system. Another benefit of the method is that it allows a wide range of binary parameters to be used without having to modify the underlying orbit-averaged calculation of the relaxation processes. In principle, individual interactions can be treated in as much detail as in direct -body simulations, by computing all strong encounters exactly using three-body or four-body integrators. As a first step, for this paper, we have incorporated a three-body dynamical integrator into our code, which allows binary–single interactions to be computed exactly (without reference to approximate, pre-compiled cross sections). This allows us to follow the outcomes of interactions more precisely, and, most importantly, will allow us in the future to extend our code to multi-mass systems, for which analytic cross sections are not available.
2 Treatment of Binary Interactions
We use the basic Hénon-type Monte Carlo method for modeling the dynamical evolution of clusters as a sequence of equilibrium models subject to regular velocity perturbations (Hénon, 1971a, b); our code has been described in detail by Joshi et al. (2000, 2001, hereafter Papers I and II). The regular velocity perturbations are calculated using Hénon’s method to represent the average effect of many long-range small-angle gravitational scattering encounters using one suitably chosen encounter with a nearby star (Hénon, 1971b). At each time step, we calculate the Monte-Carlo realized radial position and velocity of each star (assuming spherical symmetry), which we use to calculate whether two objects (binary-single or binary-binary) will interact strongly. These strong interactions are performed using either simple recipes based on cross sections, or a dynamical integrator. For most of the work reported here, we use cross sections for the treatment of close binary–binary and binary–single interactions. These cross sections were compiled from analytic fits to the results of numerical scattering experiments available in the literature. Given the very large parameter space, reliable cross sections are available only for equal-mass encounters, and so we study only single-component clusters in this paper. All single stars are assumed to have the same mass, and all binaries contain two identical stars with the same mass as the background single stars. All stars are treated as point masses, i.e., we neglect physical collisions between stars during interactions (cf. Bacon et al., 1996; Cheung et al., 2003). Our implementation follows closely that used in the Fokker-Planck study by GGCM91, which will serve as the main comparison for our work.
2.1 Units and Definitions
In our code we use the system of units defined by setting , where is the initial cluster mass, and is the initial cluster energy (excluding the binding energy in binaries). The corresponding unit of time is then . However, the natural timescale for cluster evolution is the relaxation time
| (1) |
where is a constant of order unity that must be determined experimentally. This relaxation time is used as the time unit in the Monte Carlo code. Therefore the dependence factors out from all expressions used in simulating two-body relaxation (see Hénon, 1971b, or Paper I). When reporting results, however, we scale all times to the initial half-mass relaxation time, which we calculate using the standard definition given by Spitzer & Hart (1971),
| (2) |
where is the initial half-mass radius of the cluster. Since , we have , where the numerical coefficient depends on the value of for the particular initial model.
When calculating rates for processes that do not occur on the relaxation timescale, such as dynamical interactions, one must adopt a specific value for in the Coulomb logarithm when converting between dynamical and relaxation times. In all our simulations for this paper we use , the standard value adopted in most previous Fokker-Planck simulations, including those of GGCM91 (cf. Paper I, where we show that provides the best agreement with direct -body simulations for the evolution of a single-component cluster to core collapse). In addition, in calculating the binary–binary and binary–single interaction rates, GGCM91 use , the current number of stars in the cluster core, instead of in the denominator of eq. 1 when converting between dynamical and relaxation times. Although there is no rigorous justification for this choice, it appears reasonable, since the interactions occur mainly inside the high-density core, and we adopt the same prescription in our simulations.
To estimate core quantities, including the number of stars in the core, we first sample over a small number of stars, typically 0.1–1% of the total number of stars in the cluster, to calculate the central density, , and velocity dispersion, . Since the velocity dispersion varies so slowly away from the center, we estimate the core velocity dispersion as . The core radius is then defined to be
| (3) |
and the number of stars in the core is calculated as
| (4) |
where is the average mass of a star in the cluster, and (Spitzer, 1987).
2.2 Binary–Single Interactions
In a single time step, the probability that a binary will strongly interact with another object (single or binary) is given by
| (5) |
where is the cross section for the interaction, is the relative velocity at infinity, is the local number density of stars (single or binary), and is the time step. For binary–single interactions, , the binary–single interaction cross section, and , the local number density of single stars. In our code we calculate using a local sampling procedure, and take to be the relative velocity between the nearest single star and the binary. The total cross section for close binary–single interactions is computed as . Here is the impact parameter which gives a distance of closest approach between the binary and the single star of , where is the binary semi-major axis. For a binary of mass and single star of mass we have
| (6) |
The coefficient of 3.5 is chosen such that all interactions with a distance of closest approach greater than result in only negligible energy transfer from the binary to the passing star in a fly by (see, e.g., Heggie, 1975). As long as it is sufficiently large, the precise value of the coefficient has very little influence on the results.
The binary–single interaction is performed only if a uniform random number between 0 and 1 is less than the computed probability. The interaction can in principle be computed exactly using a three-body dynamical integrator; this approach has many benefits, especially in providing an accurate way of distinguishing between the various possible outcomes (see below). However, it also requires significantly more computational resources than using a simple analytic prescription. Following GGCM91, in these equal-mass simulations, we assume that the only outcome is binary hardening, and we use a semi-analytic fit (Spitzer, 1987, eq. [6-27]) to numerical results (Hut, 1984) to compute the translational energy released. Let be the fraction of the binding energy of the binary that is released as translational energy. The differential cross section for the interaction is given by (Gao et al., 1991),
| (7) |
where the critical velocity is , the velocity at infinity for which the total energy of the system is zero and complete ionization is possible. The quantity is drawn randomly from eq. (7) using the rejection technique. With this recoil energy and a scattering angle drawn at random in the center-of-mass frame, new velocities and orbital energies in the cluster are calculated for the emerging binary and single star.
As a first step toward the eventual goal of treating all binary interactions exactly, we have incorporated into our code a dynamical integrator to perform binary–single interactions. Specifically, we use the three-body integrator scatter3 from the Starlab software environment (see Appendix B of Portegies Zwart et al., 2001, and http://www.manybody.org). Scatter3 uses a time-symmetrized Hermite integrator and analytical continuation of unperturbed orbits to evolve the three-body system until an unambiguous outcome is obtained. The main benefit of using an exact treatment is the ability to study non-equal-mass systems, although for comparison with cross sections we restrict ourselves to the equal-mass case here. The implementation of the three-body integrations follows that of cross sections: first, the probability for an encounter to occur is calculated according to eqs. (5) and (6); next, with velocity at infinity , the impact parameter is chosen randomly in area, i.e., with probability . The binary eccentricity is assumed to follow a thermal distribution with , and all angles are chosen assuming random orientation and phase. The dynamical interaction is then calculated and its outcome is used to determine the new binding energy of the binary and the new orbits for the binary and single star in the cluster. The current implementation properly handles the outcomes of preservation and exchange, but, for the sake of comparison with cross sections, currently ignores ionizations. This is justified here since we consider only hard primordial binaries in our simulations (see Sec. 3.1).
2.3 Binary–Binary Interactions
To calculate the probability that a close binary–binary interaction should occur in a time step, we use eq. (5) with , the binary–binary interaction cross section, and , the local number density of binaries. We calculate using a local sampling procedure, and we take to be the relative velocity between the current binary and the nearest binary. Following GGCM91, for the binary–binary interaction cross section we use the results of Mikkola (1983a, b, 1984a, 1984b) for encounters between equal-mass binaries. In the case where one binary has a much higher binding energy than the other (), Mikkola (1984a) provides a semi-analytic fit to his numerical results, giving a collision cross section
| (8) |
where is the relative velocity of the two binaries at infinity, is the mass of each star in the binaries, and is the semi-major axis of the softer binary.
An interaction between two binaries can result in many possible outcomes. Since we consider only hard binaries in this study, the most probable outcomes are (1) disruption of the softer binary and hardening of the harder one, and (2) the formation of a stable hierarchical triple with a single star ejected. As much as of close binary–binary encounters may result in the formation of such a triple. However, for a triple system to remain long-lived in the dense cluster environment, its outer orbit must be sufficiently tight. The formation of a long-lived hierarchical triple is expected to be much less common in a dense cluster (see Ford et al., 2000). Therefore we assume for simplicity that all hierarchical triples formed are disrupted immediately. The only outcome of binary–binary encounters that we treat in our simulations is then case (1) above. Mikkola finds that, on average, approximately one half of the combined binding energy () of the two binaries is released in the form of translational energy, . The semi-analytic fit given by Mikkola (1984a) for the distribution of translational energies produced is rather complicated. Instead, we use a simplified version of the distribution,
| (9) |
proposed by GGCM91. The mean value of this distribution, , is in good agreement with the results of Mikkola for interactions resulting in a binary and two single stars.
We also adopt a simplified overall binary–binary collision cross section, by replacing the expression in square brackets in eq. (8) by its value at , yielding
| (10) |
The energy required to disrupt the softer binary, as well as the total translational energy released in the collision , are both generated at the expense of the surviving binary. Thus the binding energy of the surviving pair increases by an amount . According to Mikkola (1983a), for collisions between binaries of equal binding energies producing a binary and two single stars, typically about of the translational energy produced is carried away by the binary, and the remaining is distributed randomly among the two single stars. For simplicity, we assume that this prescription is applicable to collisions between binaries of unequal binding energies as well. We select the direction of the recoil velocity between the binary and the single stars randomly in the center-of-mass frame.
If a binary does not undergo a strong interaction with a single star or another binary, it is then treated as a single star in the usual two-body relaxation step (see Paper I), during which its internal structure is left unchanged.
3 Results
3.1 Initial Conditions and Summary of Model Results
For our initial cluster models we use both the Plummer model, assumed to be isolated (i.e., with no tidal boundary enforced), and a variety of tidally truncated King models, assumed to be on a circular orbit in the Galaxy (i.e., with a fixed external tidal potential). Mass loss through the tidal boundary is treated as in Paper II, using a criterion based on the apocenter distance of each stellar orbit in the cluster, and an iterative procedure to determine both the mass loss and the new position of the tidal boundary after each relaxation timestep. The initial binary fraction (defined as the fraction of stars, by number, that are binaries) varies between 0 and 30%. In a few cases, for calibration, we have also performed simulations in which the binaries are present, but all interactions are turned off; these models are equivalent to two-component models in which a small fraction of (single) stars have twice the mass of the background stars (see Watters et al. 2000 and Fregeau et al. 2002 for other studies of two-component clusters using our code).
The binaries are distributed initially in the cluster according to the same density profile as for single stars. Hence no initial mass segregation is assumed for the binaries. The distribution of the internal binding energy of the binaries is assumed to be uniform in between a minimum value and a maximum value . Following GGCM91, we consider only hard binaries, with the minimum binding energy , where is the initial central velocity dispersion. Soft binaries, if present, would be assumed to be ionized (destroyed) as soon as they participate in a strong interaction. Therefore they would not affect the overall evolution of the cluster significantly. For the maximum binding energy we take , which is approximately the binding energy of a contact binary for two solar-like stars if . The precise value of has little influence on our results, since very hard binaries behave essentially as single more massive stars (with very small interaction cross section).
Table 1 lists the parameters of the main models we considered, as well as the main results of our simulations for each cluster. The first column identifies the initial cluster model, Plummer or King, and the value of the concentration parameter (dimensionless central potential) for King models. The second column gives the initial binary fraction . All simulations were performed with stars (including binaries) initially in the cluster. The following columns summarize the main results of our dynamical simulations. For each model we first give the time of core collapse , in units of the initial half-mass relaxation time , defined by eq. (2). Here core collapse is defined as the moment when the core density reaches its first maximum. This can be determined typically to within a statistical error of at most a few percent in our simulations. We then give the total mass of the cluster at the moment of core collapse (in units of its initial total mass), and the fraction of binaries that remain at that moment. For clusters that disrupt completely before reaching core collapse, we list the disruption time instead of .
3.2 Comparison with Direct Three-Body Integration
As a simple test of our code and the approximate treatment of interactions, we compare the use of cross sections with dynamical integrations of binary–single encounters. In future work, we will also implement dynamical integrations of binary–binary interactions, and we will use more detailed comparisons to re-calibrate the various recipes based on cross sections. Here our intent is merely to demonstrate that these simple recipes are reasonably accurate. We have not changed our prescriptions to try to better match the results of the dynamical integrations, since a main goal in this first study is to provide comparisons with the Fokker-Planck simulations of GGCM91 that used the same simple prescriptions. For this test binary–binary interactions were turned off. In reality, they tend to dominate the energy production (see Sec. 3.3). Thus this simple test also allows us to study specifically the effects of three-body interactions on the overall cluster evolution.
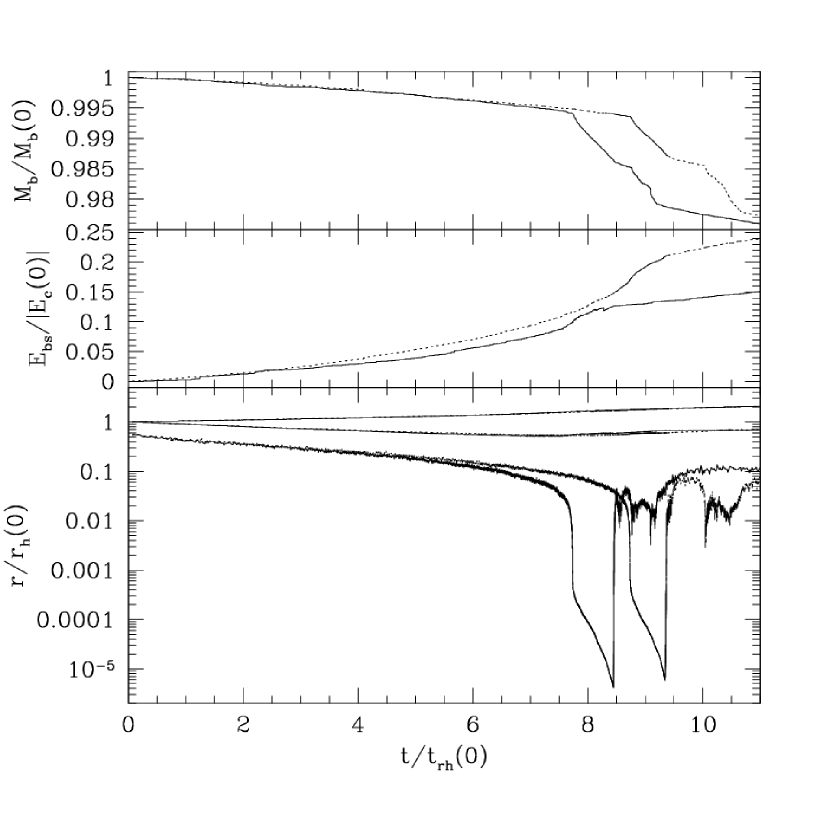
Figure 1 shows the evolution of an isolated cluster described initially by a Plummer model with stars and 20% binaries. Solid lines correspond to the simulation using direct three-body integrations, while dashed lines show the results using our simple cross sections. The top panel shows the total mass in binaries in the cluster, decreasing as binary burning proceeds. Since all binaries in the model are hard, binary–single interactions (unlike binary–binary interactions) cannot destroy a binary, and therefore binaries can only be lost by ejection from from the cluster (typically following significant hardening through multiple interactions; see Hut et al. (1992b) and Sec. 3.5 below). The rate of binary ejection accelerates abruptly at near core collapse. The middle panel of Figure 1 shows the energy generated in binary–single interactions, as a fraction of the total initial binding energy of the cluster. By the time of core collapse, this is only . This amount of energy is not sufficient to delay core collapse significantly. In fact the binaries, through mass segregation, accelerate core collapse in this (artificial) simulation (recall that the core collapse time of a single-component Plummer model without binaries is given by ). The bottom panel shows various characteristic radii in the cluster: from top to bottom, the half-mass radius of single stars, the half-mass radius of binaries, and the core radius, all in units of the initial half-mass radius.
The agreement between the two methods is strong, although the total energy generated in binary–single interactions is slightly smaller when calculated by direct dynamical integrations. Consequently, the model using dynamical integrations reaches core collapse sooner than the model using cross sections, because less energy is generated to support the core against collapse. We believe that this difference comes from the deterministic treatment of binary hardening with cross sections, in which every binary–single interaction results in a hardened binary. In reality the widest hard binaries in the simulation, which are right around the hard/soft boundary (and have the largest interaction cross section) have roughly equal probabilities of hardening and softening in an interaction (Heggie, 1975). To partly restore consistency between the two treatments, we ignore dynamical integration outcomes that result in ionization of the binary. Were these included, the total energy generated in binary–single interactions would decrease further, by roughly 50%. This would cause the binary population to become more centrally concentrated. Thus, in a realistic cluster simulation, we would expect the ratio of the energy generated by binary-single interactions to binary-binary interactions to decrease by more than 50% compared to predictions of cross-section based recipes.
3.3 Isolated Clusters
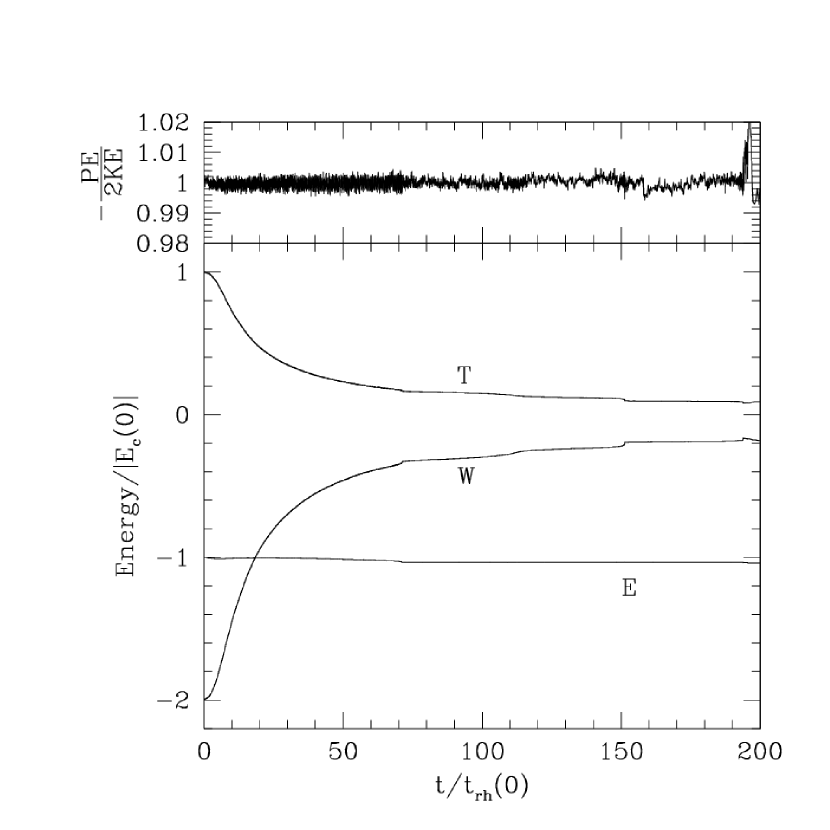
We consider first the evolution of Plummer models containing stars with a range of binary fractions . As a further test of our method, we show in Fig. 2 the evolution of the various energies and the virial ratio of a system with . Since dynamical relaxation is not built into our numerical method, the degree to which virial equilibrium is maintained during a simulation is our most important indicator of numerical accuracy. We monitor this, as well as energy conservation, in all our runs, and terminate a calculation whenever these quantities deviate from their expected values by more than a few percent (this typically happens when the number of binaries has been reduced to a very small value, or, in tidally truncated clusters, when the total number of stars remaining in the cluster becomes very small; See Sec. 3.4 below).
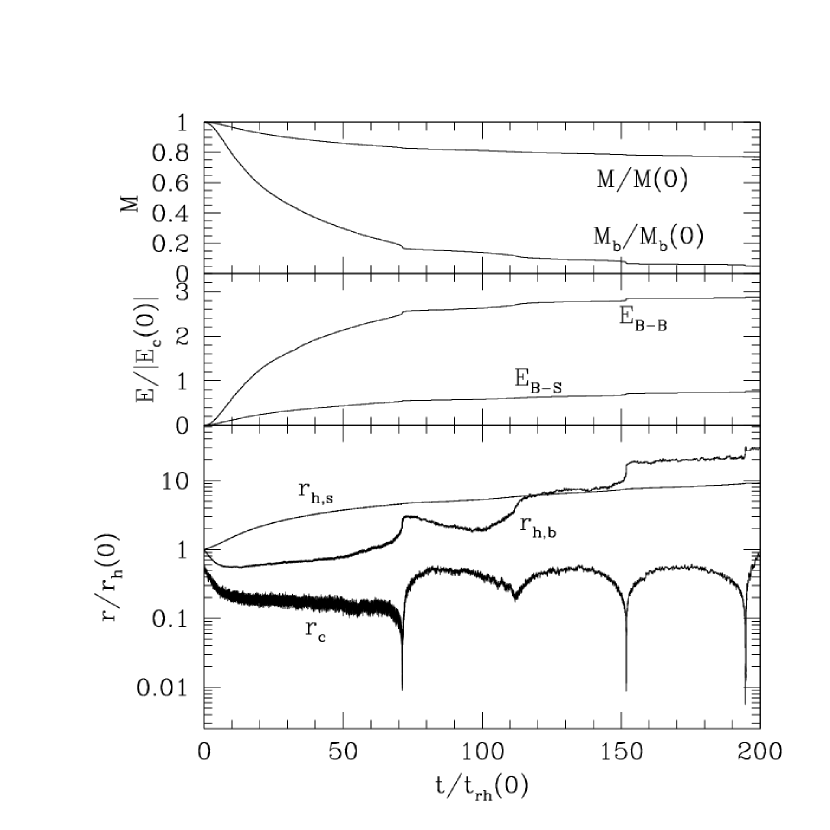
Figures 3, 4 and 5 show the evolution of models with , 0.1, and 0.2, respectively. The main impact of introducing binaries in the models is very clear: core collapse is delayed considerably. Even for a cluster with only 2% binaries initially (Fig. 3), increases by more than a factor 2. Clusters with can avoid core collapse for (Figs. 4 and 5). For the vast majority of globular clusters in our Galaxy, where yr, this timescale exceeds a Hubble time. If all globular clusters in our Galaxy were born with , only those with very short initial relaxation times would have had a chance to reach core collapse. However, for real clusters, tidal truncation and mass loss (Sec. 3.4) as well as stellar evolution (Paper II) complicate this picture considerably.
In Figure 3, we also show for comparison the evolution of the core radius for a model in which binaries are present but all interactions are turned off (short-dashed line in the bottom panel). Even with a binary fraction as small as in this case, core collapse occurs significantly earlier than in a single component Plummer model (at instead of 14). This shows the expected tendency for the heavier component of binaries to accelerate the evolution to core collapse, and the result is in good agreement with previous studies of core collapse in two-component clusters (see, e.g., Watters et al., 2000). Note that for sufficiently large binary fractions, these two-component models become “Spitzer-unstable,” i.e., the core collapse is driven entirely by the heavier component. Using the stability criterion derived by Watters et al., , here with an individual mass ratio and a total component mass ratio we expect the Spitzer instability to appear whenever the binary fraction . Thus all our models with binary fractions above a few percent should evolve on a relaxation timescale to a state where the dynamics of the cluster core is largely dominated by the binaries. Indeed, looking at the middle panels of Figures 4 and 5, we see that, with , the energy generation is largely dominated by binary–binary interactions. In contrast, for (middle panel of Fig. 3), binary–binary and binary–single interactions contribute roughly equally.
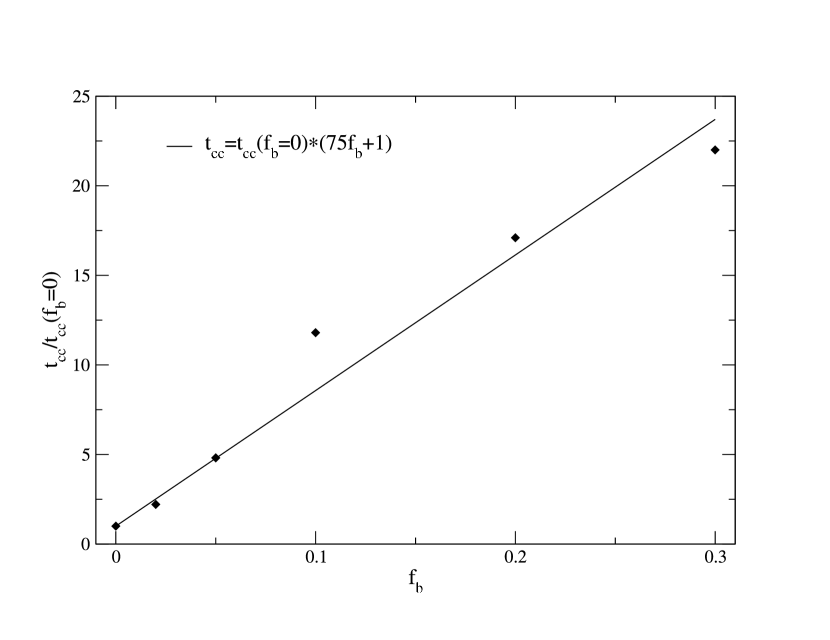
To quantify the effect of primordial binary burning on the core collapse time, we have repeated calculations with binaries present but all interactions turned off for six different models with varying . For each model, we can then properly calculate the ratio of core collapse times with and without binary interactions (but with mass segregation effects present in both cases). The results are shown in Figure 6, where this ratio is plotted as a function of the binary fraction. A simple linear fit gives
and reproduces the numerical results to within % in the range . The notation we use here, “,” means the core collapse time of a cluster with the same fraction of “inactive” binaries, rather than with no binaries.
Also shown in Figure 3 for comparison is the result of a simulation in which all interactions are included, but binary–single interactions are calculated by direct three-body integrations as in Sec. 3.2 (long-dashed line in the bottom panel). This comparison is useful again as a test of the simple treatment based on cross sections, since binary–single interactions play an important role as a source of energy in this model with . Our conclusion is the same as in Sec. 3.2: the agreement is very good until , but then the two simulations diverge and the model computed with direct three-body integrations collapses slightly earlier ( instead of 22). In spite of this slight offset, after core collapse the core re-expansion and gravothermal oscillations also look very similar in the two simulations.
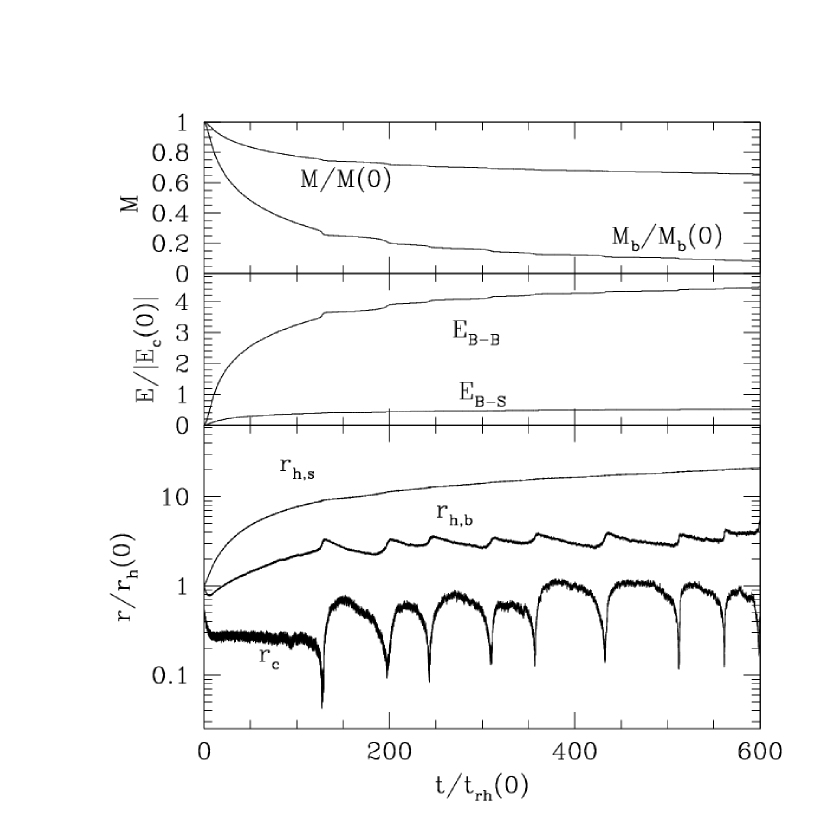
The top panels in Figures 3–5 show the evolution of the total cluster mass, as a fraction of the initial mass, and the remaining mass in binaries, as a fraction of the initial mass in binaries (this is also the remaining fraction by number since all binaries have the same mass). Binary–binary interactions are the main process responsible for the destruction of binaries in these simulations (since the softer binary is assumed to be disrupted in each interaction). In the absence of evaporation through a tidal boundary, mass loss from the cluster comes almost entirely from stars and binaries ejected through recoil following an interaction. The mass loss rate therefore increases with increasing binary fraction. At core collapse, the total mass loss fraction is about 5%, 15%, and 25% for , 0.1, and 0.2, respectively. However, while the total number of binaries in the cluster continuously decreases, the remaining fraction of binaries at core collapse appears to be roughly constant, around 0.2, independent of . This is sufficient to power many cycles of gravothermal oscillations after the initial core collapse, even for initial binary fractions as small as a few percent. For (Fig. 5), we were able to extend our numerical integration all the way to almost , at which point several thousand binaries are still present in the central region of the cluster (this timescale would of course vastly exceed a Hubble time for most Galactic globular clusters!).
The bottom panels in Figures 3–5 show the evolution of several characteristic radii. The most important is the core radius (recall that, by our definition, eq. (3), the central density scales approximately as since the central velocity dispersion is approximately constant). Even in deep core collapse, the core radius of our models never decreases by more than a factor (corresponding to an increase in the central density by ). Models with higher binary fractions contract very little (see Fig. 5: the first and deepest core collapse corresponds to a decrease in by less than a factor 10). Also shown are the half-mass radii of the binaries and of the single stars . The half-mass radius of the single stars always increases monotonically for these isolated clusters. In contrast, the half-mass radius of the binaries tends to increase on average but shows a much more complex behavior that depends strongly on the binary fraction and on the particular dynamical phase in the evolution of the cluster. The trend is for to decrease during normal cluster evolution, as the binaries mass segregate to the cluster core, and to increase dramatically during core collapse, as the density of binaries in the core grows and the rate of binary–binary interactions grows more quickly than the rate of binary-single interactions. This causes many softer binaries in the core to be disrupted and many harder binaries to be ejected out of the core through recoil. For sufficiently low binary fractions (Figs. 3 and 4), eventually becomes larger than after core collapse. For high binary fractions (Fig. 5), the binaries remain always much closer to the center of the cluster.
We now turn to a more detailed discussion of the Plummer model with 10% binaries (Fig. 4), including a comparison with the Fokker-Planck results of GGCM91 (see their Figs. 1–3), who consider this their “standard model.” Qualitatively, our results are in very good agreement up to core collapse. After an initial phase of contraction lasting , the core radius becomes nearly constant and the cluster enters a long phase of quasi-thermal-equilibrium. This is the stable “binary burning” phase, analogous to the main sequence for a star. During this phase, the rate of energy production through interactions in the core is balanced by the rate at which energy flows out in the outer halo, which continuously expands (in the absence of a tidal boundary). Core collapse occurs rather suddenly at the end of this phase. GGCM91 find for this model, while we find . This initial core collapse is followed by gravothermal oscillations, which are clearly still powered by primordial binary burning. We were able to follow these oscillations accurately until , while GGCM91 terminate their calculation at .
Upon closer examination and quantitative comparisons, some more significant differences become apparent. First, we see that the initial contraction phase appears much deeper in the model of GGCM91, with decreasing by almost an order of magnitude, while in our model the core contracts by a factor of about 3. During the stable binary burning phase, the cluster also appears somewhat more centrally concentrated in the model of GGCM91. Just before core collapse, they find , while our value is . On the other hand, the rate of binary burning and destruction is nearly the same in the two models. Compare, for example, the evolution of in Figure 4 to the same quantity plotted in Fig. 2a of GGCM91. Although there are slight differences in the shapes of the two curves, the reduction to 0.8 occurs after about in both cases, and the reduction to 0.5 after about . By the number of binaries has been reduced to 0.2 of its initial value in both models. This agreement is especially surprising since in our model this is still (just) before core collapse, while in GGCM91’s model several cycles of gravothermal oscillations have already occurred.
There are several reasons to expect differences between our results and those of GGCM91’s Fokker-Planck simulations, even though our treatments of individual binary–single and binary–binary interactions are essentially identical.
First, GGCM91’s representation of binaries is in terms of a separable continuous distribution function in , the orbital energy in the cluster, and , the internal energy of the binary. In fact, there is a strong and complex correlation between a binary’s binding energy and its position in the cluster (or equivalently its energy in the cluster), with harder binaries concentrated near the cluster core (see Hut et al. 1992b and Sec. 3.5). We suspect that GGCM91’s choice of a separable distribution function has the effect of reducing the energy generation rate, since then proportionately more soft binaries will be chosen for binary interactions — interactions that predominantly liberate a constant fraction of the total binding energy available (see Sec. 2 and Heggie 1975).
Second, 1-D Fokker-Planck results are known to differ from 2-D results in general (most notably in the prediction of the rate of tidal stripping; see Paper II). Enforcing isotropy in the stellar velocity distribution is likely to affect the dynamics of the core around the time of collapse, when this distribution may be changing rapidly and the increased interaction rate may be causing anisotropy. Indeed, Baumgardt et al. (2003) have recently found with -body simulations that anisotropy near the cluster center becomes significant during core collapse.
Third, the only explicit dependence on in the Fokker-Planck approach is through the Coulomb logarithm, so, even though GGCM91 set for their treatment of interactions, it is not clear in what sense their results, which assume a smooth, continuous distribution function, correspond to this particular value of .
Finally, we point out that our results for the initial contraction and core size during the binary-burning phase are in much better agreement with those of direct -body simulations including primordial binaries. Indeed, both Heggie & Aarseth (1992) (see their Figs. 5 and 18) and McMillan et al. (1990) (see their Fig. 1) find, as we do, that the cluster core contracts typically by a factor of about three from its initial size. GGCM91, on the other hand, find core contraction by an order of magnitude, a direct indication that their method underestimates the energy generation rate.
Perhaps a more significant difference between our results and those of GGCM91 is in the post-collapse evolution. GGCM91 find much more frequent, erratic, and deeper gravothermal oscillation cycles. Our model shows almost quasi-periodic oscillations with period and peak-to-peak amplitude . Instead, GGCM91 find 7 oscillations of widely varying periods between and 90, and . We believe this may possibly be due to differences in the numerical method of calculating (for use in eq. (1)—see discussion in Sec. 2.1), although it is not clear from their paper what method they actually use. To check the validity of our results near core collapse, we have examined more carefully the dynamics governing core re-expansion after collapse. In Figure 7, we show the evolution of the temperature profile in the cluster as the system undergoes a core collapse and rebound. The temperature in the cluster normally decreases outward everywhere, as in a star in thermal equilibrium. However, during deep core collapse, a “temperature inversion” develops for a short time. This temperature inversion is responsible for driving the rapid re-expansion of the core, as energy is now flowing inward. This mechanism has been predicted theoretically for a long time (Sugimoto & Bettwieser, 1983; Heggie & Ramamani, 1989), and has been observed directly in recent -body simulations (Makino, 1996). However, to our knowledge, ours is the first numerical demonstration of this effect for a cluster containing primordial binaries. In all previous studies, the binaries were assumed to form dynamically via three-body interactions or two-body tidal captures during deep core collapse. As noted in the introduction, these mechanism are now considered unrealistic, as they most likely lead to stellar mergers (which were not taken into account in the previous studies).
3.4 Tidally Truncated Clusters
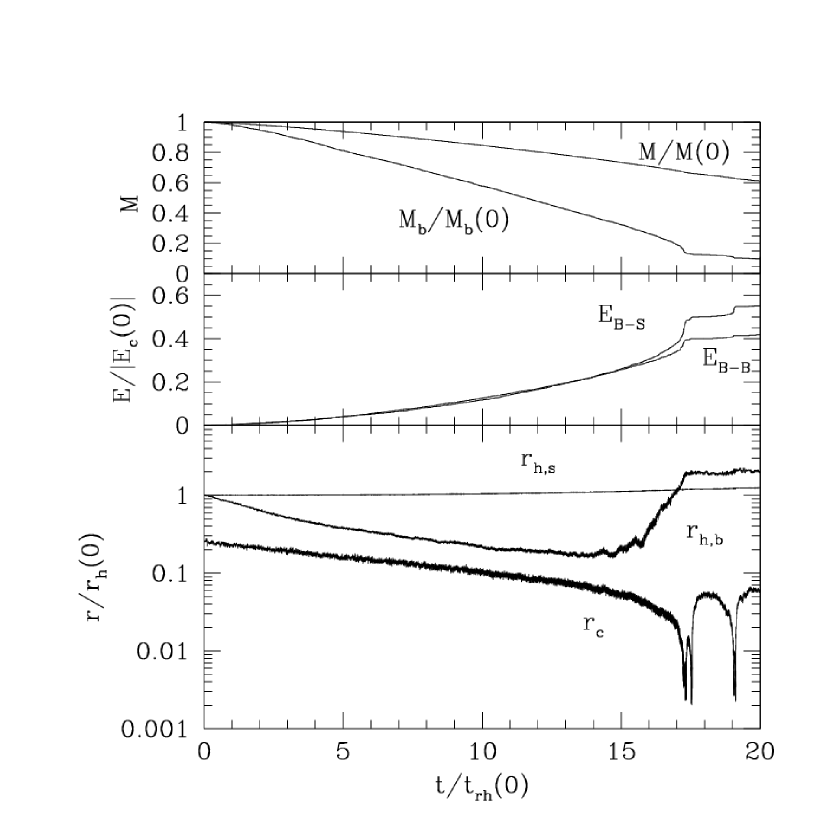
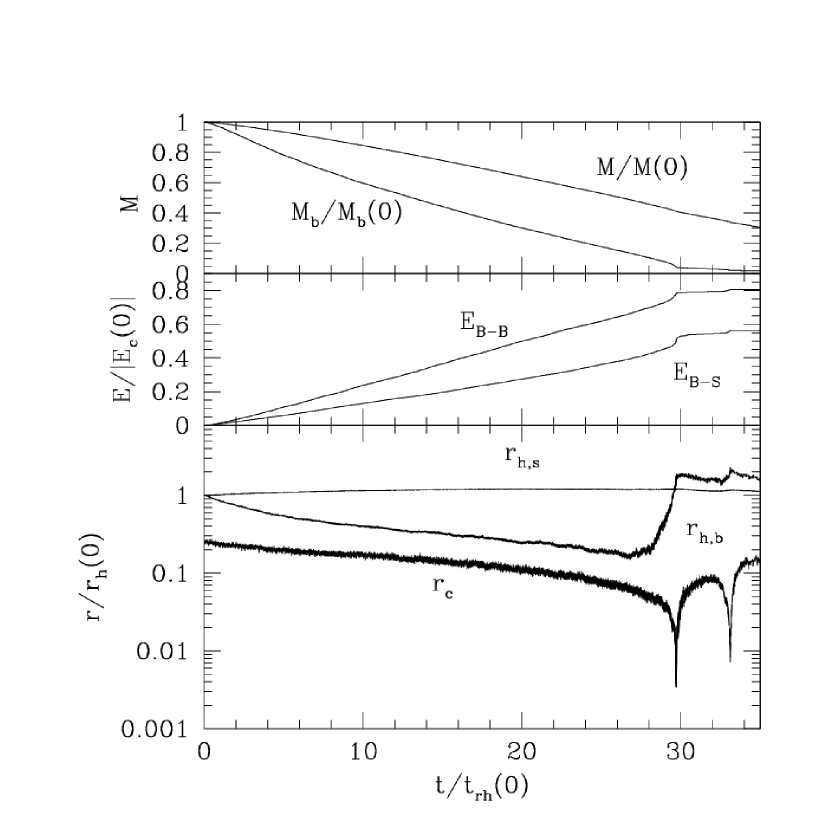
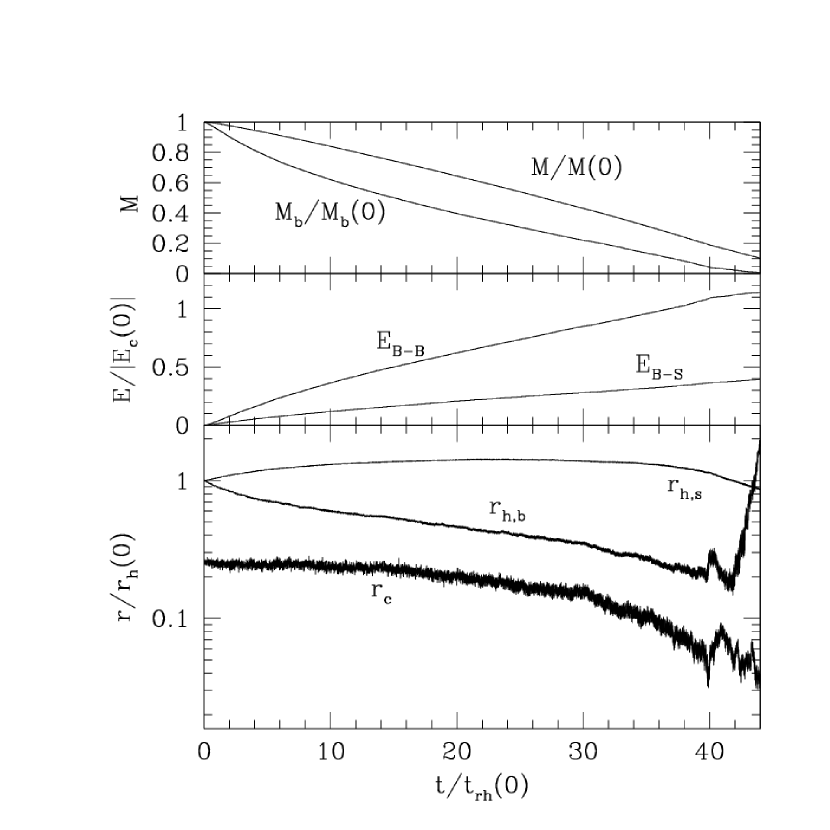
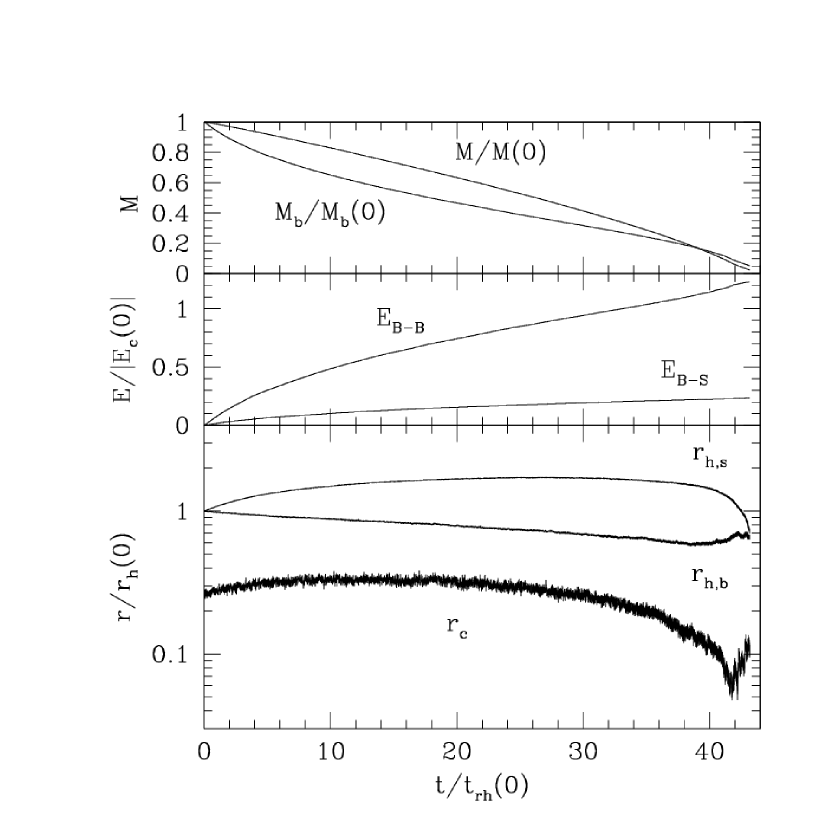
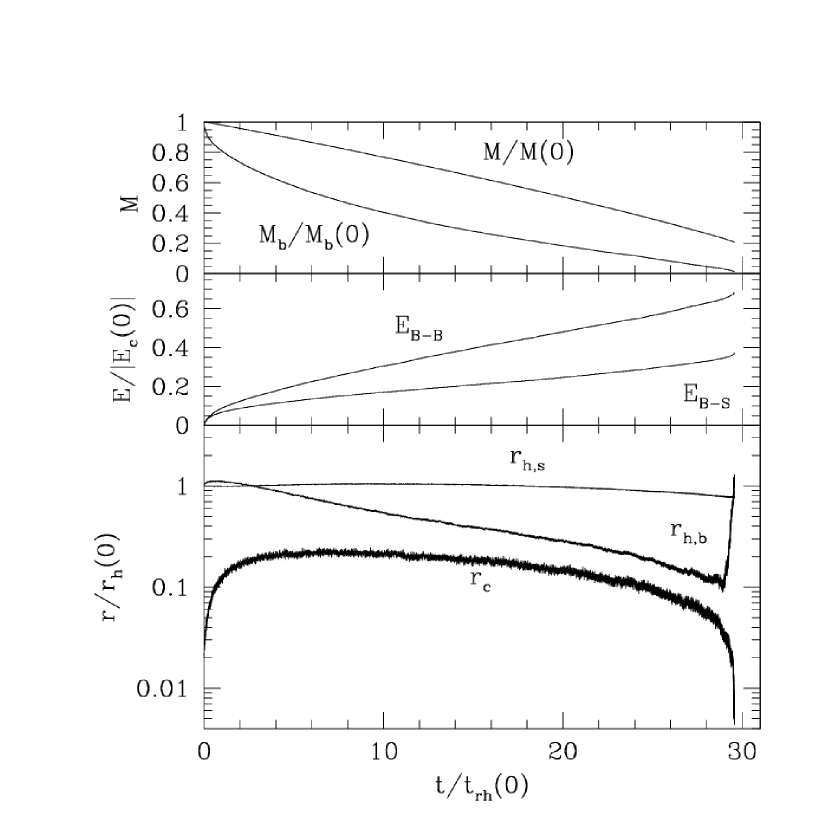
We now present our results for more realistic, tidally truncated clusters. Figures 8–11 show the evolution of King models with and initial binary fractions , 0.05, 0.1, and 0.2, respectively. Several striking differences with isolated clusters are immediately apparent. First, we see that the initial core contraction phase is absent. For , the core radius decreases slowly and monotonically all the way to collapse. For higher binary fractions (Fig. 11), the core radius increases slightly at first. This is simply because the initial binary burning rate in this model is close to the rate needed to reach thermal equilibrium. The higher the initial binary fraction and central density (see below), the stronger the tendency for the core to expand initially instead of contracting. Second, core collapse111It should be noted that, in much of the literature on globular cluster dynamics, the term “core collapse” is used to refer to the initial core contraction phase (which we see here can actually be expansion instead), and what we call the binary burning phase is then called the “post-collapse” phase. Clearly this terminology no longer makes sense, and should be abandoned. What we call “core collapse” in this paper refers to the brief episodes of deep core collapse at the onset of and during gravothermal oscillations. or complete disruption always occurs in less than about . For , the disruption time decreases with increasing binary fraction, and complete disruption occurs before any deep core collapse. This is in contrast to the models with lower binary fractions (Figs. 8 and 9), where core collapse followed by gravothermal oscillations (similar to those observed for isolated clusters in the previous section) occur before disruption. The possibility for a cluster to suffer complete disruption before core collapse is a qualitatively new behavior introduced by primordial binaries. Indeed, all King models without binaries (and without stellar evolution) reach core collapse before disrupting (see Paper II and Quinlan 1996).
Figures 12 and 13 show the evolution of King models with 10% binaries but different values of . For the very centrally concentrated cluster with (Fig. 12), significant core expansion occurs in the first few relaxation times (with increasing by about an order of magnitude). This is a more extreme example of the behavior already noted in Fig. 11. The final evolution of this cluster is also peculiar: this is one of few examples (see Table 1) we encountered where the binaries are completely exhausted before the cluster disrupts. At , about 20% of the initial cluster mass remains in single stars, and the cluster undergoes deep core collapse. Since there are no binaries left, and our simulations include no other source of energy, no re-expansion can occur and we must terminate the calculation.
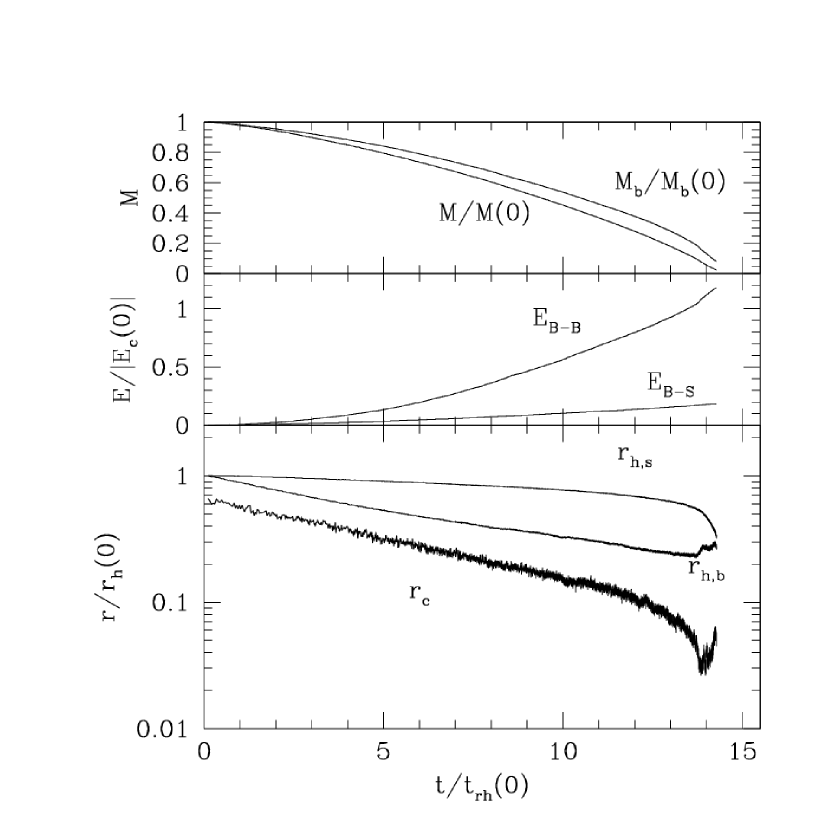
For a model with , which has a much more nearly-uniform density profile initially, complete disruption occurs before core collapse even with much lower binary fractions (see Table 1). For the model with shown in Fig. 13, disruption occurs at . For comparison a single-component King model undergoes core collapse at (Paper II). Also note how the core contracts throughout the evolution at a nearly-constant rate much faster than in models with higher values of (compare, e.g., Fig. 10). Just before final disruption, the core radius has decreased by about an order of magnitude from its initial value.
Only a few small -body simulations of tidally truncated clusters with primordial binaries have been reported previously (Heggie & Aarseth, 1992; McMillan & Hut, 1994). Detailed comparisons are not possible because these studies assumed rather different initial models and the -body results (for ) are very noisy. However, we do see good qualitative agreement, with mass loss rates times larger than for isolated clusters, and complete disruption also observed after a few tens of initial half-mass relaxation times in all -body simulations. We are not aware of any previous Fokker-Planck simulations of tidally truncated clusters with primordial binaries (GGCM91 considered only isolated Plummer models).
3.5 Evolution of the Binary Population
In addition to affecting the global cluster evolution, binary interactions also strongly affect the properties of the binaries themselves. The study of the evolution of a primordial binary population dates back to the seminal work of Heggie (1975), but it is only recently that detailed numerical simulations of large binary populations in globular clusters have been performed (Hut et al., 1992b; Giersz & Spurzem, 2000). We can use the results of our Monte Carlo simulations to study the dynamical evolution of the binary population.
Fig. 14 shows the evolution of the binary fraction, , in different regions of our evolving King models. There is a clear trend for to increase in the core and decrease in the halo with time, as well as a trend for to grow more with smaller . In spite of mass segregation and the tendency for binaries to dominate the central region of a cluster (following the development of the Spitzer instability; see Sec. 3.3), core binary fractions rarely exceed 0.5 in our models. Thus the range of initial binary fractions we consider are at least in rough agreement with the measurements of core binary fractions in globular clusters today (; see Sec. 1). Note, however, that the present-day binary fraction in the core of a cluster cannot be related simply to the cluster’s initial binary fraction, as it may depend in a complicated way on several initial parameters. For example, we see that an initial model with has, during most of its evolution, about the same core binary fraction () as an initial model with . In addition, recall that our definition of in these simulations includes only the hard binaries. For reasonable distributions of primordial binary separations, including several more decades on the soft side, the true initial binary fraction in the cluster might have been times larger than our quoted value of (this is the reason why we did not consider values of , which could not be realistic, unless dynamics already plays an important role during the process of star formation; see Clarke et al. 2000).
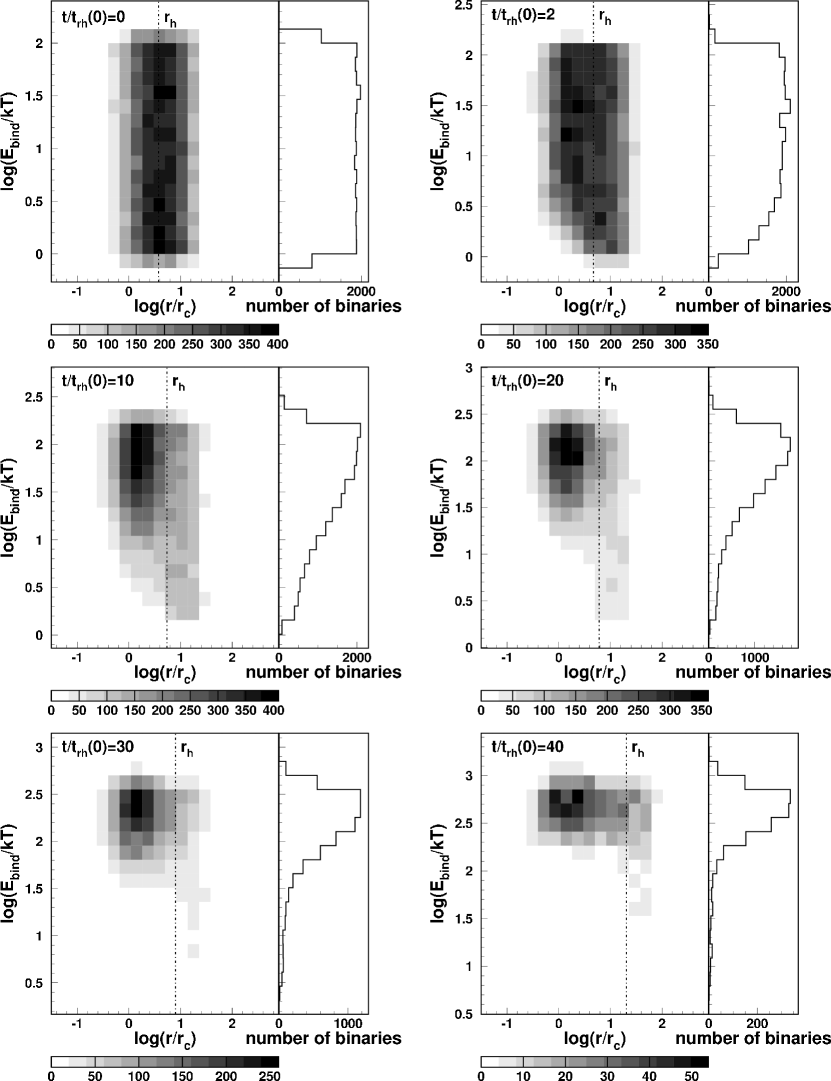
Fig. 15 shows the evolution of the primordial binary population in a King model with . Each 2-D histogram shows the distribution of binding energies (initially flat in ) and radial positions in the cluster. In addition to the clear tendency for mass segregation and hardening of the binaries, we note the development of a strong correlation between hardness and radial distribution: harder binaries tend to concentrate in the cluster core much more than softer binaries, in spite of having all the same mass (and in contrast to the fundamental assumption made in the Fokker-Planck calculations of GGCM91). The general trends observed here are in good qualitative agreement with the results of previous studies using more idealized models (Hut et al., 1992b; Giersz & Spurzem, 2000, see, e.g., their Fig. 25).
Near the end of the evolution shown in Fig. 15 (but already before complete disruption, when the cluster still retains about 40% of its initial mass), a particularly striking situation develops where all the surviving binaries in the cluster core are extremely hard. Recall that our initial upper limit on the binding energy of a binary (, where “” is the average kinetic energy of stars in the core) roughly corresponds to contact for two solar-like stars. Therefore, most of the binaries remaining after , with binding energies now in the range , would have merged if they contained solar-like stars (perhaps forming blue stragglers). Of course, in a real cluster, many of these binaries could contain compact objects (most likely heavy white dwarfs and neutron stars) and would then have survived. We cannot address any of these issues here, since our simulations are clearly too idealized, but we point out that globular cluster cores are indeed observed to contain large populations of blue stragglers, WUMa binaries (eclipsing systems containing two main-sequence stars in a contact configuration; see, e.g., Albrow et al. 2001), and a variety of “ultracompact” binaries containing neutron stars and white dwarfs (the most extreme example being perhaps the “11-minute” X-ray binary in NGC 6624; see, e.g., Deutsch et al. 2000).
4 Summary and Comparison with Observations
We have performed, for the first time, discrete simulations of globular clusters with realistic numbers of stars and primordial binaries, using our 2D Monte Carlo code with approximate analytical cross sections for primordial binary interactions.
We have compared the use of cross sections with exact, dynamical integrations of binary–single encounters, and find that the agreement between the two methods is strong, although our current implementation of the cross sections, based on the Fokker-Planck study by Gao et al. (1991), tends to overestimate slightly the energy generation rate. Consequently, models that use cross sections tend to overestimate core collapse times for clusters in which binary–single interactions dominate. However, we find that binary–binary interactions dominate the energy generation for , a result that is in quantitative agreement with a simple Spitzer-type stability criterion applied to the component of binaries.
We have studied the evolution of isolated clusters with varying binary fractions, and have found that the presence of even a small fraction of binaries is sufficient to delay significantly the onset of core collapse. Isolated clusters with a binary fraction greater than about 0.1–0.2 can avoid core collapse for as much as . We find a simple linear relation between the core collapse time of a cluster, , and the core collapse time of the same cluster with binary interactions turned off (but mass segregation still present), denoted , given by . We have compared our results with those of Gao et al. (1991), and find reasonable agreement, with nearly identical rates of binary burning and destruction. Gao et al. (1991), however, find a shorter core collapse time, a deeper initial core contraction, and significantly more erratic behavior during the gravothermal oscillation phase. We attribute the differences primarily to their neglect of the strong correlation between binary hardness and spatial distribution in the cluster, as well as fundamental differences between their 1-D Fokker-Planck method and our 2-D Monte Carlo method. Our results for the initial core contraction are in much better agreement with those of direct -body simulations. In addition, we have presented the first numerical demonstration of the theoretically predicted temperature inversion powering re-expansion after core collapse and gravothermal oscillations for a cluster with primordial binaries.
We have also considered more realistic, tidally truncated King models. We have found that the initial core contraction phase is absent in these systems, or replaced by an initial expansion of the core, and that core collapse or complete tidal disruption always occurs in less than . For a binary fraction , the disruption time decreases with increasing binary fraction, and complete disruption occurs before any deep core collapse. The possibility for a cluster to suffer complete disruption before core collapse is a qualitatively new behavior introduced by primordial binaries. Our results are in good qualitative agreement with previous studies of tidally truncated clusters containing primordial binaries.
We have already argued in Section 3.5 that our results are in general agreement with current determinations of binary fractions in globular cluster cores, typically . We now briefly consider our basic predictions for the structural parameters of clusters during the binary burning phase and compare them to the observed structural parameters of globular clusters. While our models are clearly far too idealized for any detailed comparison, it is useful to examine at least the most fundamental structural parameters: the core radius , the half-mass radius , and, for tidally truncated clusters, the tidal radius . Since the overall scale is largely irrelevant (although it could in principle be set by relating the maximum binding energy of the binaries to a stellar radius), we consider only the two ratios and (or, equivalently, the concentration parameter often derived by observers using King model fits to photometric data).
Fig. 16 shows the evolution of and the concentration parameter for several King models (see Sec. 3.4). Fig. 17 shows distributions of and for Galactic globular clusters, with data taken from the compilation of Harris (1996). The top panel shows a histogram of values for all Galactic globular clusters, including those classified observationally as “core-collapsed222It is unclear what the relation is, if any, between this observational classification — based on the absence of a good fitting King model — and the various theoretical definitions of core collapse used in the literature on dynamical modeling..” The middle and bottom panels show the distributions of observed values for and , respectively, with the “core-collapsed” clusters excluded. First, in Fig. 16, note the tendency for the concentration parameter in clusters with reasonable binary fractions () to remain around, or even converge to, . This is in reasonable agreement with the bottom panel of Fig. 17, which shows the observed distribution also centered around . The top panel in Fig. 16 shows most clusters in the binary burning phase with , also in quite reasonable agreement with the observed distribution (Fig. 17 b), although the observed peak around would require that most initial models be less centrally concentrated than our King models. We also note that both and increase significantly, and sometimes dramatically, for clusters approaching tidal disruption. Thus the suggestion from our results might be that clusters classified observationally as “core-collapsed” are those in the last few relaxation times before destruction in the Galactic tidal field. Most of our King models appear to spend roughly the last 10–20% of their lives with , or , again not too different from the observed fraction of “core-collapsed” clusters in our Galaxy (see Fig. 17 a). Of course a more serious comparison should take into account real cluster ages and the distribution of initial values for , which is rather uncertain.
We are currently in the process of implementing exact dynamical integrations to handle binary–binary interactions more accurately in our simulations, using Fewbody, a new small-N integrator we have written. This integrator performs automatic classification of outcomes, automatic stability analysis of arbitrarily large hierarchies, autonomous integration termination, and stellar collisions.
References
- Albrow et al. (2001) Albrow, M. D., Gilliland, R. L., Brown, T. M., Edmonds, P. D., Guhathakurta, P., & Sarajedini, A. 2001, ApJ, 559, 1060
- Bacon et al. (1996) Bacon, D., Sigurdsson, S., & Davies, M. B. 1996, MNRAS, 281, 830
- Bailyn (1995) Bailyn, C. D. 1995, ARA&A, 33, 133
- Baumgardt et al. (2003) Baumgardt, H., Heggie, D. C., Hut, P., & Makino, J. 2003, MNRAS (in press)
- Bellazzini et al. (2002) Bellazzini, M., Fusi Pecci, F., Montegriffo, P., Messineo, M., Monaco, L., & Rood, R. T. 2002, AJ, 123, 2541
- Breeden et al. (1994) Breeden, J. L., Cohn, H. N., & Hut, P. 1994, ApJ, 421, 195
- Chernoff & Huang (1996) Chernoff, D. F. & Huang, X. 1996, in IAU Symp. 174: Dynamical Evolution of Star Clusters: Confrontation of Theory and Observations, 263–+
- Cheung et al. (2003) Cheung, P., Portegies Zwart, S., & Rasio, F. A. 2003, MNRAS (submitted)
- Clarke et al. (2000) Clarke, C. J., Bonnell, I. A., & Hillenbrand, L. A. 2000, Protostars and Planets IV, 151
- Cool & Bolton (2002) Cool, A. M. & Bolton, A. S. 2002, in ASP Conf. Ser. 263: Stellar Collisions, Mergers and their Consequences, 163–+
- Cote et al. (1996) Cote, P., Pryor, C., McClure, R. D., Fletcher, J. M., & Hesser, J. E. 1996, AJ, 112, 574
- Davies & Hansen (1998) Davies, M. B. & Hansen, B. M. S. 1998, MNRAS, 301, 15
- Deutsch et al. (2000) Deutsch, E. W., Margon, B., & Anderson, S. F. 2000, ApJ, 530, L21
- Ferraro et al. (2001) Ferraro, F. R., D’Amico, N., Possenti, A., Mignani, R. P., & Paltrinieri, B. 2001, ApJ, 561, 337
- Ford et al. (2000) Ford, E. B., Joshi, K. J., Rasio, F. A., & Zbarsky, B. 2000, ApJ, 528, 336
- Fregeau et al. (2002) Fregeau, J. M., Joshi, K. J., Portegies Zwart, S. F., & Rasio, F. A. 2002, ApJ, 570, 171
- Gao et al. (1991) Gao, B., Goodman, J., Cohn, H., & Murphy, B. 1991, ApJ, 370, 567
- Gebhardt et al. (2002) Gebhardt, K., Rich, R. M., & Ho, L. C. 2002, ApJ, 578, L41
- Giersz & Spurzem (2000) Giersz, M. & Spurzem, R. 2000, MNRAS, 317, 581
- Goodman & Hut (1989) Goodman, J. & Hut, P. 1989, Nature, 339, 40
- Hénon (1971a) Hénon, M. 1971a, Ap&SS, 13, 284
- Hénon (1971b) Hénon, M. H. 1971b, Ap&SS, 14, 151
- Harris (1996) Harris, W. E. 1996, AJ, 112, 1487
- Heggie (1975) Heggie, D. C. 1975, MNRAS, 173, 729
- Heggie & Aarseth (1992) Heggie, D. C. & Aarseth, S. J. 1992, MNRAS, 257, 513
- Heggie & Ramamani (1989) Heggie, D. C. & Ramamani, N. 1989, MNRAS, 237, 757
- Hurley et al. (2001) Hurley, J. R., Tout, C. A., Aarseth, S. J., & Pols, O. R. 2001, MNRAS, 323, 630
- Hut (1984) Hut, P. 1984, ApJS, 55, 301
- Hut et al. (1992a) Hut, P., McMillan, S., Goodman, J., Mateo, M., Phinney, E. S., Pryor, C., Richer, H. B., Verbunt, F., & Weinberg, M. 1992a, PASP, 104, 981
- Hut et al. (1992b) Hut, P., McMillan, S., & Romani, R. W. 1992b, ApJ, 389, 527
- Hut et al. (1991) Hut, P., Murphy, B. W., & Verbunt, F. 1991, A&A, 241, 137
- Joshi et al. (2001) Joshi, K. J., Nave, C. P., & Rasio, F. A. 2001, ApJ, 550, 691
- Joshi et al. (2000) Joshi, K. J., Rasio, F. A., & Portegies Zwart, S. 2000, ApJ, 540, 969
- Kim & Lee (1999) Kim, S. S. & Lee, H. M. 1999, A&A, 347, 123
- Kim et al. (1998) Kim, S. S., Lee, H. M., & Goodman, J. 1998, ApJ, 495, 786
- Kochanek (1992) Kochanek, C. S. 1992, ApJ, 385, 604
- Kumar & Goodman (1996) Kumar, P. & Goodman, J. 1996, ApJ, 466, 946
- Lee & Ostriker (1993) Lee, H. M. & Ostriker, J. P. 1993, ApJ, 409, 617
- Lee (1993) Lee, M. H. 1993, ApJ, 418, 147
- Leonard (1989) Leonard, P. J. T. 1989, AJ, 98, 217
- Leonard & Linnell (1992) Leonard, P. J. T. & Linnell, A. P. 1992, AJ, 103, 1928
- Makino (1996) Makino, J. 1996, ApJ, 471, 796
- Makino (2001) Makino, J. 2001, in ASP Conf. Ser. 228: Dynamics of Star Clusters and the Milky Way, 87–+
- Mateo et al. (1990) Mateo, M., Harris, H. C., Nemec, J., & Olszewski, E. W. 1990, AJ, 100, 469
- McMillan & Hut (1994) McMillan, S. & Hut, P. 1994, ApJ, 427, 793
- McMillan et al. (1990) McMillan, S., Hut, P., & Makino, J. 1990, ApJ, 362, 522
- McMillan et al. (1991) —. 1991, ApJ, 372, 111
- Mikkola (1983a) Mikkola, S. 1983a, MNRAS, 203, 1107
- Mikkola (1983b) —. 1983b, MNRAS, 205, 733
- Mikkola (1984a) —. 1984a, MNRAS, 207, 115
- Mikkola (1984b) —. 1984b, MNRAS, 208, 75
- Portegies Zwart & McMillan (2002) Portegies Zwart, S. F. & McMillan, S. L. W. 2002, ApJ, 576, 899
- Portegies Zwart et al. (2001) Portegies Zwart, S. F., McMillan, S. L. W., Hut, P., & Makino, J. 2001, MNRAS, 321, 199
- Pryor et al. (1988) Pryor, C. P., Latham, D. W., & Hazen, M. L. 1988, AJ, 96, 123
- Quinlan (1996) Quinlan, G. D. 1996, New Astronomy, 1, 255
- Rasio et al. (2000) Rasio, F. A., Pfahl, E. D., & Rappaport, S. 2000, ApJ, 532, L47
- Rubenstein & Bailyn (1997) Rubenstein, E. P. & Bailyn, C. D. 1997, ApJ, 474, 701
- Sigurdsson & Phinney (1995) Sigurdsson, S. & Phinney, E. S. 1995, ApJS, 99, 609
- Spitzer (1987) Spitzer, L. 1987, Dynamical evolution of globular clusters (Princeton, NJ, Princeton University Press, 1987, 191 p.)
- Spitzer & Mathieu (1980) Spitzer, L. & Mathieu, R. D. 1980, ApJ, 241, 618
- Spitzer & Hart (1971) Spitzer, L. J. & Hart, M. H. 1971, ApJ, 164, 399
- Sugimoto & Bettwieser (1983) Sugimoto, D. & Bettwieser, E. 1983, MNRAS, 204, 19P
- Takahashi & Portegies Zwart (1998) Takahashi, K. & Portegies Zwart, S. F. 1998, ApJ, 503, L49+
- Takahashi & Portegies Zwart (2000) —. 2000, ApJ, 535, 759
- Watters et al. (2000) Watters, W. A., Joshi, K. J., & Rasio, F. A. 2000, ApJ, 539, 331
- Yan & Mateo (1994) Yan, L. & Mateo, M. 1994, AJ, 108, 1810
| Model | ||||
|---|---|---|---|---|
| Plummer | 2% | 22 | 0.94 | 0.20 |
| Plummer | 5% | 39 | 0.90 | 0.14 |
| Plummer | 10% | 72 | 0.83 | 0.17 |
| Plummer | 20% | 120 | 0.75 | 0.28 |
| Plummer | 30% | 180 | 0.70 | 0.35 |
| King, | 2% | 15 | 0.25 | 0.04 |
| King, | 5% | 17 | 0.00 | 0.00 |
| King, | 10% | 15 | 0.00 | 0.00 |
| King, | 20% | 14 | 0.00 | 0.00 |
| King, | 2% | 18 | 0.42 | 0.07 |
| King, | 5% | 22 | 0.22 | 0.02 |
| King, | 10% | 25 | 0.00 | 0.00 |
| King, | 20% | 23 | 0.00 | 0.00 |
| King, | 2% | 17 | 0.67 | 0.14 |
| King, | 5% | 30 | 0.41 | 0.04 |
| King, | 10% | 50 | 0.00 | 0.00 |
| King, | 20% | 42 | 0.00 | 0.00 |
| King, | 2% | 10 | 0.71 | 0.19 |
| King, | 5% | 20 | 0.43 | 0.05 |
| King, | 10% | 30 | 0.20 | 0.01 |
| King, | 20% | 38 | 0.00 | 0.00 |