Chemical changes during star formation: high- vs. low-mass YSOs
Abstract
Recent observational studies of high- and low-mass YSOs at (sub)millimeter and infrared wavelengths are reviewed, and chemical diagnostics of the different physical components are summarized. Methods for determining the temperature, density and abundance profiles in the envelopes are outlined, and are illustrated for one high-mass and one low-mass YSO. The combination of (sub)millimeter and infrared data gives a nearly complete chemical inventory of the gas and solid state material. In both high- and low-mass YSOs, the chemical characteristics are dominated by freeze-out in the cold outer part of the envelope and evaporation of ices in the warm inner part. Abundance jumps of factors of 100 in selected molecules are found in the warm gas for both types of objects. Potential differences include (i) the complex hot core chemistry, which has been observed so far only for high-mass YSOs; (ii) the high level of deuterium fractionation seen only in low-mass YSOs; (iii) the effects of internal or external UV and X-rays; (iv) the relative importance of shocks versus thermal heating of the envelope; and (v) the importance of geometrical effects. Prospects for future observational facilities are mentioned.
keywords:
ISM: molecules – ISM: chemistry – Star formation: high-mass – Star formation: low-mass1 Introduction
The formation of low- and high-mass stars is accompanied by large changes in the temperature and density structure in their surrounding envelopes. The chemistry responds to these changes by opening up different chemical routes (e.g., van Dishoeck & Blake 1998, Hartquist et al. 1998, Langer et al. 2000). For example, in the coldest (10 K), densest regions the time scales for freeze-out are so short that most molecules stick onto the grains. Close to the young protostars, the grains are heated to at least 100 K resulting in the evaporation of ices which can subsequently drive a rich gas-phase chemistry. At even higher temperatures (230 K), most of the oxygen is driven into water and a different chemistry ensues. In this paper, a brief overview is given of recent systematic studies of the chemistry in the envelopes around young stellar objects (YSOs), with special attention to the similarities and differences between low- and high-mass sources.
Progress in this field has been driven by several new developments in the last decade. First, submillimeter observations routinely sample smaller beams () and higher critical densities ( cm-3) than earlier millimeter studies, assuring less confusion with the lower-density cloud material. Bolometer arrays now readily provide maps of the continuum emission from cold dust, constraining the mass and the density structure of the envelope. High spatial resolutions down to can be obtained with interferometers, although chemical data on YSOs are still limited. For comparison, most low-mass objects observed with these facilities are located at 150 pc, where 20′′ corresponds to 3000 AU —the typical size of an envelope— and to 150 AU —the typical size of a circumstellar disk. The observed high-mass YSOs have distances of 2–4 kpc, so that much larger scales are probed. Nevertheless, it is possible to derive information on smaller scales by careful modeling of the line emission (see §2).
Second, infrared observations have matured and now provide essential complementary information to the millimeter data. Not only gas-phase molecules, but also ices, PAHs and atomic fine-structure lines can be observed at mid-infrared wavelengths – unique probes of different evolutionary stages (e.g., van den Ancker et al. 2000a,b, Nisini et al. 2002). The single-dish submillimeter emission is more sensitive to the colder outer envelope, whereas the infrared absorption is weighted toward the warmer inner region. Together, they allow a nearly complete inventory of the gas-phase and solid-state material and can firmly establish abundance gradients across the envelope.
Third, the tools for the analysis of the observational data have improved substantially. Continuum and line radiative transfer codes are being extended from 1-dimension (1D) to 3-dimensions (3D) (e.g., Juvela 1997, Wolf et al. 1999). More importantly, the 1-D codes have been tested critically against each other, establishing their accuracy (van Zadelhoff et al. 2002).
Several systematic studies of the chemistry in samples of low- and high-mass YSOs have been carried out in the last five years or are in progress (e.g., Hatchell et al. 1998a,b, Hogerheijde et al. 1999, van der Tak et al. 2000a,b, Lahuis & van Dishoeck 2000, Shah & Wootten 2001, Buckle & Fuller 2002, Jørgensen et al. 2002, Boonman et al. 2003b,c, Johnstone et al. 2003, Maret et al., in prep.). Questions to be addressed with these surveys are: (i) What is the physical structure of the envelope (, )? Do continuum and line data give the same results? (ii) Which molecule/line traces which component? Can one uniquely distinguish envelope, outflow, disk and surrounding low-density cloud? (iii) How does the chemical composition change between different sources? Is this related to evolution or do other parameters play a role? (iv) What are the differences between high- and low-mass YSOs? (v) What do the data tell us about basic chemical processes, in particular gas-grain interactions, grain-surface chemistry and high temperature gas-phase chemistry?
In this paper, a brief review and progress report of recent results is given, focussing on items (i), (iii) and (iv). In §2, the analysis methods are outlined in more detail. In §3, the results on high-mass YSOs are summarized and illustrated by discussing one source in detail (AFGL 2591). In §4, the same recipe is followed for low-mass YSOs, using IRAS 16293-2422 as the example. In §5, hot core and envelope models are summarized. Similarities and differences between high- and low-mass YSOs are discussed in §6, followed by a summary in §7. For more extensive reviews of older work, see van Dishoeck & Blake (1998), van Dishoeck & Hogerheijde (1999) and van Dishoeck & van der Tak (2000).
2 Analysis methods
Tradionally, chemical abundances have been derived using simple tools, such as rotation diagrams assuming a constant excitation temperature or statistical equilibrium calculations using an escape probability for a single temperature and density . In both cases, comparison with a ‘standard’ molecule such as CO is needed to derive the abundance with respect to H2. It is well known that this method can lead to abundances that are in error by more than an order of magnitude. For example, the use of versus cm-3 for the interpretation of the HCN =4–3 line with cm-3 gives a factor of 10 difference in derived HCN abundance. Densities are known to range from to cm-3 across protostellar envelopes, so which density is the appropriate one for this line? Neglect of beam dilution and optical depth effects can result in similar or even larger errors. For example, the emission from the complex organic molecules may originate in the inner , much smaller than the observational beam of .

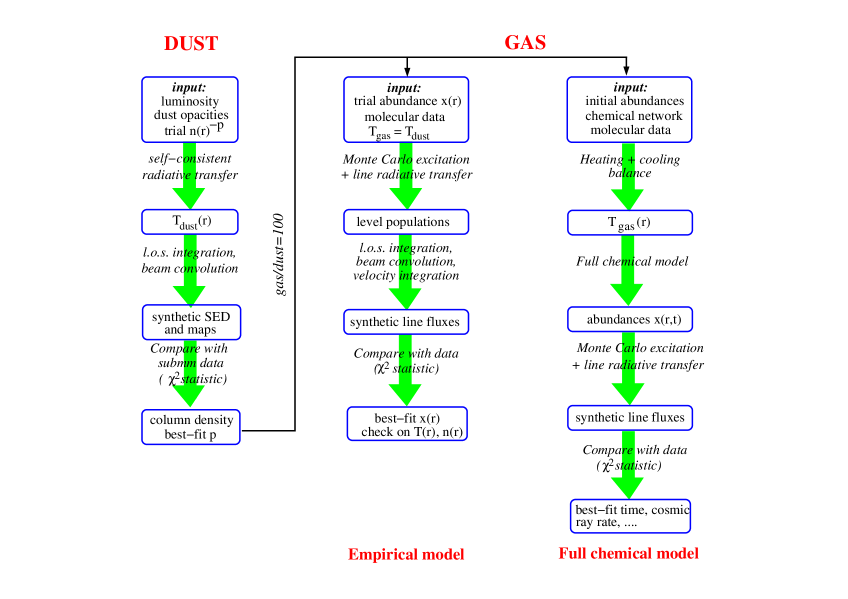
The modern analysis method starts with a physical model of the source, constrained by observations. The excitation and radiative transfer are subsequently calculated through this model and the resulting sky brightness distribution is convolved with the beam profile, or, in the case of interferometer data, analyzed with the same spatial filtering. The abundance of the molecule is then adjusted until agreement with the observational data is reached (see Fig. 8 of van Dishoeck & Hogerheijde 1999 for outline). To constrain the physical models, two approaches are taken. Both assume a 1D spherically symmetric model with a power-law density profile —the simplest realistic source model— and calculate the dust temperature profile through the envelope explicitly. In the first method, lines of the same molecule (e.g., CS 2-1, 3-2, 5-4, 7-6, 10-9) are used to constrain the power-law index of the density structure (e.g., Zhou et al. 1994, van der Tak et al. 2000a) (see Figure 1). The critical asumption is that the abundance of the molecule does not vary with position in the envelope. The second, now more robust approach uses the observed dust continuum maps and spectral energy distribution (SED) to constrain the density profile (see Figure 2) (e.g., Shirley et al. 2002, Jørgensen et al. 2002). For each trial density structure, the dust temperature is calculated and the preferred power-law index is determined by a -fit to the observational data. This method assumes that the dust emissivity does not vary across the envelope.
The accuracy in derived power-law index is typically 0.2 and the density gradient is generally smooth, with little evidence for clumping. Within the inner envelope out to a few thousand AU, various analyses of the same sources usually agree well. The major differences are in the outer part, especially in the extent of the envelope and its merging with the surrounding cloud. Also, external UV radiation can increase the outer dust temperature. Deviations from spherical geometry due to e.g. outflow cavities may affect the optical depths at infrared wavelengths by up to a factor of three.
Once the physical structure is fixed, the line emission of different molecules can be calculated to determine the abundances, assuming a gas/dust ratio of 100 and a gas temperature that is equal to the dust temperature. The latter assumption is known to fail in the outer, lower density part of the envelope, where the gas temperature can either fall below the dust temperature in the absence of external heating (e.g., Doty & Neufeld 1997) or be above the dust temperature in the case of external ultraviolet radiation (e.g., Kaufman et al. 1998). Test models which calculate the gas temperature explicitly generally give very similar results for the inferred abundances, so that this difference can be neglected to first order. For small beams and high-frequency lines, the differences in extent of the model envelopes do not affect the abundance analyses.
In the baseline models, the abundance of the molecule is assumed to be constant with envelope radius and is the single parameter to be fitted to the data. If lines originating from a large range of energies are available, abundance profiles can be constrained. The simplest assumption here is a ‘jump’ in the abundance at a temperature where a chemical change is expected, for example around 100 K where evaporation of ices occurs. H2CO, CH3OH and SO2 are three well-known examples of molecules for which lines with upper level energies ranging from 10 to 300 K are commonly observed in the 150–370 GHz atmospheric windows and for which such abundance jumps have been inferred (e.g., Ceccarelli et al. 2000, van der Tak et al. 2000b, Schöier et al. 2002). The free parameters are now the inner and outer abundances and the location of the jump. The latter parameter is usually taken to be fixed at the radius where K. Accurate collisional rate coefficients for the various molecules are an essential ingredient for these analyses (e.g., Schöier et al., this volume). Such data are often lacking for more complex molecules, where LTE excitation must be assumed.
The scheme discussed above describes the ‘empirical’ modeling to derive chemical abundances directly from observations. Alternatively, one can couple chemical models with the physical structure derived from observations to calculate the abundances explicitly with radius and time in a ‘full chemical model’. The radiative transfer for the different molecules then provides line intensities which can be compared with observations for consistency. The parameters to adjust in these models are those that enter the chemical models, such as the cosmic-ray ionization rate, the initial elemental and molecular abundances, and the time since the abundances were last reset by some physical event (e.g., Doty et al. 2002).
3 High-mass YSOs
3.1 Recent observations
A number of recent submillimeter line surveys have highlighted the large variations in chemical composition toward different YSOs. Toward Orion-KL, the recent 650 and 850 GHz surveys illustrate the chemical richness of this source, even at high frequencies (Schilke et al. 2001). Observations toward different positions have shown large chemical variations, for example in oxygen and nitrogen-bearing molecules between the ‘hot core’ and ‘compact ridge’ (e.g., Sutton et al. 1995) and in chemical complexity with the line-poor Orion-S position. Such differences are also reflected in infrared spectra toward the Orion-KL region, e.g., by selective absorption or emission of species like HCN, C2H2 and CO2 (Evans et al. 1991, Boonman et al. 2003a). For Sgr B2, the spectra toward the N, M and NW positions are dominated by organic molecules, sulfur-bearing species and simple species including carbon chains, respectively (Nummelin et al. 1998, 2000). Similar characteristics are seen towards the W3(H2O), W3 IRS5 and W3 IRS4 positions (Helmich & van Dishoeck 1997). These variations have been interpreted as being due to differences in time scales since evaporation of the ices and variations in initial ice compositions (e.g., Charnley et al. 1992, Rodgers & Charnley 2001, see §5).

| Component | Chemical | Submillimeter | Infrared | Examples | Examples |
|---|---|---|---|---|---|
| characteristics | diagnostics | diagnostics | High-mass | Low-mass | |
| Surrounding cloud | Low-T chemistry | Ions, long-chains | Simple ices | SgrB2 (NW) | TMC-1 |
| (HC5N, …) | (H2O, CO) | ||||
| Cold envelope | Low-T chemistry, | Simple species | Ices | N7538 IRS9, | N1333 IRAS4B, |
| Heavy depletions | (CS, N2H+) | (H2O, CO2, CH3OH) | W 33A | IRAS 16293 (out) | |
| Inner warm | Evaporation | High Tex | High gas/solid, High | GL 2591, | N1333 IRAS4A (in), |
| envelope | (CH3OH, H2CO) | Tex, Heated ices | GL 2136 | IRAS 16293 (in) | |
| (C2H2, H2O, CO2) | |||||
| Hot core | High-T chemistry | Complex organics | Hydrides | Orion hot core, | ? |
| (CH3OCH3, CH3CN, | (OH, H2O) | SgrB2(N),G34.3 | |||
| vib. exc. mol.), high HCN | W 3(H2O) | ||||
| Outflow: | Shock chemistry, | Si- and S-species | Atomic lines, Hydrides | W 3 IRS5, | L1448-mm, |
| Direct impact | Sputtering | (SiO, SO2) | ([S I], H2O, H2 high-J) | SgrB2(M) | L1157 |
| Outflow: | Evaporation | Morphology | Hydrides | ? | L1527, B5 IRS1 |
| Turbulent entrainment | (CH3OH, HCO+, HCN) | (H2 low-J) | Serpens SMM1 | ||
| PDR, Compact | Photodissociation, | Ions, radicals | Ionic lines, PAHs, H2 | S 140, | ? |
| H II regions | Photoionization | (CN/HCN, CO+) | ([NeII], [CII]) | W 3 IRS4 |
The chemical variations are known to occur on small scales down to 2000 AU or less. For example, Wyrowski et al. (1999) observed significant differences between the W3(OH) and W3(H2O) positions, only 7′′ (1500 AU) apart. Watson et al. (2002) find strong CH3CN emission toward only one of the two continuum sources separated by less than 4′′ (8000 AU) in W75N, a phenomenon also observed for other sources. Liu & Blake (in prep.) mapped various molecules in a chain of 8 UC HII regions along G9.62+0.19, with the complex and sulfur-bearing molecules appearing only in 1 or 2 ‘hot cores’. Thus, care has to be taken in the interpretation of unresolved single-dish data.
The above observations have led to an operational definition of a ‘hot core’ as a compact (0.1 pc), warm ( K) and dense ( cm-3) parcel of gas characterized by rich molecular line emission (e.g, Walmsley 1992). It is currently not clear whether the ‘hot core’ is a physically distinct component or whether it is simply the warm part of the inner envelope at a certain stage of chemical evolution. For massive YSOs, a compressed, dense shell may be formed at the edge of the expanding ultra- or hyper-compact H II region due to the pressure from the ionized gas. Chemically, there is also a difference between simple evaporation of ices (as observed for W3 IRS5) and the subsequent ‘hot core chemistry’ between evaporated species leading to more complex organic molecules and highly crowded submillimeter line spectra (as observed for W3(H2O)). In this paper, only the latter case will be termed a ‘hot core’.
Comprehensive surveys of a larger sample of objects in selected molecules are only just appearing. At submillimeter wavelengths, Hatchell et al. (1998a,b) observed a set of 14 UC HII regions in selected settings with the JCMT, with about half the sources showing the characteristic crowded hot core spectra. Ikeda et al. (2001) surveyed a few characteristic complex organic molecules toward a number of massive YSOs and found trends with increasing dust temperature for some, but not all, species, allowing molecules which originate in the inner envelope from high temperature chemistry or evaporation of grain mantles to be separated from those which occur mostly in the colder outer envelope.
Van der Tak et al. (2000a) selected a sample of 14 massive young stars for JCMT observations, most of which are bright at mid-infrared wavelengths. The infrared bright sources do not show strong emission from complex organic species, suggesting that they have not yet reached the hot core stage. The data have been analyzed systematically along the lines illustrated in Figure 2, so that reliable empirical abundances are available for this sample. For some sources, jumps in the abundances of two orders of magnitude of selected molecules (CH3OH, SO2) have been found in the inner envelope (van der Tak et al. 2000b, 2003).
The submillimeter data of the infrared-bright sample have been complemented by mid-infrared surveys with the ISO-SWS. The abundances of species like HCN and C2H2 (Lahuis & van Dishoeck 2000), CO2 and H2O (Boonman et al. 2003b,c) show systematic increases, which correlate well with other temperature tracers such as the far-infrared color, the gas/solid ratios and the heating signatures in the ice profiles (e.g., Gerakines et al. 1999, Boogert et al. 2000). Sulfur-bearing species present a more confusing picture, both at infrared (Keane et al. 2001) and submillimeter wavelengths (van der Tak et al. 2003), with both hot core chemistry and shocks likely playing a role.
If higher temperatures are indeed due to increased dispersion of the envelope (i.e., decreasing /), this ‘global warming’ may be interpreted as an evolutionary effect and the above features can then be used as powerful tracers of the earliest stages of massive star formation, even before the hot core and UC HII phases. In this respect, the analysis of massive YSOs appears ahead of that of low-mass YSOs, where systematic trends within the equivalent Class 0 or I stages are still difficult to discern, partly due to a lack of infrared spectroscopy (see §4).
3.2 AFGL 2591 as an example
The case of AFGL 2591 presents a good example of the power of the analysis techniques and the information that can be derived on the chemical structure, both from the ‘empirical’ and ‘full chemical modeling’ approaches. This source has a luminosity of L⊙, and is relatively nearby ( kpc) and isolated. Figure 1 shows the best-fitting temperature and density structure, derived from the CS line ratios (van der Tak et al. 1999). The different chemical regimes are indicated. In the cold outer envelope (90 K), significant freeze-out occurs and the abundances are expected to be low. In the inner envelope, ice evaporation dominates the chemistry. The temperatures at which ices evaporate differ from species to species and range from as low as 20 K (pure CO ice) to 80–100 K (CH3OH and H2O) (e.g., Sandford & Allamandola 1993, Fraser et al. 2001). At even higher temperatures, most of the oxygen is driven into H2O and high abundances of species like HCN occur.
Figure 3 shows the HCN =9–8 line in the =0 and 1 states detected with the MPIfR/SRON 800 GHz receiver on the JCMT (Boonman et al. 2001). The low- HCN =1–0 through 4–3 lines give an abundance with respect to H2 of only in the outer envelope. The HCN =1–0 infrared absorption lines indicate a value of (Lahuis & van Dishoeck 2000). A similarly high abundance is needed to fit the =9–8 data. Together, the data give irrefutable evidence for an abundance jump of two orders of magnitude between the outer and inner regions.
A second example of the ‘empirical’ modeling is provided by the analysis of the H2O data. Strong infrared absorption within the =1–0 band at 6 m has been detected with the ISO-SWS by Helmich et al. (1996). H2O emission in the line at 557 GHz with SWAS is, however, weak (Snell et al. 1999). Boonman et al. (2003d) analyzed the combined ISO-SWS, ISO-LWS and SWAS data and tested different H2O abundance profiles. The data are only consistent with a low abundance of in the outer region caused by freeze out, and a high abundance up to in the inner region due to evaporation.
For AFGL 2591, the ‘full chemical model’ analysis has also been performed. Doty et al. (2002) have taken the density structure of van der Tak et al. (1999) and solved self-consistently for the gas temperature. They then ran a time-dependent chemistry as a function of position in the envelope, keeping the physical structure fixed. The initial abundances are assumed to be low in the outer envelope (90 K), but high for selected species in the inner envelope due to evaporation of ices. The resulting abundances are compared with those derived from observations in the inner and outer regions, respectively, and a best-fitting cosmic-ray ionization rate and time is determined. For AFGL 2591, the inferred young chemical ‘age’ of yr is consistent with the fact that this source does not yet show strong radio continuum emission.
Examples of abundance profiles as functions of time are shown in Figure 4. For some species, the ‘jump’ or ‘anti-jump’ model used in the empirical model is seen to be a good approximation, but in other cases a more complex chemical profile is more appropriate. Such detailed chemical models can be taken as guidance for the trial abundance profiles to be used in the empirical modeling.

4 Low-mass YSOs
4.1 Recent observations
The observed low-mass YSOs are closer than their high-mass counterparts, so that higher spatial resolution can be obtained allowing different chemical components to be resolved. However, their envelope masses are 1–2 orders of magnitude lower and their lines generally weaker, especially at higher frequencies. Many observations have therefore been performed at lower frequencies in large beams, but care has to be taken that such data do not apply mostly to extended, lower-density cloud material rather than the YSO envelope. Examples of recent chemical surveys of selected molecules toward low-mass YSOs include Hogerheijde et al. (1999), Shah & Wootten (2001), Buckle & Fuller (2002), Jørgensen et al. (2002, see also this volume), and Maret et al. (in preparation). While simple molecules such as HCN, HCO+, H2CO and even CH3OH are readily detected, none of these sources have the crowded line spectra characteristic of high-mass hot cores. They also do not show strong lines due to unsaturated long carbon chains, such as seen toward some pre-stellar cores like TMC-1S. Extremely high deuterium fractionation is observed for most sources (e.g., van Dishoeck et al. 1995), including the detection of doubly-deuterated (Loinard et al. 2001) and even triply-deuterated species (van der Tak et al. 2002).

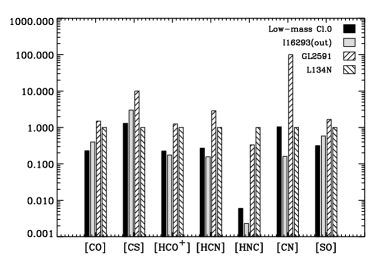
The sample of 16 YSOs by Jørgensen et al. (2002) has been analyzed systematically using the techniques outlined in Figure 2 and covers both deeply embedded class 0 objects and more evolved class I sources. The figures by Jørgensen et al. (this volume) show some of the trends in the derived abundances. For the class 0 objects, significant freeze-out is inferred, even for species like CO which start to evaporate at relatively low temperatures. Class I objects generally show very weak lines (see Figure 5), but the abundances are closer to general molecular cloud values. Surprisingly large variations in the HCN, HNC and CN abundances and abundance ratios are found between sources (see also §6). Johnstone et al. (2003, this volume) have observed a sample of 7 intermediate-mass YSOs and find clear trends in the abundances with temperature of the source.
For the class 0 objects, sufficient lines of H2CO and CH3OH can be observed to test the presence of abundance jumps. Indeed, jumps of factors of 100 or more have been inferred for several species and sources (Ceccarelli et al. 2000, Schöier et al. 2002, Maret et al., in prep.). Such large enhancements are not only found in the innermost envelope, but can also occur at positions in outflow lobes, which can be spatially separated for some low-mass YSOs (e.g., Bachiller & Pérez-Gutiérrez 1997, Garay 2000).
At far-infrared wavelengths, 45–197 m spectra of 28 low-luminosity YSOs have been measured with the ISO-LWS (see Nisini et al. 2002 for summary). In spite of the low spectral resolution (), lines of H2O, OH and CO are clearly detected in several sources with H2O strong toward class 0 objects and OH becoming relatively more prominent toward class I objects, probably due to enhanced UV radiation (Spinoglio et al. 2000, Fig. 6). Because these data refer to large beams (90′′), both the envelope and large-scale outflows can contribute to the emission, but the overall H2O abundance in class 0 YSOs is high, . For intermediate and high-mass YSOs, the ISO-LWS spectra show much fewer H2O lines (e.g., Lorenzetti et al. 2002). This is partly due to photodissociation by enhanced UV radiation, but also because these objects are more distant so that the data suffer more from beam dilution.
Bergin et al. (2002) have mapped the low-mass NGC 1333 star-forming region with SWAS in the ground-state o-H2O line at 557 GHz and find H2O abundances of in outflows and up to in quiescent gas close to luminous external heating sources. A detailed analysis of the ISO-LWS H2O data for one object, NGC 1333 IRAS 4A, shows low H2O abundances in the outer envelope, increasing to high values of at least in the inner envelope (Maret et al. 2002). Thus, similar H2O abundance changes are seen in the envelopes of low- and high-mass YSOs (compare AFGL 2591 case).

4.2 IRAS 16293–2422 as an example
The best-studied low-mass YSO in terms of chemistry is IRAS 16293–2422, a 27 L⊙ proto-binary object located in the Ophiuchus molecular cloud at a distance of 160 pc. It has been coined ‘the low-mass equivalent of Orion-KL’, although full spectral surveys are still lacking and much fewer molecules have been detected with the sensitivities of the observations published to date. Blake et al. (1994) and van Dishoeck et al. (1995) performed partial line surveys in the 230 and 345 GHz windows using matched beams with the JCMT and CSO, respectively. Deeper integrations on selected settings have been carried out e.g., by Ceccarelli et al. (2000).

Schöier et al. (2002) have recently re-analyzed the available JCMT and CSO data using the methods outlined in Figure 2. The best-fitting temperature and power-law density profiles are very similar to those of high-mass YSOs as shown in Figure 1, except for a scale factor. For IRAS 16293–2422, the radius at which the dust temperature reaches 90 K is 150 AU, compared with 2500 AU for AFGL 2591. For many species, sufficient lines covering a large range in excitation conditions are available to fit jump models, and -fits have been used to constrain both the inner and the outer envelope abundances. Large enhancements of factors of 100–1000 are found in the inner region above 90 K for species like H2CO, CH3OH, CH3CN, SO, SO2 and OCS (see Figure 7). The temperature at which the jump occurs is not well constrained but is at least 50 K. For other molecules, only the inner (e.g., CH3C2H) or outer (e.g., C3H2) abundance is well determined. No complex organic molecules like CH3OCH3 and HCOOCH3 have been reported but the limits are not yet very stringent compared with high-mass YSOs.
Interferometer observations of IRAS 16293-2422 reveal different distributions for various molecules. Molecules like CS and HCO+ are good tracers of the envelope, whereas N2H+ and HNC clearly avoid the inner warm region. H2CO, on the other hand, traces the inner envelope, especially in the higher excitation lines (see Schöier et al., this volume). Such spatially-resolved data are important to test whether the enhanced abundances in low-mass YSOs are primarily due to thermal evaporation in the hot inner envelope or whether grain-grain collisions in turbulent regions caused by the interaction of the outflow with the inner envelope can also release grain mantles.
Doty et al. (this conference and in prep.) have performed full chemical modeling for this source. Starting from the (static) temperature and density profile derived by Schöier et al. (2002) and using the same chemical model as applied to AFGL 2591, the abundances of many species have been computed as functions of position and time in the envelope. Subsequently, the emerging line fluxes have been obtained by calculating the excitation and radiative transfer through the model envelope and comparing them directly with the observational data after convolution with the appropriate beams. For a best-fitting time of a few yr, the model fluxes generally agree within 50% with the data, much better than the factor of 3–10 agreement generally cited for dark clouds (e.g., Terzieva & Herbst 1998).
5 Models of hot core and envelope chemistry
5.1 Static models
In the static envelope or ‘cocoon’ models described in §3.2 and 4.2, the temperature and density structures are taken to be constant in time and the molecules do not move from one position to another within the envelope, e.g., due to infall. These 1D models can contain a ‘hot core’ in the center, where evaporation of ices followed by high-temperature chemistry occurs. Static hot core models have been extensively described by Charnley et al. (1992, 1995), Charnley (1997), Caselli et al. (1993) and Rodgers & Charnley (2001) (see Millar 1997 for review). The choice of molecules to be evaporated and their abundances are inspired by the observed chemical composition of ices toward high-mass YSOs, which consists largely of H2O, CO2, CH3OH and H2CO (e.g., Gibb et al. 2000). NH3 and H2S are often assumed to represent the major nitrogen and sulfur reservoirs in the ices, although this has not yet been confirmed by observations (see Taban et al. 2003 for the case of NH3). The hot core models are particularly sensitive to the initial CH3OH/NH3 ratio.
In most hot core models, all ices are assumed to evaporate instantaneously at =0, but in some cases a more gradual evaporation is used (e.g., Viti & Williams 1999). The evaporated ices subsequently drive a rapid high temperature chemistry in the warm gas, leading to more complex organic molecules such as CH3OCH3 and HCOOCH3 on a time scale of yr. Nitrogen-bearing molecules require longer timescales up to yr and favor higher temperatures. Similarly, the H2S/SO2 ratio can serve as a chemical clock, if it is assumed that most of the gas-phase sulfur is initially in H2S. Indeed, one of the main limitations in the use of these molecules to constrain the source age is that it is not known whether they are ‘first generation’ molecules present in the ices or whether they represent ‘second generation’ species produced in the hot gas.
The combination of a hot core with a more extended envelope was first performed in a 3-layer model for G34.3 by Millar et al. (1997) and subsequently within a single power-law model for AFGL 2591 by Doty et al. (2002). In the latter case, the density and dust temperature profiles are taken directly from observations. The gas temperature is calculated explicitly taking all heating and cooling mechanisms of the gas into account. The chemistry is then solved as a function of time at each position using an extensive chemical network containing both low- and high-temperature reactions and separating the envelope into a warm inner part where the ices are evaporated and a cold outer part where molecules are still heavily depleted.
5.2 Dynamical models
In the dynamical models, the temperature (,) and density (,) of the source change according to some physical prescription and the gas moves inward or outward according to a velocity profile (,). The best studied case is that of the popular Shu (1977) collapse model appropriate for low-mass YSOs. Rawlings et al. (1992) were the first to follow the chemistry (,) in a parcel of gas as it is falling into the center in an effort to explain the difference in chemistry and line profiles for species such as NH3 and CS. Ceccarelli et al. (1996) subsequently computed the full thermal balance of the dust and gas as a function of time, coupled with a simple chemistry aimed at predicting the [O I] and H2O emission from low-mass YSOs. More recently, Rodgers & Charnley (in prep.) coupled a full chemical network with a Shu-type dynamical model and compared the results with those of a static model. Interestingly, they concluded that small-scale differentiation and high abundances of complex species can only occur if the gas is not falling rapidly into the protostar, i.e., observations of such species require a more or less static model. In a dynamical model, the chemical timescales become longer than the dynamical timescales so that the abundances are frozen at their initial values.
6 High versus low-mass YSOs
It is clear from the preceding sections that there are several similarities but also some potential differences between the chemistry in low- and high-mass YSOs. Since statistically significant data sets analyzed in a homogeneous way are still lacking, some of the apparent differences may well become similarities and vice versa in future studies.
6.1 Similarities?
Physical structure: The density structure of the envelopes of both low- and high-mass YSO’s can be well described by a smooth power law whose index can be constrained observationally from dust continuum and/or line observations. Some analyses suggest a slightly shallower index for high-mass YSOs compared with low-mass YSOs (e.g., van der Tak et al. 2000a), whereas other studies find similar indices within the observational errors (e.g., Mueller et al. 2002, Beuther et al. 2002), but this potential difference does not have significant chemical consequences to first order. In both sets of sources, the dust temperature follows an optically thin law in the outer envelope, increasing more steeply in the inner part to temperatures above 100 K. The only difference is a scale factor, resulting in a larger physical size of the warm region for high-mass YSOs. The good fits to the data imply that outflows and shocks give only a limited contribution to the heating in both types of objects. Because of the higher temperatures throughout, the abundances in the outer envelopes of high-mass objects may be somewhat higher than those in low-mass class 0 YSOs (see Fig. 8).

Abundance jumps: For both low- and high-mass YSOs, jumps in the abundances of selected molecules are found (e.g., CH3OH, H2O). The jumps are of comparable magnitude (about a factor of 100) and their location is consistent with the temperature of 90 K at which most ices are thought to evaporate. Figure 9 compares the abundances of a few characteristic species in the Orion-KL hot core with those found in the inner warm region of IRAS 16293–2422 (see Table 7 of Schöier et al. 2002 for details). The number of objects for which such detailed abundance analyses have been done is still small however, and statistics on larger samples are needed.
6.2 Differences
Hot core chemistry: Both low- and high-mass YSOs are known to have an inner warm and dense region where ices have evaporated. But do they have a similar hot core chemistry? Complex organic molecules such as CH3OCH3 and HCOOCH3, which are thought to be secondary species produced by high-temperature reactions, are found toward high-mass YSOs only. These species have not yet been detected toward low-mass YSOs in published spectra, although the abundance limits are comparable to those in high-mass YSOs if the complex molecules are located only in the inner warm region. Deeper searches are needed for low-mass YSOs. Potential differences in hot-core chemistry could be due to several factors. First, the dynamical infall timescales in the warm gas in low-mass YSOs are much shorter ( yr) compared with high-mass YSOs, so that the complex chemistry may not have enough time to develop unless the collapse is slowed down. Second, the chemical composition of the ices may be different due to different H/H2 ratios in the collapsing envelope and/or different grain temperatures in high- versus low-mass star-forming regions. Third, the size of the hot core and the temperature region above 230 K may be so small in low-mass YSOs (100 AU, i.e., comparable to the size of the disk) that it is negligible in practice. On the other hand, expansion of the ultracompact H II region may create a large compressed shell of warm molecular gas for high-mass YSOs.
Deuterium fractionation: The observed ratios of deuterated molecules with respect to their normal counterparts are at least an order of magnitude higher on average for low-mass YSOs (e.g., Roberts et al. 2002). This can be due to two factors. First, the temperature of the pre-stellar cores may be lower for low-mass YSOs, enhancing the deuterium fractionation especially if CO is frozen out. In some high-mass star-forming regions, the temperatures may never have been cold enough for significant CO depletion. Second, the time-scales of the pre-stellar phase may have been longer for low-mass YSOs, leading to more complete CO freeze-out across the core and further favoring the production of H2D+.
Effects of UV or X-rays: For both low- and high-mass YSOs no clear diagnostics of UV radiation or X-rays have yet been found in the deeply embedded phase. The UV radiation can be either externally or internally produced. In the former case, the dust and gas temperatures in the outer envelope are raised and molecules are photodissociated. For example, HCN is photodissociated to CN, a well-known photodissociation product in PDRs (e.g., Fuente et al. 1998). The internal UV radiation or X-rays can originate either from the young star itself or from a hot accretion boundary layer between the inner disk and the star. Characteristic products are CO+, CN and OH. Moreover, the radiation can affect the composition of the ices, e.g., by producing a feature of OCN- at 4.62 m (but see van Broekhuijzen et al., this volume). UV radiation also excites PAH features. Deep searches for photodissociation and X-ray products and PAH features in both low- and high-mass YSOs are needed. It is clear that UV radiation plays an important role in the chemistry of high-mass YSOs in later stages during the evolution from the ultracompact to the classical H II region stage, where PAHs and photodissociation products are widely observed.
Effect of shocks: Outflows are known to be associated with both low- and high-mass YSOs and their effects on the chemistry are well documented at off-source positions in the outflow lobes, where enhancements of species like SiO, CH3OH and H2O have been seen (see also Figure 9). However, their importance in the inner dense envelope relative to thermal evaporation remains to be determined. The observed line widths toward both low- and high-mass YSOs are typically a few km s-1 and only the strongest lines of a few species show clear evidence for line wings (see also Buckle & Fuller 2002). It has been argued that shocks may be relatively more important in low-mass YSOs, not only for the dispersion of the envelope but also for releasing grain mantles in the turbulent shear zones between the outflow and the quiescent envelope. This can be tested by mapping the distribution of grain-surface products such as H2CO. High-angular resolution observations of a few low-mass sources provide evidence for both scenarios (e.g., Schöier et al., in prep.). Schreyer et al. (2002) show that the presence of low-mass outflows within a high-mass envelope does not have noticeable effects on the chemistry, indicating that only a small fraction of the gas is affected. On the other hand, the absence of abundant gas-phase CO2 in the inner envelope has been cited as evidence for shock chemistry throughout high-mass YSO envelopes (Charnley & Kaufman 2000). Hatchell et al. (2001) argued based on SiO data that shocks do not affect the hot core of the massive YSO G34.3, although they are present in the more extended envelope. Further observations of shock diagnostics, such as the NS/CS ratio proposed by Viti et al. (2001), are needed (see also Hatchell & Viti 2002).
Geometry: The effects of geometry and foreground clouds are thought to be more important for the analysis of low-mass YSO data than for high-mass sources, where the envelope often overwhelms all other emission or absorption. For example, a significant fraction of the ices along the line of sight toward low-mass YSOs in Ophiuchus may originate in unrelated foreground material (e.g., Boogert et al. 2002). Low-excitation millimeter lines often have their origin primarily in the surrounding clouds, where they may or may not be distinguished by their velocity structure. Finally, disks are known to exist in the embedded class I phase for low-mass YSOs, whereas their presence for high-mass YSOs remains to be firmly established. Depending on the viewing angle, disks can change the observed mid-infrared characteristics of the source. They also provide a natural cut-off for (part of) the inner warm envelope and may shield some of the envelope from heating. Their chemical structure is expected to be significantly different from that of the inner envelope due to the high densities and low mid-plane temperatures.
7 Conclusions
The combination of submillimeter and infrared observations allows a nearly complete inventory of gas- and solid-state species of high- and low-mass YSOs. Combined with detailed modeling using a new generation of flexible radiative transfer codes, quantitative analyses of both their physical and chemical structure are now possible. Clear variations in the gas-phase abundances and the gas/solid ratios are found with increasing temperature in the envelope, indicating that the chemistry is controlled by freeze-out and ice evaporation. Systematic studies of statistically significant samples of low- and high-mass YSOs are only just appearing, and some similarities and differences are emerging. Due to the limited samples and poor sensitivity and angular resolution of the existing data, much more work is needed to draw firm conclusions.
Progress in this field will be greatly aided by new observational facilities. SIRTF and eventually JWST will allow mid-infrared imaging and spectroscopy of a much larger sample of embedded low-mass YSOs. Herschel will provide unique data on H2O, OH and other hydrides in both low- and high-mass YSOs, which, among many other applications, will help to disentangle the importance of shocks and thermal evaporation. Finally, ALMA will give maps of many species at unprecented angular resolution and sensitivity, essential to constrain the small-scale structure of the envelope and outflows and probe the circumstellar disks. Together, they will allow the full chemical history of material from molecular clouds to planetary systems to be traced.
Acknowledgements.
The author is grateful to Geoff Blake, Adwin Boogert, Annemieke Boonman, Rogier Braakman, Steven Doty, Helen Fraser, Michiel Hogerheijde, Doug Johnstone, Jes Jørgensen, Fred Lahuis, Klaus Pontoppidan, Fredrik Schöier, Willem Schutte, Fleur van Broekhuizen and Floris van der Tak for many enjoyable discussions and for providing input and figures for this review. The reader is strongly encouraged to read their original papers on these topics, some of which are summarized in this volume. Astrochemistry in Leiden is supported by grants no. 614.41.003 and 614.041.004 as well as a Spinoza grant from NWO and by the Netherlands Research School of Astronomy (NOVA).References
- [] Bachiller, R. & Pérez-Gutiérrez, M. 1997, ApJ 487, L93
- [] Bergin, E.A., Kaufman, M.J., Melnick, G.J., Snell, R.L., & Howe, J.E. 2002, ApJ in press
- [] Beuther, H., Schilke, P., Menten, K.M., Motte, F., Sridharan, T.K., & Wyrowski, F. 2002, ApJ 566, 945
- [] Blake, G.A., van Dishoeck, E.F., Jansen, D.J., Groesbeck, T.D., & Mundy, L.G. 1994, ApJ 428, 680
- [] Blake, G.A., Sutton, E.C., Masson, C.R., & Phillips, T.G. 1987, ApJ 315, 621
- [] Boogert, A.C.A., Hogerheijde, M.R., Ceccarelli, C., Tielens, A.G.G.M., van Dishoeck, E.F., Blake, G.A., Latter, W.B., & Motte, F. 2002, ApJ 570, 708
- [] Boogert, A.C.A., Ehrenfreund, P., Gerakines, P.A., et al. 2000, A&A 353, 349
- [] Boonman, A.M.S., Stark, R., van der Tak, F.F.S., et al. 2001, ApJ 553, L63
- [] Boonman, A.M.S., van Dishoeck, E.F., Lahuis, F., Doty, S.D., Wright, C.M., & Rosenthal, D. 2003a, A&A, in press
- [] Boonman, A.M.S., van Dishoeck, E.F., Lahuis, F., & Doty, S.D. 2003b, A&A, in press
- [] Boonman, A.M.S., & van Dishoeck, E. F. 2003c, A&A, submitted
- [] Boonman, A.M.S., Doty, S.D., van Dishoeck, E.F., Bergin, E.A., Melnick, G.J., Wright, C.M., & Stark, R. 2003d, A&A, submitted
- [] Buckle, J.V. & Fuller, G.A. 2002, A&A 381, 77
- [] Caselli, P., Hasegawa, T.I., & Herbst, E. 1993, ApJ 408, 548
- [] Ceccarelli, C. , Hollenbach, D. J. & Tielens, A. G. G. M. 1996, ApJ 471, 400
- [] Ceccarelli, C., Loinard, L., Castets, A., Tielens, A.G.G.M., & Caux, E. 2000, A&A 357, L9
- [] Charnley, S.B. 1997, ApJ 481, 396
- [] Charnley, S.B. & Kaufman, M.J. 2000, ApJ 529, L111
- [] Charnley, S.B., Tielens, A.G.G.M., & Millar, T.J. 1992, ApJ 399, L71
- [] Charnley, S.B., Kress, M.E., Tielens, A.G.G.M., & Millar, T.J. 1995, ApJ 448, 232
- [] Doty, S.D. & Neufeld, D.A. 1997, ApJ 489, 122
- [] Doty, S.D., van Dishoeck, E.F., van der Tak, F.F.S., & Boonman, A.M.S. 2002, A&A 389, 446
- [] Evans, N.J., Lacy, J.H., & Carr, J.S. 1991, ApJ 383, 674
- [] Fraser, H.J., Collings, M.P., McCoustra, M.R.S., & Williams, D.A. 2001, MNRAS 327, 1165
- [] Fuente, A., Martín-Pintado, J., Bachiller, R., Neri, R. & Palla, F. 1998, A&A 334, 253
- [] Garay, G. 2000, in Astrochemistry: From Molecular Clouds to Planetary Systems, IAU Symposium 197, eds. Y.C. Minh & E.F. van Dishoeck, ASP, p. 203
- [] Gerakines, P.A., Whittet, D.C.B., Ehrenfreund, P., et al. 1999, ApJ 522, 357
- [] Gibb, E.L., Whittet, D.C.B., Schutte, W.A., et al. 2000, ApJ 536, 347
- [] Hartquist, T. W., Caselli, P., Rawlings, J. M. C., Ruffle, D. P. & Williams, D. A. 1998, in The Molecular Astrophysics of Stars and Galaxies, eds. T.W. Hartquist and D.A. Williams, Oxford University, 101
- [] Hatchell, J. & Viti, S. 2002, A&A 381, L33
- [] Hatchell, J., Fuller, G.A. & Millar, T.J. 2001, A&A 372, 281
- [] Hatchell, J., Thompson, M.A., Millar, T.J. & Macdonald, G.H. 1998a, A&AS 133, 29
- [] Hatchell, J., Thompson, M.A., Millar, T.J. & Macdonald, G.H. 1998b, A&A 338, 713
- [] Helmich, F.P. & van Dishoeck, E.F. 1997, A&AS 124, 205
- [] Helmich, F.P., van Dishoeck, E.F., Black, J.H., et al. 1996, A&A 315, L173
- [] Hogerheijde, M. R., van Dishoeck, E. F., Salverda, J. M., & Blake, G. A. 1999, ApJ 513, 350
- [] Ikeda, M., Ohishi, M., Nummelin, A., Dickens, J.E., Bergman, P., Hjalmarson, Å, & Irvine, W.M. 2001, ApJ 560, 792
- [] Johnstone, D., Boonman, A.M.S., & van Dishoeck, E.F. 2003, ApJ, submitted
- [] Jørgensen, J.K., Schöier, F.L., & van Dishoeck, E.F. 2002, A&A 389, 908
- [] Juvela, M. 1997, A&A 322, 943
- [] Kaufman, M.J., Hollenbach, D.J., & Tielens, A.G.G.M. 1998, ApJ 497, 276
- [] Keane, J.V., Boonman, A.M.S., , Tielens, A.G.G.M., & van Dishoeck, E.F. 2001, A&A 376, L5
- [] Lahuis, F. & van Dishoeck, E.F., 2000, A&A 355, 699
- [] Langer, W.D., van Dishoeck, E.F., Blake, G.A. et al. 2000, in Protostars & Planets IV, eds. V. Mannings, A.P. Boss and S.S. Russell, University of Arizona, p. 29
- [] Loinard, L., Castets, A., Ceccarelli, C., Caux, E., Tielens, A.G.G.M. 2001, ApJ 552, L163
- [] Lorenzetti, D., Giannini, T., Nisini, B., Benedettini, M., Elia, D., Campeggio, L., & Strafella, F. 2002, A&A, 395, 637
- [] Maret, S., Ceccarelli, C., Caux, E., Tielens, A.G.G.M., & Castets, A. 2002, A&A 395, 573
- [] Millar, T.J. 1997, in Molecules in Astrophysics: Probes and Processes, IAU Symposium 178, ed. E.F. van Dishoeck, Kluwer, p. 75
- [] Millar, T.J., Macdonald, G.H., & Gibb, A.G. 1997, A&A 325, 1163
- [] Mueller, K.E., Shirley, Y.L., Evans, N.J., Jakobson, H.R. 2002, ApJS 143, 469
- [] Nisini, B., Giannini, T., Lorenzetti, D. 2002, ApJ 574, 246
- [] Nummelin, A., Bergman, P., Hjalmarson, Å., Friberg, P., Irvine, W. M., Millar, T. J., Ohishi, M. & Saito, S. 1998, ApJS 117, 427
- [] Nummelin, A., Bergman, P., Hjalmarson, Å., Friberg, P., Irvine, W.M., Millar, T.J., Ohishi, M., & Saito, S. 2000, ApJS 128, 213; 132, 127
- [] Rawlings, J.M.C., Hartquist, T.W., Menten, K.M., & Williams, D.A. 1992, MNRAS 255, 471
- [] Roberts, H., Fuller, G.A., Millar, T.J., Hatchell, J., & Buckle, J.V. 2002, A&A 381, 1026
- [] Rodgers, S.D., & Charnley, S.B. 2001, ApJ 546, 324
- [] Sandford, S., & Allamandola, L.J. 1993, ApJ 417, 815
- [] Schilke, P., Benford, D.J., Hunter, T.R., Lis, D.C., & Phillips, T.G. 2001, ApJS 132, 281
- [] Schöier, F.L., Jørgensen, J.K., van Dishoeck, E.F., & Blake, G.A. 2002, A&A 390, 1001
- [] Schreyer, K., Henning, Th., van der Tak, F.F.S., Boonman, A.M.S., van Dishoeck, E.F. 2002, A&A 394, 561
- [] Shah, R.Y., & Wootten, A. 2001, ApJ 554, 933
- [] Shirley, Y.L., Evans, N.J., Rawlings, J.M.C. 2002, ApJ 575, 337
- [] Shu, F. 1977, ApJ 214, 488
- [] Snell, R.L., Howe, J.E., Ashby, M.L.N., et al. 2000, ApJ 539, L101
- [] Spinoglio, L., Giannini, T., Nisini, B., et al. 2000, A&A 353, 1055
- [] Sutton, E.C., Peng, R., Danchi, W.C., et al. 1995, ApJS 97, 455
- [] Taban, I.M., Schutte, W.A., Pontoppidan, K.M., & van Dishoeck, E.F. 2003, A&A, in press
- [] Terzieva, R., & Herbst, E. 1998, ApJ 501, 207
- [] van den Ancker, M., Tielens, A.G.G.M., & Wesselius, P.R. 2000a, A&A 358, 1035
- [] van den Ancker, M., Wesselius, P.R., & Tielens, A.G.G.M. 2000b, A&A 355, 194
- [] van der Tak, F.F.S., Boonman, A.M.S., Braakman, R., & van Dishoeck, E.F. 2003, A&A submitted
- [] van der Tak, F.F.S., van Dishoeck, E.F., Evans, N.J., Bakker, E.J., & Blake, G.A. 1999, ApJ 522, 991
- [] van der Tak, F.F.S., van Dishoeck, E.F., Evans, N.J., & Blake, G.A. 2000a, ApJ, 537, 283
- [] van der Tak, F.F.S., van Dishoeck, E.F., & Caselli, P. 2000b, A&A 361, 327
- [] van der Tak, F.F.S., Schilke, P., Müller, H.S.P., Lis, D.C., Phillips, T.G., Gerin, M., Roueff, E. 2002, A&A 388, L53
- [] van Dishoeck, E.F. & Blake, G.A. 1998, ARAA 36, 317
- [] van Dishoeck, E. F., Blake, G. A., Jansen, D. J. & Groesbeck, T. D. 1995, ApJ 447, 760
- [] van Dishoeck, E.F. & Hogerheijde, M.R. 1999, in Origin of Stars and Planetary Systems, eds. C.J. Lada and N. Kylafis, Kluwer, p. 97
- [] van Dishoeck, E.F. & van der Tak, F.F.S. 2000, in Astrochemistry: From Molecular Clouds to Planetary Systems, IAU Symposium 197, eds. Y.C. Minh & E.F. van Dishoeck, ASP, p. 97
- [] van Zadelhoff, G.–J., Dullemond, C.P., van der Tak, F.F.S., et al. 2002, A&A 395, 373
- [] Viti, S., & Williams, D.A. 1999, MNRAS 305, 755
- [] Viti, S., Caselli, P., Hartquist, T.W., & Williams, D.A. 2001, A&A 370, 1017
- [] Walmsley, C.M. 1992, in Chemistry and Spectroscopy of Interstellar Molecules, ed. D.K Bohme et al., Tokyo Univ., p. 267
- [] Watson, C., Churchwell, E., Pankonin, V., & Bieging, J.H. 2002, ApJ 577, 260
- [] Wolf, S., Henning, Th., & Stecklum, B. 1999, A&A 349, 839
- [] Wyrowski, F., Schilke, P., Walmsley, C.M., Menten, K.M. 1999, ApJ 514, L43
- [] Zhou, S., Butner, H.M., Evans, N.J., Guesten, R., Kutner, M.L., & Mundy, L.G. 1994, ApJ 428, 219