Observations of a Non-Thermal Supernova Remnant Candidate AX J1843.80352 and its Surroundings
Abstract
We present the Chandra results of AX J1843.80352, a supernova remnant (SNR) recently identified with ASCA. Chandra spatially resolved two components from this SNR: non-thermal and thermal ones. The morphology of the non-thermal component is clumpy and elliptical, elongated from the north to the south with a mean diameter of about 9. The spectrum is fitted with a power-law model of photon index 2.1 and the east rim is associated with the non-thermal radio sources C and F (Helfand et al., 1989). Therefore the non-thermal component is probably synchrotron X-rays by energetic electrons accelerated at the shell of the SNR. The thermal component is the brightest clump located within the non-thermal component and shows a spectrum of a thin plasma of about 0.7 keV temperature. Notable discovery is its peculiar morphology; a head of size near the south-east rim of the SNR and a -long “jet” pointing to the southwest. Although this emission is associated with the west part of the radio source F, the absorption is twice larger than that of the non-thermal X-rays, or the bulk of the SNR emission. Therefore, it is unclear whether this peculiar plasma is a thermal component associated with AX J1843.80352, a Galactic source located in the far side of our Galaxy, or an extragalactic source.
1 Introduction
Supernovae and their remnants (SNRs) play essential roles for the structure and evolution on the Galaxy; they are the major sources of galactic hot ( K) medium, their blast waves compress the interstellar medium and trigger successive star formations, and they produce and distribute heavy elements in the whole Galaxy and even in the intergalactic space.
SNRs would also be the most plausible birthplace of high-energy cosmic rays near to the knee energy ( eV); the supporting evidence is the detection of synchrotron X-rays from the shell of some of the SNRs (e.g., Koyama et al. 1995, 1997; Slane et al. 2001), and the detection of TeV -rays from some of them (e.g., Tanimori et al. 1998; Muraishi et al. 2000; Enomoto et al. 2002). Electrons should be accelerated to high energies up to about 1 TeV or even more, possibly by the first-order Fermi acceleration mechanism. Since the energy gain (acceleration) rates of electrons are proportional to (the strength of the magnetic field) and the energy loss (due to synchrotron radiation) rates are proportional to , high energy electrons responsible for the synchrotron X-rays are likely to exist in a shell of rather weak magnetic field, where the radio flux should be faint (the flux is proportional to ).
SNRs may also be concerned as the major origin of the Galactic ridge X-rays (the GRXs). The GRXs are diffuse X-rays extending along the Galactic inner disk (Koyama et al., 1986; Kaneda et al., 1997). The spectrum shows thin thermal plasma of about 107-8 K, with prominent K-shell lines from highly ionized irons. There is mounting evidence that the GRXs are attributable to truly diffuse sources, not an integrated emission of many point sources (Yamauchi et al., 1996; Ebisawa et al., 2001). However, real origin of the diffuse GRXs has been a big puzzle; no known diffuse source can account for the observed spectrum and flux of the GRXs. Therefore the GRXs may predict presence of many diffuse X-ray sources, whether these are new X-ray SNRs or a new class of X-ray sources.
Surveys with ROSAT and ASCA already found several new X-ray SNRs, which were later identified with radio faint SNRs. Much more sensitive Chandra obseravtion is expected to detect numerous such X-ray emitting SNRs, and resolve their spatial and spectral features. We have carried out a deep Chandra observations on the Galactic plane region around AX J1843.80352, a new SNR candidate identified with ASCA (Bamba et al., 2001). This paper reports on the nature of the diffuse structures and discusses possible implications on the origin of high-energy cosmic rays and the GRXs.
2 Observations and Data Reduction
The Chandra deep observations on the Galactic ridge were performed on 2000 February 24–26 (here Observation 1 or Obs. 1) and on 2001 May 20–21 (here Observation 2 or Obs. 2). The targeted positions are R.A. = , decl. = (epoch 2000) and R.A. = , decl. = (epoch 2000) for Obs. 1 and 2, respectively. The observation regions were fields of the ACIS-I arrays.
The satellite and instrument are described by Weisskopf, O’dell, & van Speybroeck (1996) and Garmire (1997), respectively. AX J1843.80352 lies near the northwest edge and the east part of the ACIS-I array, for Obs. 1 and 2. Data acquisition from ACIS-I was made in Timed-Exposure Faint mode with the chip readout times of 3.24 s. Data reduction and analysis were made using the Chandra Interactive Analysis of Observations (CIAO) software version 2.2. Using Level 2 processed events provided by the pipeline processing at the Chandra X-ray Center, we selected the ASCA grades111see http://asc.harvard.edu/udocs/docs/POG/MPOG/index.html 0, 2, 3, 4 and 6, as X-ray events. The other events due to charged particles and/or hot and flickering pixels were removed. We also removed high background data in the Obs. 1 where total count rates were larger than counts s-1. The effective exposures were then about 94 ks and 99 ks for Obs. 1 and 2, respectively.
3 Analysis and Results
3.1 Over-all Morphology
In the raw images obtained by these observations, we see numerous point sources. We at first picked up point sources from the raw images in the energy bands of 0.53.0 keV, 3.08.0 keV, and 0.58.0 keV using the program WAVDETECT (Freeman et al., 2002) with the significance criterion at 4.0, which corresponds to about 6 – 33 counts s-1, depending on the size of the point-spread function (PSF), the energy band, and the background level. Then 274 sources are found in the two observations, of which 225, 116, and 271 are detected in the energy bands of 0.53.0 keV, 3.08.0 keV, and 0.58.0 keV, respectively. Surface density of the point sources detected in the 3.08.0 keV band is not significantly higher than that expected from the extragalactic sources seen through the Galactic plane. Therefore, most of the hard X-ray sources are considered to be extragalactic (Ebisawa et al., 2001). On the other hand, soft X-ray point sources show significant excess over the extragalactic population. They have low temperature ( keV) thermal spectra and some of them exhibit flare-like temporal variations (Ebisawa et al., 2002). Therefore, most of these soft X-ray sources are presumably nearby active stars.
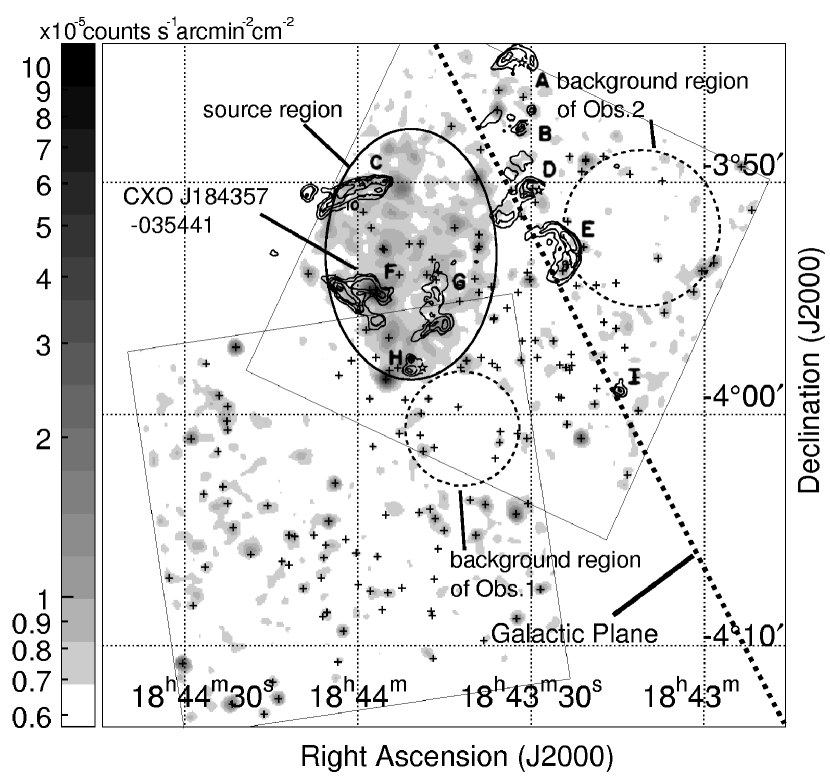
The combined image (Obs. 1 + 2), after the exposure correction and smoothing with a Gaussian kernel of = 6 is shown in Figure 1, where the point sources of detection in the 0.58.0 keV band are given by crosses. In Figure 1, we can see an extended complex at the north (shown by the solid-line ellipse). Since the point sources are scattered uniformly over the field of view, the extended X-ray structure is unlikely to be a local enhancement of many point sources, but will be a really diffuse source. The center position of the diffuse source is at around R.A. = 18h43m50s, decl. = (epoch 2000) and the emission is extended in the elliptical shape of . The center position and morphology correspond to the ASCA source AX J1843.80352 (Bamba et al., 2001), hence we use the ASCA name, hereafter.
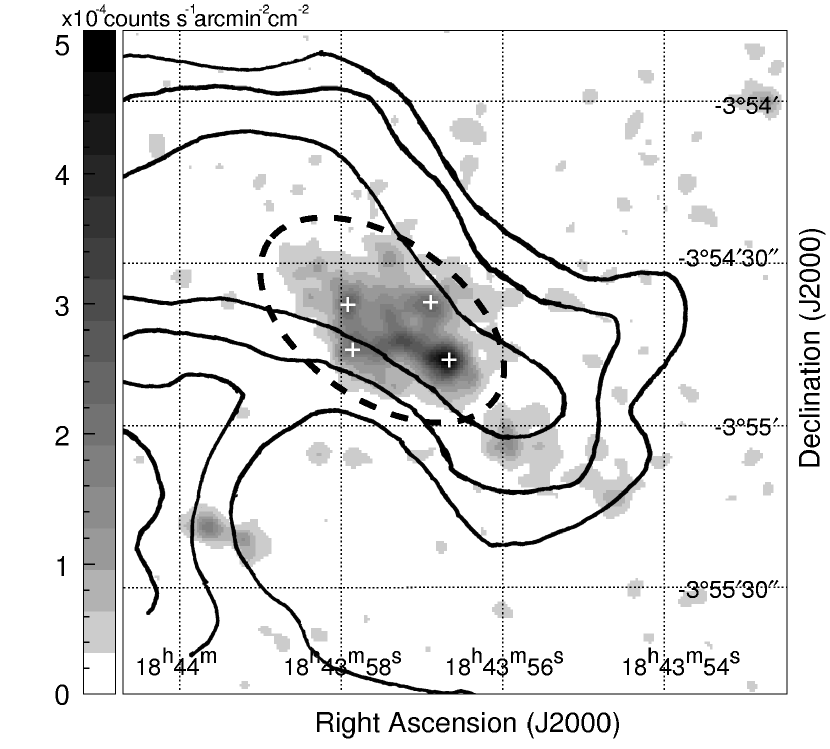
We found that AX J1843.80352 consists of numerous clumps. We name the brightest spherical clump in the south-eastern part of AX J1843.80352 as CXO J184357035441 from its central position. A closed-up view of this clump in the 1.0–6.0 keV band is given in Figure 2, together with the 20 cm (1.5 GHz) contour of a radio source F (Helfand et al., 1989). A notable feature is its peculiar shape: an elliptical head with a jet-like tail of -long to the southeast.
3.2 AX J1843.80352
The X-ray spectra of AX J1843.80352 were separately made for Obs. 1 and 2, from the elliptical region of given by the solid line in Figure 1. An elliptical region surrounding CXO J184357035441 (dotted line in Figure 2) was excluded to extract the energy spectrum. Although Obs. 2 covers full region, Obs. 1 covers only about 1/3 at the southern part. The point source events, which are in the PSF (90% encircled radii) circles around the point sources detected with the WAVDETECT software (see subsection 3.1), were removed from the source events. The background regions were selected at the same Galactic latitude as the source region, so that the GRXs are properly eliminated (e.g., Kaneda et al. 1997). The background regions for Obs. 1 and 2 are shown with dotted circles in Figure 1. The point source contribution was excluded from the background spectra, in the similar way as the source regions.
The background-subtracted spectra for Obs. 1 and 2 have no emission line as shown in Figure 3. We fitted the spectra with a power-law model. The fits are acceptable with degree of freedom (d.o.f.) and for Obs. 1 and Obs. 2, respectively, and the best-fit parameters are given in Table 1. Although the spectrum of Obs. 1 represents only the southern part of AX J1843.80352, the spectral parameters except the flux are consistent with those of Obs. 2, the full spectrum of AX J1843.80352. We therefore carried out a simultaneous fit to the Obs. 1 and 2 spectra with a power-law model leaving each normalization of the two observations independent. The fit is acceptable with the best-fit parameters given in Table 1.
To examine the possibility for a thermal plasma origin, we also proceeded a simultaneous fit with a model of a thin thermal plasma in non-equilibrium ionization, an NEI model (Borkowski et al. 2001; a revised version from an original code by Hamilton & Sarazin (1984)). This NEI model is acceptable with the best-fit parameters in Table 1. The metal abundances, however, is lower ( solar) and the temperature is higher ( 5.4 keV) than any of the diffuse thermal sources (e.g., SNRs and star forming regions) in the Galaxy.
The spatial correlation between the diffuse X-ray and radio is demonstrated by the 20 cm VLA contours in Figure 1, with the designation of the radio source (A–I) given by Helfand et al. (1989). The X-ray emission consists of many clumps filling an ellipse which is partly outlined by the radio sources C and F, the SNR candidates proposed by Helfand et al. (1989). The south tail of the radio source G is also correlated with the X-ray enhancement. Though the source H is said to be extragalactic because of its infrared emission (Helfand et al., 1989), it is also inside AX J1843.80352 and may be associated. Note, however, no significant X-ray emission is associated with the source E, which is a partial radio shell and an SNR candidate suggested by Helfand et al. (1989).
3.3 CXO J184357035441
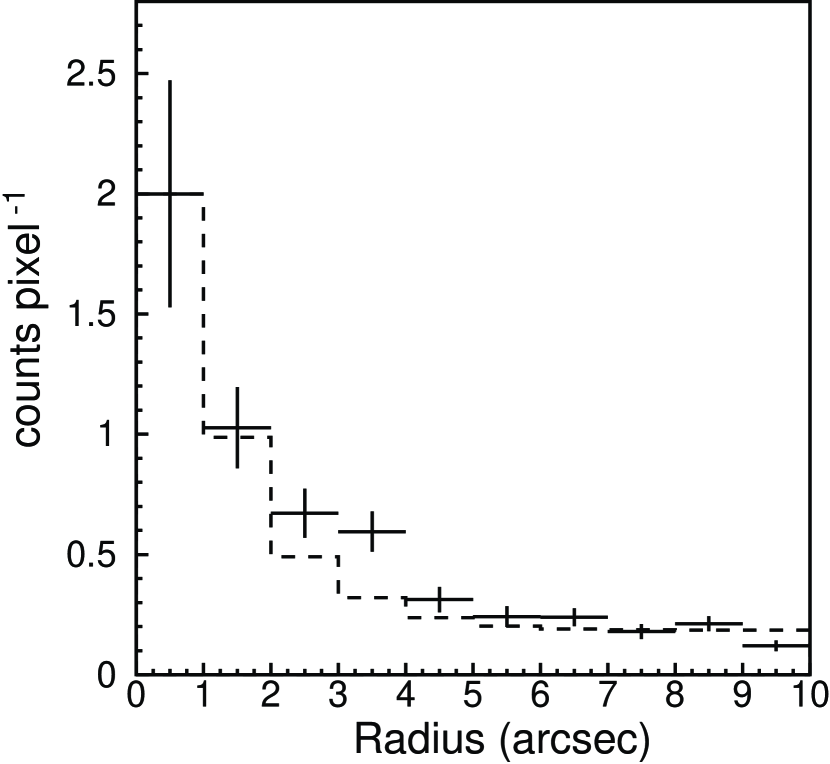
Since the WAVDETECT software detected four point sources in CXO J184357035441 (the crosses in Figure 2), we examined in detail whether these sources are really point sources or not, and found no clear evidence for point sources. The brightest source located at south-west, for example, has a wider radial profile than PSF as is demonstrated in Figure 4. The light curves of all these “point sources” show no time variability on the time scale of 103 to 105 s. Although statistics are limited, the X-ray spectra are found to be consistent with that of the whole of CXO J184357035441. Furthermore the total flux of these “point sources” is only 1/4 of that from CXO J184357035441. Accordingly, we regard the “point sources” are due to local enhancement of the bright diffuse source CXO J184357035441.
The X-ray spectrum of CXO J184357035441 was made from the full elliptical region of shown in Figure 2. We used the same background spectrum as that for AX J1843.80352 in Obs. 2. As is given in Figure 5, the background-subtracted spectrum is much softer than that of AX J1843.80352, and shows clear emission lines at 1.85 and 2.41 keV, which are equal to or slightly lower than those from He-like Si and S. We fitted the spectrum with an NEI model. This model is acceptable (/d.o.f = 22.2/39) with the best-fit parameters given in Table 2 and the best-fit model in Figure 5.
4 Discussion
4.1 AX J1843.80352
We found that the newly identified SNR AX J1843.80352 has many X-ray clumps, which are globally filling an elliptical region. The X-ray spectrum is well-fitted with either a power-law or a thin thermal plasma model, similar to the ASCA spectrum (Bamba et al., 2001). Chandra gives more severe constraint on the thin thermal parameters than ASCA, due mainly to the removal of the contamination from the thermal source CXO J184357035441. The thermal scenario of AX J1843.80352 requires uncomfortably high temperature ( keV) and low metal abundance ( solar) (Table 1). This strengthens the conclusion made with ASCA (Bamba et al., 2001) that the X-rays of AX J1843.80352 is non-thermal origin with a power-law spectrum.
The absorption () of cm-2 is slightly larger than, but roughly similar to the ASCA result. We therefore adopt the source distance to be 7 kpc following the discussion of Bamba et al. (2001). The X-ray luminosity (2.0–10.0 keV) and the source size are then estimated to be erg s-1 and 18 pc (mean diameter), respectively.
Since the spectrum is a power-law with the photon index of 2.1 (the energy index of 1.1), the X-rays would be due to synchrotron emission from high energy electrons in a power-law distribution. The corresponding spectral index of the electrons is 3.2, which is larger than the value of 2 which is expected by the first-order Fermi acceleration. This steepening in the X-ray band is also seen in all of the well established SNRs as a site of high energy electrons (SN 1006, G347.30.5, and RX J0852.04622, e.g., Koyama et al. 1995, 1997; Slane et al. 2001), and their photon indices are very similar (between ).
For a wide-band study of the synchrotron emission, we fitted the X-ray spectrum with an SRCUT model (Reynolds, 1998), assuming the energy index () in the radio band (1 GHz) to be 0.5 or 0.6. The derived cut-off energy and the flux density at 1.5 GHz are shown in Table 3. Here, the absorption is consistent with the fit with the power-law model. Both of the predicted radio fluxes at 20 cm by the SRCUT model (for and ) are smaller than the summed flux of the radio clumps C, F, G and H ( Jy; Helfand et al. 1989). This apparent inconsistency may be due to our simple assumption that magnetic field strength () and density of high energy electrons () are uniform in the ellipse. More realistic assumption is that the radio clumps have higher than the average, hence produces high contrast of the radio flux. On the other hand, X-ray flux contrast is small, because of higher energy electrons (which emits X-rays) are smaller than the average, due to the high synchrotron energy loss at high . This scenario is consistent with the observed X-ray and radio morphology. In this case, the SRCUT model predicts that in those regions the cut-off energy is lower and the X-ray spectrum is steeper than the other part. The limited photon flux, however, does not allow us to verify this scenario. We note that G347.30.5, which is one of the well established SNRs as the site of high energy electrons, also shows no good correlation with the radio and X-rays (Slane et al., 1999). The primary candidate for the reason is the variation of the strength of magnetic field () from place to place. To clarify this issue, fine spatial and deep observations in both the radio and X-ray bands are encouraged.
Assuming energy equi-partition (Pacholczyk, 1970), we derived the strength of magnetic field and the total energy of non-thermal electron in Table 3. The total energy of non-thermal electron is about 1/20 times that of SN 1006 (Dyer et al., 2001). The maximum energy of electrons is estimated to be 140 ( =0.5) or 200 TeV ( = 0.6). The synchrotron cooling times of the electrons are yr.
4.2 CXO J184357035441
The X-ray energy spectrum of CXO J184357035441, thin thermal spectrum with 0.7 keV temperature and solar abundance, is typical for young and intermediate-age SNRs. Since the projected position of this source is in the SNR AX J1843.80352 and is associated with the non-thermal radio source F (Helfand et al., 1989), a naive scenario is that CXO J184357035441 is a thermal counterpart of the SNR. It may be possible that we have a large shell whose soft X-ray emission is invisible because heavily absorbed. While a reverse shock is propagating toward the center, the core region makes harder spectrum. Hence, CXO J184357035441 might be one of the clumps made by the reverse shock. Adopting the same distance as AX J1843.80352 (7 kpc), we estimate that the X-ray luminosity (0.7–10.0 keV) is erg s-1 and the physical size is pc of “head” and 1.0 pc-long “jet”. Assuming a uniform density of a prorate sphere with pc diameters, the density of the “head” is cm-3. From the ionization parameter () of cm-3 s, this plasma would be heated-up very recently ( years ago), possibly by the reverse shock.
Since CXO J184357035441 exhibits twice larger absorption than AX J1843.80352, this source is likely located at the distance of 14 kpc. Derived plasma luminosity, size and density are still consistent with being a young SNR behind AX J1843.80352.
Since the absorption of CXO J184357035441 is nearly the same as the total Galactic absorption through the Galactic plane (Ebisawa et al., 2001), a possibility of an extragalactic source can not be excluded. The jet-like morphology is also unusual for an SNR plasma, but rather resembles the hot plasmas associated with the jet sources, like SS433 or AGN. It is unclear whether CXO J184357035441 is a thermal component associated with AX J1843.80352, another SNR located in the far side of our Galaxy, or an extragalactic source.
4.3 Implications for the GRXs
The present discovery of many clumps with low surface brightness both in the hard (AX J1843.80352) and soft (CXO J184357035441) bands may have important hints on the GRXs. The GRXs have been found to exhibit three components, with two thermal plasma and hard non-thermal-tail (Kaneda et al., 1997; Yamasaki et al., 1997). The high temperature plasma (7–10 keV) emits strong K-shell lines from He-like irons (the hard component), while low temperature plasma (0.7 keV) has prominent K-shell lines from He-like Si and S, which is very similar to CXO J184357035441. The GRXs are prominent in the inner disk of the Galactic longitude , and the positions of AX J1843.80352 and CXO J184357035441 are near the edge of this inner disk.
The absorption corrected surface brightness of AX J1843.80352 in the 2.010 keV band is erg cm-2 s-1 sr-1, which corresponds to times that of the hard component (high temperature plasma and non-thermal tail) of GRXs at b0 (Kaneda et al., 1997; Yamasaki et al., 1997). The size of AX J1843.80352 (65 arcmin2) is times the region covered by Obs. 1 and Obs. 2 (510 arcmin2). From these values, we can estimate that in the 2.010 keV band, the contribution of AX J1843.80352 is 1/3 of the hard component of the GRXs from the region covered by the observations.
We also estimated the contibution of Si and S K-line emission from CXO J184357035441 into the GRXs. The flux of Si and S K-lines from CXO J184357035441 are and erg cm-2 s-1, respectively. On the other hand, since the brightness of Si and S K-lines of the GRXs are and erg cm-2 s-1 sr-1, respectively (cf. Kaneda et al. 1997), the fluxes of these lines from the region observed with are expected to be and erg cm-2 s-1. Therefore, to explain the Si and S K-line components of the GRXs with sources like CXO J184357035441, such sources are needed in each two observations. In order to see whether sources of new population like CXO J184357035441 are omnipresent or not, we encourage to perform further deep-exposure observations on the Galactic disk with or -.
5 Summary
1. We confirmed the diffuse hard X-ray emission, AX J1843.80352, which is a recently identified SNR with in a non-thermal radio complex.
2. The X-ray spectrum is represented with a non-thermal power-law model of photon index 2.1. Together with the elliptical morphology with a mean diameter of 18 pc, we confirm that AX J1843.80352 is an SNR which predominantly emits synchrotron X-rays.
3. We discovered a new X-ray source CXO J184357035441 within AX J1843.80352. CXO J184357035441 is extended (several arcsec) and exhibits thin-thermal spectrum. Its morphology is peculiar with an elliptical head and a jet-like tail.
4. The hydrogen column density toward CXO J184357035441 is cm-2, which is nearly twice larger than that of AX J1843.80352. Whether CXO J184357035441 is a part of the SNR or a background source is debatable.
References
- Anders & Grevesse (1989) Anders, E., & Grevesse, N. 1989, Geochim. Cosmochim. Acta, 53, 197
- Bamba et al. (2001) Bamba, A., Ueno, M., Koyama, K., & Yamauchi, S. 2001, PASJ, 53, L21
- Borkowski et al. (2001) Borkowski, K. J., Lyerly, W. J., & Reynolds, S. P. 2001, ApJ, 548, 820
- Dyer et al. (2001) Dyer, K.K., Reynolds, S. P., Borkowski, K. J., Allen, G. E., & Petre, R. 2001, ApJ, 551, 439
- Ebisawa et al. (2001) Ebisawa, K., Maeda, Y., Kaneda, H., & Yamauchi, S. 2001, Science, 293, 1633
- Ebisawa et al. (2002) Ebisawa K., Bamba A., Kaneda H., Maeda Y., Paizis A., Sato G., & Yamauchi S. 2002, in the proceedings of “the New Visions of the X-Ray Universe in the XMM-Newton and Chandra Era” symposium at ESTEC (astro-ph/0203070)
- Enomoto et al. (2002) Enomoto, R., et al. 2002, Nature, 416, 823
- Freeman et al. (2002) Freeman, P. E., Kashyap, V., Rosner, R., & Lamb, D.Q. 2002, ApJS, 138, 185
- Garmire (1997) Garmire, G. P., 1997, AAS meeting, 190, 34.04
- Hamilton & Sarazin (1984) Hamilton, A. J. S., & Sarazin, C. L. 1984, ApJ, 284, 601
- Helfand et al. (1989) Helfand, D.J., Velusamy, T., Becker, R. H., & Lockman, F. J. 1989, ApJ, 341, 151
- Kaneda et al. (1997) Kaneda, H., Makishima, K., Yamauchi, S., Koyama, K., Matsuzaki, K., & Yamasaki, N. Y. 1997, ApJ, 491, 638
- Koyama et al. (1986) Koyama, K., Makishima, K., Tanaka, Y., & Tsunemi, H. 1986, PASJ, 38, 121
- Koyama et al. (1995) Koyama, K., Petre, R., Gotthelf, E., Hwang, U., Matsuura, M., Ozaki, M., & Holt, S. 1995, Nature, 378, 255
- Koyama et al. (1997) Koyama, K., Kinugasa, K., Matsuzaki, K., Sugizaki, M., Nishiuchi, M., Torii, K., Yamauchi, S., & Aschenbach, B. 1997, PASJ, 49, L7
- Muraishi et al. (2000) Muraishi, H., et al. 2000, A&A, 354, L57
- Pacholczyk (1970) Pacholczyk, A. G. 1970, Radio Astrophysics (San Francisco: Freeman)
- Reynolds (1998) Reynolds, S. P. 1998, ApJ, 493, 375
- Slane et al. (1999) Slane, P., Gaensler, B. M., Dame, T. M., Hughes, J. P., Plucinsky, P. P., & Green, A. 1999, ApJ, 525, 357
- Slane et al. (2001) Slane, P., Hughes, J. P., Edgar, R. J., Plucinsky, P. P., Miyata, E., Tsunemi, H., & Aschenbach, B. 2001, ApJ, 548, 814
- Tanimori et al. (1998) Tanimori, T., et al. 1998, ApJ, 497, L25
- Weisskopf, O’dell, & van Speybroeck (1996) Weisskopf, M. C., O’Dell, S. L., & van Speybroeck, L. P. 1996, Proc. SPIE, 2805, 2
- Yamauchi et al. (1996) Yamauchi, S., Kaneda, H., Koyama, K., Makishima, K., Matsuzaki, K., Sonobe, T., Tanaka, Y., & Yamasaki, N. 1996, PASJ, 48, L15
- Yamasaki et al. (1997) Yamasaki, N. Y., et al. 1997, ApJ, 481, 821


| power-law | NEI | ||||
|---|---|---|---|---|---|
| Parameter | Obs. 1 | Obs. 2 | Obs. 1+2 | Obs. 1+2 | |
| Photon index | |||||
| AbundanceaaAssuming the solar abundance ratio (Anders & Grevesse, 1989). | |||||
| log( [cm-3 s]) | |||||
| [ cm-2] | |||||
| Absorbed fluxbbObserved flux per unit area (arcmin2) in 2.0–10.0 keV. [ erg cm-2 s-1 arcmin-2] | 2.3 | 3.1 | 3.1ccThe fluxes of “Obs. 1+2” are calculated from the normalizations for the spectrum of Obs. 2 which covers whole AX J1843.80352. | 3.0ccThe fluxes of “Obs. 1+2” are calculated from the normalizations for the spectrum of Obs. 2 which covers whole AX J1843.80352. | |
| Unabsorbed fluxddAbsorption-corrected flux per unit area (arcmin2) in 2.0–10.0 keV. [ erg cm-2 s-1 arcmin-2] | 3.6 | 4.3 | 4.3ccThe fluxes of “Obs. 1+2” are calculated from the normalizations for the spectrum of Obs. 2 which covers whole AX J1843.80352. | 4.1ccThe fluxes of “Obs. 1+2” are calculated from the normalizations for the spectrum of Obs. 2 which covers whole AX J1843.80352. | |
| d.o.f. | 18.9/27 | 48.1/52 | 68.1/81 | 65.3/79 | |
Note. — The errors correspond to 90% confidence.
| Parameter | Value |
|---|---|
| [keV] | |
| AbundanceaaAssuming the solar abundance ratio (Anders & Grevesse, 1989). | |
| log( [cm-3 s]) | |
| [] | |
| Absorbed fluxbbObserved flux in 0.7–10.0 keV. [erg cm-2 s-1] | |
| Unabsorbed fluxccAbsorption-corrected flux in 0.7–10.0 keV. [erg cm-2 s-1] | |
| d.o.f. | 22.2/39 |
Note. — The errors correspond to 90% confidence.
| Parameter | a | a |
|---|---|---|
| Cut-off frequency [ Hz] | ||
| Flux densityb [Jy] | ||
| [] | ||
| [G] | 8 | 6 |
| [erg] |
Note. — The errors and the error ranges correspond to 90% confidence.