Young Stars in the Outer H i Disc of NGC 6822
Abstract
We present wide-field optical imaging covering the entire neutral hydrogen disc of the Local Group dwarf galaxy NGC 6822. These observations reveal the presence of numerous blue, young stars at large galactocentric radii well beyond . Blue stars are also found that are associated with NGC 6822’s companion H i cloud, indicating that star formation was triggered in the companion in the last yr. In general, blue stars are present where the H i surface densities reach values cm-2. However, over one-third of the blue stars detected within the H i disk are found at lower surface densities. The young stars trace the distribution of the neutral hydrogen in the inner disk, but seem to be avoiding the supergiant H i shell in NGC 6822, setting a lower limit for its age of yr. The extended distribution of young stars implies that stars can form at large galactocentric radii in dwarf galaxies; the H i is therefore not necessarily much more extended than the stellar population. This finding has important consequences for the chemical enrichment of the interstellar medium throughout (dwarf) galaxies.
keywords:
galaxies: individual (NGC 6822) - galaxies: dwarf - galaxies: evolution - galaxies: stellar content1 Introduction
NGC 6822 is the most nearby dwarf irregular galaxy outside the Milky Way/LMC/SMC system and is therefore a prime target to study in detail the interplay of star formation and the atomic Interstellar Medium (ISM). At a distance of only 490 kpc, neutral hydrogen observations reach an unprecedented physical resolution and stellar population studies can be performed even with ground-based telescopes.
Extensive studies of the distribution and evolution of the stellar populations in NGC 6822 were done by e.g., Hodge (1977, 1980), Hodge et al. (1991) and Gallart et al. (1996a, b, c). These studies find a star formation history which is stochastic, low-level, but on average constant, with an increase in star formation rate (SFR) of a factor of a few around Myr ago, which persists until the present. Various estimates for the recent SFR (Israel et al., 1996; Gallart et al., 1996c; Hodge, Lee & Kennicutt, 1989) all indicate a low value between and , with an average of 0.06 (Mateo, 1998). NGC 6822 is a metal poor galaxy, with an ISM metal abundance of 0.2-0.3 (Pagel, Edmunds & Smith, 1980; Skillman et al., 1989). Similar values are found for the stellar abundances (Venn et al., 2001). The intermediate-age stellar population, as traced by C and M stars, was mapped by Letarte et al. (2002), who found that these are distributed in an elliptical halo that does neither trace the distribution of the H i, nor that of the main optical component. A number of C stars are found outside the H i disc, though this may be a common phenomenon for dwarf galaxies (e.g. Battinelli & Demers 2000).
The most recent observations in the 21-cm line of neutral hydrogen are presented in de Blok & Walter (2000) (hereafter dBW00) and Weldrake, de Blok & Walter (2003). These show that the galaxy is dark matter-dominatated, gas-rich, and reveal many interesting features, such as a highly structured H i disc, a super-giant H i shell, and the presence of a companion cloud. In this Letter, we discuss the properties and distribution of the stellar population, with emphasis on the young blue stars.
2 Observations and Analysis
NGC 6822 was observed with the 40′′ telescope at Siding Spring Observatory, Australia from 5-12 July 1999. We used the Imager with a 20482048 Tek CCD with a pixel scale of 0.6′′ pixel-1, resulting in an effective field of view of . The entire extent of the H i disc of NGC 6822 was covered in 8 pointings in and . Each field was observed for 2500s in and 3000s in . The total area covered was square arcmin. Standard stars were observed throughout the run. The seeing was fairly constant at 1.5′′–2′′. Conditions were photometric for 3 nights and variable during the rest of the run. We used the overlap regions between fields to put non-photometric images on the same flux scale. We found that due to this procedure absolute photometry is accurate to mag. We used the DOPHOT (Schechter, Mateo & Saha, 1993) crowded field photometry package to create a catalog of stellar objects in and in the observed area. Best results were obtained by using an analytical point spread function, adjusted to the typical seeing size for each field, and using a pixels box-averaged median background. Stellar detections in both bands were matched by cross-correlating the two lists, assuming a uncertainty in the positions. This procedure yielded a catalogue of stellar objects, the great majority of them being Galactic foreground stars.
3 Blue Stars in NGC 6822

3.1 Colour-magnitude diagram
In Fig. 1 the colour-magnitude diagram (CMD) of the entire observed field in and is shown. Two features are obvious: the large concentration of stars at and redder, and the plume with bluer colors at . Stars with are mainly Galactic foreground stars, though it is expected that some bright red stars in NGC 6822 also contribute. Stars with are the blue stars which (mostly) belong to NGC 6822.
Completeness limits at the faint magnitude end were derived by plotting the histograms of the apparent and magnitudes. These showed the expected steep increase of number of stars toward fainter apparent magnitudes, followed by a sharp drop-off due to decreasing completeness. The peaks in the histograms occurred at and , and we take these as our fiducial completeness limits.
We select the blue stars in the CMD by choosing only those detections with . This blue stellar population will be discussed in detail in this Letter. Using a distance modulus of (Gallart et al., 1996a), we find that the colours and luminosities of the blue stars associated with NGC 6822 are consistent with main sequence stars with spectral types between B5 and O5 . There are possibly a few stars of even earlier type present. The main sequence life-times of these stars vary from Myr (B5) to Myr or less (O5). Stars of later spectral types must obviously be present in NGC 6822 as well, but cannot be detected using the current data set. The total observed magnitude of the 1549 detected blue stars is or after correction for extinction and distance (the total blue luminosity of NGC 6822 is ).
3.2 Distribution and significance of Blue Stars

Figure 2a shows the position of the blue stars compared to the approximate extent of the optical galaxy, where we distinguish between stars with (“faint”) (grey dots) and stars with (“bright”) (black dots). Also shown (Fig. 2b) are the positions of the blue stars in relation to the distribution of the atomic interstellar medium (ISM) in NGC 6822 (see dBW00 and Weldrake, de Blok & Walter 2003). It is immediately clear that the blue stars cover a much larger area than what is usually regarded as the optical component of NGC 6822; the distribution of the blue stars is as extended as that of the inner main H i disk. Additionally stars seem present in the NW H i cloud. The only areas seemingly devoid of blue stars are the centre of the large hole and the tidal arm in the SE. Note that the latter does not imply there are no stars present there. It simply means that stars in this area must be fainter than in order not to be detected in the current data set. Deeper surveys may perhaps show a faint population there.
In Fig. 2c we show the distribution of C stars, which trace the intermediate age ( 3–5 Gyr) population (from Letarte et al. 2002). The distribution of the young stars is in stark contrast with that of the older stellar population. The latter is distributed in an elliptical halo that does not trace the distribution of the H i, and shows no internal structure. The young stars, on the other hand, have a clumpy, almost filamentary distribution. Two of the large concentrations coincide with the opposite ends of the bar-like optical structure. There is a larger ratio of bright to faint blue stars inside the optical bar than outside, presumably indicating more recent star formation there.
Blue star candidates are scattered throughout the field; however, most of these are likely to be false candidates (faint galactic blue stars, or, more probably, stars that are scattered into the blue bin due to magnitude uncertainties). Nevertheless, as presumably the contribution of false candidates within the disk of NGC 6822 is as important as outside the disk, it is illustrative to quantify the significance of the detected overdensities in the presence of this background of false detections. To this end we have used the observed distribution of detected objects to calculate the number density distribution by counting the number of detections in 30′′ by 30′′ boxes. This size was chosen as a compromise between preserving spatial resolution and getting sufficient numbers of detections in each box. The size of the box does not affect the conclusions. The creation and detection of false candidates in the field is a random proces, so the presence or absence of candidates in each box can be regarded as a shot-noise process, and the surface density of the false candidates will be approximately constant across the field.
We have investigated the number of false candidates in each box outside the cm-2 H i column density contour (i.e., outside the entire H i disk as shown in Fig. 2). We will refer to this area as “the field”. There are 4955 30 boxes in the field, of which 4868 have no false candidates, 84 have 1 false candidate and 3 have 2 false candidates. This distribution can be well described by a Poisson distribution , with . The cumulative Poisson distribution then yields that the chance of getting 2 or more false candidates in a box due to shot-noise effects is less than 0.1 percent. Figure 3 shows the number density image, where we only show boxes with 2 or more candidates, which are thus statistically very unlikely to have resulted from random effects. Note that the presence of the few significant boxes outside the H i disk is entirely consistent with the derived Poisson distribution. Using this distribution we can also compute that we expect false detections within the entire H i disk. This is in sharp contrast with the stars actually found. A repeat of this analysis with different sized boxes yields identical conclusions: the number density of false detections can be described by a Poisson distribution and the features in the stellar distribution as described above are statistically significant.
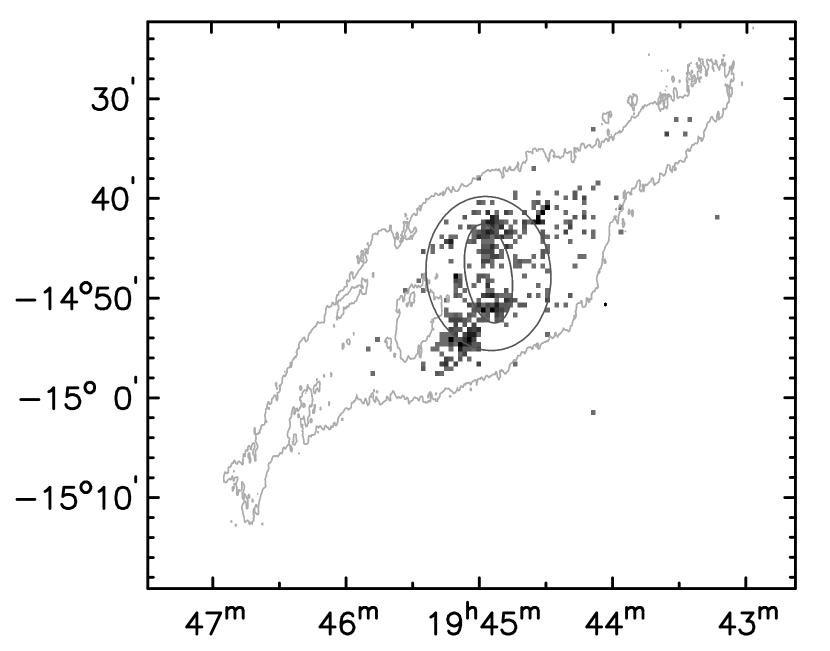

Figure 4 shows a histogram of the surface densities at the position of the blue stars (at [ pc] resolution). Of the stars detected in the H i disc, are found at surface densities of cm-2, close to or above the empirical star-formation threshold (e.g. Skillman 1987; Kennicutt 1989). It is however worth noting that stars are found at surface densities significantly lower than this star formation threshold value. (These numbers do not include the presumed false candidates outside the H i disc). From the Poisson distributions derived above we only expect false candidates in the H i disk, clearly not enough to explain the large number of stars at low surface densities. For comparison, a normalized histogram showing the relative distribution of surface densities of the entire H i disc is over-plotted in Fig. 4.
Figure 2d shows the positions of the blue stars superimposed on a map of the velocity dispersion of the H i gas. A histogram of the velocity dispersions at the positions of the blue stars is shown in Fig. 4. The average velocity dispersion of the H i gas at the positions of the blue stars is , about 1 higher than the average velocity dispersion of the H i gas in the entire disc. Assuming an internal velocity dispersion of a few km s-1 for a single star cluster (or OB association) after its formation out of a molecular cloud, we estimate that the observed young stars can travel 100 pc away from their parent molecular cloud over their lifetimes. It is thus unlikely that the young stars found at low surface densities have traveled there from high-density regions.
3.3 Details of the HI distribution
The companion HI cloud. A small concentration of OB stars at a galactocentric distance of kpc is detected to the NW of the galaxy. It coincides with the position of the companion H i cloud described in dBW00. This companion is presumably interacting with NGC 6822 on timescales of 100-200 Myr (see dBW00 for details). The presence of blue stars with ages less than 100 Myr gives additional support to this scenario, the idea being that star formation was triggered in the smaller companion as a result of the interaction. Moreover, no tracers for an intermediate age population of stars are found in the H i cloud, implying that we may indeed be seeing the first major episode of star formation here.
The supergiant HI shell. It is striking that no large population of bright blue stars is found inside the supergiant HI shell (SGS). In dBW00 we derived an age of Myr for the SGS. The blue stars trace ages up to Myr so we can place a lower limit on the age of the SGS of order Myr. If the SGS was ‘only’ 130 Myr old, and if stars created the hole, we would expect to detect at least some of the remnant stars. The non-detection of this population of stars implies that the SGS is probably older than previously derived. As was noted by dBW00, it is difficult to derive an accurate dynamical age for the SGS due to the lack of clear signs of expansion. As NGC 6822 rotates almost like a solid body throughout the region of interest (Weldrake, de Blok & Walter, 2003), large coherent structures such as the SGS can remain intact for many years, long after the remnant stellar population has faded (see also Walter & Brinks 1999).
The prominent concentration of young stars toward the south-east. A prominent large concentration of blue stars outside is readily seen to the south-east of the bar. It causes the asymmetric appearance of NGC 6822 in the -band (e.g. Hodge 1977). It is in fact the most prominent association of blue stars in the galaxy. While the velocity dispersion of the H i at the positions of the other large blue star concentrations hovers between and , at this position the average dispersion is only to 7 (cf. Figs. 2d and 4). There is a lack of prominent H emission in this region compared to the other concentrations (see Hodge, Kennicutt & Lee 1988), suggesting that the SFR has declined in the past 10 Myr. The conspicuous lack of C stars indeed suggests that this region has undergone its first major episode of star formation some 10-100 Myr ago.
4 Conclusions
We have presented a comparison of the distribution of blue stars and the atomic ISM in NGC 6822. We find that the distribution of the blue stars is almost as extended as that of the main H i disk of NGC 6822. Only the large hole and the tidal arms are devoid of blue stars. Blue stars are typically found at H i surface densities cm-2, however over one-third of the blue stars is found at lower surface densities. This could imply that a) stars can form at surface densities below the canonical star formation threshold; b) the ISM is very clumped at scales smaller than the current resolution of pc; c) star formation has destroyed or ionized the regions of higher surface densities in which these stars originally formed or d) the stars traveled from higher density regions within their lifetimes. However, due to their short lifespan, blue stars are only expected to travel some 100 pc from their places of birth and stellar cluster dispersion can not explain the similarity of the distributions of the blue stars and the atomic ISM.
Given the rather symmetrical distribution of the C-stars, it is clear that neither the SGS, nor the interaction with the NW cloud has affected the distribution of the old population (and therefore the bulk of the mass in stars and stellar remnants). The processes that are so dramatically visible in the Hi, must have had hardly any impact on the overall mass distribution in NGC 6822. The presence of blue stars over the main body of NGC 6822, as well as in the NW cloud implies that star formation is occurring not just in the optical disk, but that pollution of the ambient ISM is taking place on a larger scale (similar conclusions can be drawn for massive galaxies as well, see e.g., Cuillandre et al. 2001). This may partly explain the flat abundance patterns found in chemical abundances studies of low-mass galaxies (e.g., Kobulnicky & Skillman 1997). No large population of young blue stars has been detected in the supergiant H i shell, setting a lower limit on its age of Myr (again, this does not rule out the presence of a fainter population). The fact that a population of blue stars with ages Myr is found in the companion H i cloud, but no tracers of an older population are found, provides evidence that star formation has been triggered here only recently, very possibly for the first time. In summary, our results show that the distribution of the atomic ISM in dwarf irregular galaxies is not necessarily much more extended than that of its stellar population.
Acknowledgments
EdB acknowledges support from a PPARC Advanced Fellowship.
References
- Battinelli & Demers (2000) Battinelli, P., Demers, S., 2000, AJ, 120, 1801
- Cuillandre et al. (2001) Cuillandre, J.-C., Lequeux, J., Allen, R.J., Mellier, Y., Bertin, E., 2001, ApJ, 554, 190
- de Blok & Walter (2000) de Blok, W.J.G., Walter, F., 2000, ApJ, 537, L95
- Gallart et al. (1996a) Gallart, C., Aparicio, A., Vílchez, J.M. 1996a, AJ, 112, 1928
- Gallart et al. (1996b) Gallart, C., Aparicio, A., Bertelli, G., Chiosi, C. 1996b, AJ, 112, 1950
- Gallart et al. (1996c) Gallart, C., Aparicio, A., Bertelli, G., Chiosi, C. 1996c, AJ, 112, 2596
- Hodge (1980) Hodge, P.W., 1980, ApJ, 241, 125
- Hodge (1977) Hodge, P.W., 1977, ApJS, 33, 69
- Hodge et al. (1991) Hodge, P., Smith, T., Eskridge, P., MacGillivray, H., Beard, S., 1991, ApJ, 379, 621
- Hodge, Kennicutt & Lee (1988) Hodge, P., Kennicutt, Jr., R.C., Lee, M.G., 1988, PASP, 100, 917
- Hodge, Lee & Kennicutt (1989) Hodge, P., Lee, M.G., Kennicutt, Jr., R.C., 1989, PASP, 101, 32
- Israel et al. (1996) Israel, F.P., Bontekoe, Tj.R., Kester, D.J.M., 1996, A&A, 308, 723
- Kennicutt (1989) Kennicutt, Jr., R.C., 1989, ApJ, 344, 685
- Kobulnicky & Skillman (1997) Kobulnicky, H.A., Skillman, E.D., 1997, ApJ, 489, 636
- Letarte et al. (2002) Letarte, B., Demers, S., Battinelli, P., Kunkel, W.E., 2002, ApJ, 123, 832
- Mateo (1998) Mateo, M.L., 1998, ARA&A, 36, 435
- Pagel, Edmunds & Smith (1980) Pagel, B.E.J, Edmunds, M.G., Smith, G., 1980, MNRAS, 193, 219
- Schechter, Mateo & Saha (1993) Schechter, P.L., Mateo, M., Saha, A., 1993, PASP, 105, 1342
- Skillman (1987) Skillman, E.D., 1987, in Star Formation in Galaxies, ed. C.J. Lonsdale Persson, NASA, CP-2466, p. 263
- Skillman et al. (1989) Skillman, E.D., Terlevich, R., Melnick, J., 1989, MNRAS, 240, 563
- Venn et al. (2001) Venn, K.A., Lennon, D.J., Kaufer, A., McCarthy, J.K., Pryzbilla, N., Kudritzki, R.P., Lemke, M., Skillman, E.D., Smartt, S.J., 2001, ApJ, 547, 765
- Walter & Brinks (1999) Walter F., Brinks E., 1999, AJ, 118, 273
- Weldrake, de Blok & Walter (2003) Weldrake, D.T.F., de Blok, W.J.G., Walter, F., 2003, MNRAS, 340, 12