A NEW CLUE TO THE TRANSITION MECHANISM BETWEEN OPTICAL HIGH AND LOW STATES OF THE SUPERSOFT X-RAY SOURCE RX J0513.96951, IMPLIED FROM THE RECURRENT NOVA CI AQUILAE 2000 OUTBURST MODEL
Abstract
We have found a new clue to the transition mechanism between optical high/X-ray off and optical low/X-ray on states of the LMC supersoft X-ray source RX J0513.96951. A sharp mag drop is common to the CI Aql 2000 outburst. These drops are naturally attributed to cessation of optically thick winds on white dwarfs. A detailed light-curve analysis of CI Aql indicates that the size of a disk drastically shrinks when the wind stops. This causes mag drop in the optical light curve. In RX J0513.96951, the same mechanism reproduces sharp mag drop from optical high to low states. We predict this mechanism also works on the transition from low to high states. Interaction between the wind and the companion star attenuates the mass transfer and drives full cycles of low and high states.
1 INTRODUCTION
The Large Magellanic Cloud (LMC) supersoft X-ray source RX J0513.96951 (hereafter RX J0513) shows a prominent recurrency of optical high and low states with quasi-regular intervals ( days high and days low states). Copious supersoft X-rays were detected only in the optical low states (e.g., Schaeidt et al., 1993). The transition mechanism between high and low states have not been fully elucidated yet, although a few ideas were proposed (see, e.g., Reinsch et al., 2000, for recent progress). We have found a new clue to this transition mechanism from modeling of the recurrent nova CI Aquilae.
CI Aql erupted in 2000 April has been densely observed in various optical bands (e.g., Hachisu, Kato, & Schaefer, 2002; Kiss et al., 2001; Lederle & Kimeswenger, 2002; Matsumoto et al., 2001; Schmeja, Armsdorfer, & Kimeswenger, 2000) and in X-ray bands (Greiner & DiStefano, 2002). It reached the optical maximum ( mag) on 2000 May 5. The visual brightness quickly decreased to in about 50 days. Then, it stays at for about 150 days, i.e., a plateau phase.
Matsumoto et al. (2001) reported a sharp mag drop of -magnitude on 2000 November 23, about 200 days after the optical maximum, and Kiyota (2001, VSNET archives, http://vsnet.kusastro.kyoto-u.ac.jp/vsnet/) also observed a mag drop of -magnitude around the same day as Matsumoto et al.’s (2001) observation (see, e.g., Hachisu et al., 2002). Shortly after this drop, both the - and -magnitudes recovered by mag but stayed at mag below the level before the drop. Hachisu & Kato (2001a) and Hachisu et al. (2002) attributed this drop to cessation of massive winds by calculating time-evolution of optically thick winds on a white dwarf (WD).
The above feature of CI Aql light curve reminds us the optical high-to-low transition of RX J0513. In this paper, we try to reproduce the sharp drop in the optical light curves, both for CI Aql and RX J0513, by the same mechanism. In §2, our numerical method and models for the CI Aql 2000 outburst are briefly introduced and summarized. The numerical results for the CI Aql 2000 outburst are given in §3. We try to reproduce the transition between high and low states of RX J0513 in §4. Discussion follows in §5.
2 BASIC MODEL OF CI AQUILAE 2000 OUTBURST
The mid plateau phase is a common feature among the U Sco subclass of the recurrent nova class, to which both U Sco and CI Aql belong. The plateau phase is well explained by the contribution of an irradiated disk (e.g., Hachisu et al., 2000). The presence of the disk in outburst was observationally confirmed by Thoroughgood et al. (2001).
Our binary model is illustrated in Figure 1, which consists of a main-sequence star (MS) filling its Roche lobe, a WD photosphere, and a disk around the WD. A circular orbit is assumed. We also assume that the surfaces of the WD, the companion, and the disk emit photons as a blackbody at a local temperature which varies with position. We assume an axi-symmetric accretion disk with the size and thickness of
| (1) |
and
| (2) |
where is the outer edge of the optically thick part of the accretion disk, is the effective radius of the inner critical Roche lobe for the WD component, is the height of the surface from the equatorial plane, and is the distance from the symmetry axis. Here, we adopt during the strong wind phase, but when rapid mass accretion resumes after the optically thick wind stops, to mimic the flaring-up disk by spray (e.g., Schandl, Meyer-Hofmeister, & Meyer, 1997). The other two parameters of and are determined by light curve fittings.
We have used the same parameters as those in Hachisu et al. (2002) unless otherwise specified. The mass of the white dwarf was determined to be by Hachisu & Kato (2001a). The mass and temperature of the companion star were estimated to be and 7,300 K (see, e.g., Hachisu & Kato, 2001b, for the present evolutional status) from the light curve fitting of the orbital modulations in the 2000 outburst (Hachisu et al., 2002; Lederle & Kimeswenger, 2002). The inclination angle is a free parameter, which is redetermined from our light curve fitting.
Time evolution of the photospheric radius and temperature of the WD are calculated from Kato & Hachisu’s (1994) optically thick wind solutions (see Hachisu & Kato, 2001b, for more details of the numerical methods). When the photospheric radius shrinks smaller than the binary size, the irradiation effects both of the disk and of the companion become important (see, e.g., Fig. 2 of Hachisu et al., 2000, for such an example).
3 WHAT WE LEARNED FROM CI AQUILAE
Orbital modulations during the plateau phase have been reported by Matsumoto et al. (2001). Their light curve data show a scatter of mag so that we average them into 36 phase bins as shown in Figure 2. No secondary eclipses were observed in contrast to the later phase orbital light curves (Lederle & Kimeswenger, 2002). To fit these orbital modulations as well as the entire evolution of -magnitude, we have calculated light curves with various parameters ( is changed by 0.1 steps, by 0.05 steps, and the inclination angle by 1 steps). The best fit model is shown in Figure 2, i.e., and .
Here we plot two identical orbital modulations, but one is shifted by 0.36 mag down. The brighter one corresponds to the earlier stage on 2000 July 17 while the fainter one does to that on 2000 October 1. To reproduce the light curves with no secondary eclipses, we need both (1) large (area) irradiation effect to reproduce the brightness, and (2) bright sources other than the companion to eliminate the secondary eclipse. Then, we assumed that (a) the outer edge of an optically thick disk extends up to almost the orbital separation as illustrated in Figure 1a, and that (b) the WD photosphere is as large as on July 17 and on October 1 if the other conditions are the same between these two epochs. Any light sources other than the disk or the companion are unlikely to contribute to the -magnitude because the strong wind blows up off nebulosities around. This large extension of the disk naturally explains evident lack of secondary minima. The width of sharp eclipse minima, orbital phase, is caused by the partial occultation of the WD photosphere. These large photospheric radii ( from July 17 to October 1) are very consistent with our theoretical model because WDs blow a wind when (e.g., Kato & Hachisu, 1994; Hachisu & Kato, 2001b; Hachisu et al., 2002).
The effect of a larger inclination angle is canceled out by the effect of a larger radius of the disk. For example, a combination of the inclination angle and the disk of can also reproduce the light curve modulations (dashed line) as shown in Figure 2. Its eclipse dip seems to be too deep to be compatible with the observation. However, the total amplitude of the modulations is mag (see Fig. 4 of Matsumoto et al., 2001, for the original observation) and still consistent. Here we adopted a set of and . In both and cases, the secondary occults only a part of the disk. This is, however, enough to make a orbital modulation observed because the central part of the disk is much brighter than the outer part.
The velocities of winds calculated are as fast as km s-1 (e.g., Kato & Hachisu, 1994) and the wind mass loss rate is as large as yr-1 (e.g., Hachisu & Kato, 2001b). Observationally much faster wind velocities are reported, for example, km s-1 in CI Aql (see, e.g., Kiss et al., 2001). Such a strong wind affects the surface of the accretion disk. Because of a large velocity difference between the wind and the disk surface, it certainly drives the Kelvin-Helmholtz instability at the interface. Only the very surface layer of the disk is dragged away outward with the velocity at least several hundred km s-1 like a free stream moving outward. This surface free stream is optically thick near the original disk but becomes optically thin somewhere outside because of geometrical dilution effect. We regard the transition place from optically thick to thin as the edge of the extended disk.
It should be noted that a high density part of the disk is hardly changed by this relatively tenuous surface free stream and still resides within its Roche lobe because the internal density of the disk is much denser than that of the WD wind. The wind mass loss rate is about yr-1 and its velocity is km s-1, so that the density of the wind is estimated from the continuity () to be about g cm3 at the distance of from the center of the WD. On the other hand, the density of the standard accretion disk is about g cm3 at the same radius. Here, we assume the standard accretion disk model (Shakura & Sunyaev, 1973) with a mass accretion rate of yr-1.
After the wind stops, the photospheric radius of the WD quickly shrinks in the Kelvin-Helmholtz timescale of the envelope, i.e.,
| (3) |
where and are the Kelvin-Helmholtz timescale and the thermal energy of the WD envelope, respectively, and is the luminosity of the WD. Here, we adopt a typical thermal energy of the WD envelope from our solutions. It takes 20 days from to and takes another 20 days from to from our wind solutions and evolution models. The disk edge of optically thick part shrinks to a normal size of times the Roche lobe radius as observed in the supersoft X-ray sources (e.g., Hachisu et al., 2002; Lederle & Kimeswenger, 2002). This may occur in several dynamical timescales, i.e., a few to several days. Here, we adopt 10 days, i.e., the transition from configuration (a) to (b) in Figure 1. We adopt for configuration (b). Then, the mass transfer rate from the MS to the WD increases to make a spray around the accretion disk as seen in luminous supersoft X-ray sources. This can be mimicked by a flaring edge of the accretion disk, i.e., configuration (c) in Figure 1 (see, e.g., Hachisu et al., 2002; Lederle & Kimeswenger, 2002, for light curves and flaring-up disk models after the wind stops). We adopt . It also takes several dynamical timescales. Here we take days for the formation time of the spray. Thus, we are able to reproduce a sharp mag drop around 2000 November 23 and the ensuing mag recovery soon after the drop, as shown in Figure 3. A similar transition was observed in the U Sco 1999 outburst on HJD 2,451,244 just before the detection of supersoft X-rays (see Fig. 2 of Hachisu et al., 2000; Kahabka et al., 1999).
4 LMC supersoft X-ray source RX J0513.96951
The LMC supersoft X-ray source RX J0513.96951 shows regular transitions between days optical high (X-ray off) and days optical low (X-ray on) state. The X-ray off/optical high state was understood by a large expansion of the WD photosphere, which is triggered by an increase in the mass transfer rate onto the WD (e.g., Meyer-Hofmeister et al., 1997; Pakull et al., 1993; Reinsch et al., 1996, 2000; Southwell et al., 1996). When the WD envelope expands, an optically thick wind begins to blow. As we already know in CI Aql, the sharp drop of -mag is naturally explained by cessation of the wind. Our scenario is as follows:
1. We assume the metallicity of and hydrogen
content of for the envelope of the WD in RX J0513
since the LMC metallicity is reported to be about a third of
the solar metallicity.
2. We have directly calculated the duration of the wind phase and
the Kelvin-Helmholtz timescale on massive WDs of 1.0, 1.1, 1.2, 1.3,
1.35, 1.36, 1.37, and
(see also Hachisu & Kato, 2001b, for wind solutions).
The WD model
gives us a reasonable wind timescale of days
and a Kelvin-Helmholtz timescale of days.
3.
We use the ephemeris revised by Cowley et al. (2002).
The inclination angle is not known but suggested to be
low. Here we adopt . The light curve is not so
different among . The calculated light curve
is plotted in Figure 4, which is made
by connecting brightness at the orbital phase 0.4 (phase 0.0 is
the minimum of the light curve modulation). The mass ratio of
is assumed because a high mass
transfer rate of yr-1 is suggested
(e.g. Southwell et al., 1996). The non-irradiated surface temperature of
the lobe-filling
MS companion is assumed to be 13,000 K (e.g., Fagotto et al., 1994).
4. We assume the original mass transfer rate of
yr-1 as a reasonable value of
thermally unstable mass transfer for and .
This value is realized whenever the wind does not suppress the mass
transfer. So, we start a rapid mass accretion to
the WD at the rate of yr-1
(denoted by -mark
in Fig. 4). The WD envelope gradually
expands and eventually blows a wind (see the mid and bottom panels of
Fig. 4). This causes a quick rise of -mag.
Here we assume the disk expansion
of in the wind phase. It takes a few to
several dynamical timescales. We adopt 3 days.
The massive winds having the rate of
yr-1 certainly absorb supersoft X-rays
(e.g., Southwell et al., 1996).
5. This rapid mass accretion is suppressed by the strong wind,
because the wind hits and then strips-off the very surface layer of
the MS companion (see Hachisu et al., 1999a, for a description of the stripping
effect by winds).
We stop the rapid mass accretion when the wind mass loss rate increases
and the mass-stripping rate overcomes the mass transfer rate of
yr-1. This happens when the WD
photosphere expands to the value shown in Figure 4
(-mark).
However, we still keep a low rate
( yr-1)
during the period of draining of the disk
(a few times viscous timescale of the disk days,
e.g., Reinsch et al., 2000) even after the rapid mass accretion stops.
6. When the optically thick winds stops (-mark),
we expect copious supersoft X-rays as observed in the U Sco 1999
outburst (Kahabka et al., 1999). Then the photosphere of the WD shrinks
from ( K) to
(430,000 K) in days. The photospheric temperature is
consistent with the blackbody fitted temperatures ( eV)
of the supersoft X-rays (e.g., Schaeidt et al., 1993) as shown in Figure
4. The disk shrinks to a normal size
of in a week and then the edge of
the disk begins to flare up, i.e.,
in another week, as described in §3.
7. Rapid mass accretion to the WD resumes (-mark)
days after the wind stops. We expect that the mass transfer
rate gradually increases just after the wind stops but it takes
days to reach the WD surface.
This timescale may be regarded as a viscous timescale of the accretion
disk (Reinsch et al., 2000). Then, the photospheric radius of the white dwarf
expands in days and eventually blows winds.
Then, go to 4 and repeat the cycle.
5 DISCUSSION
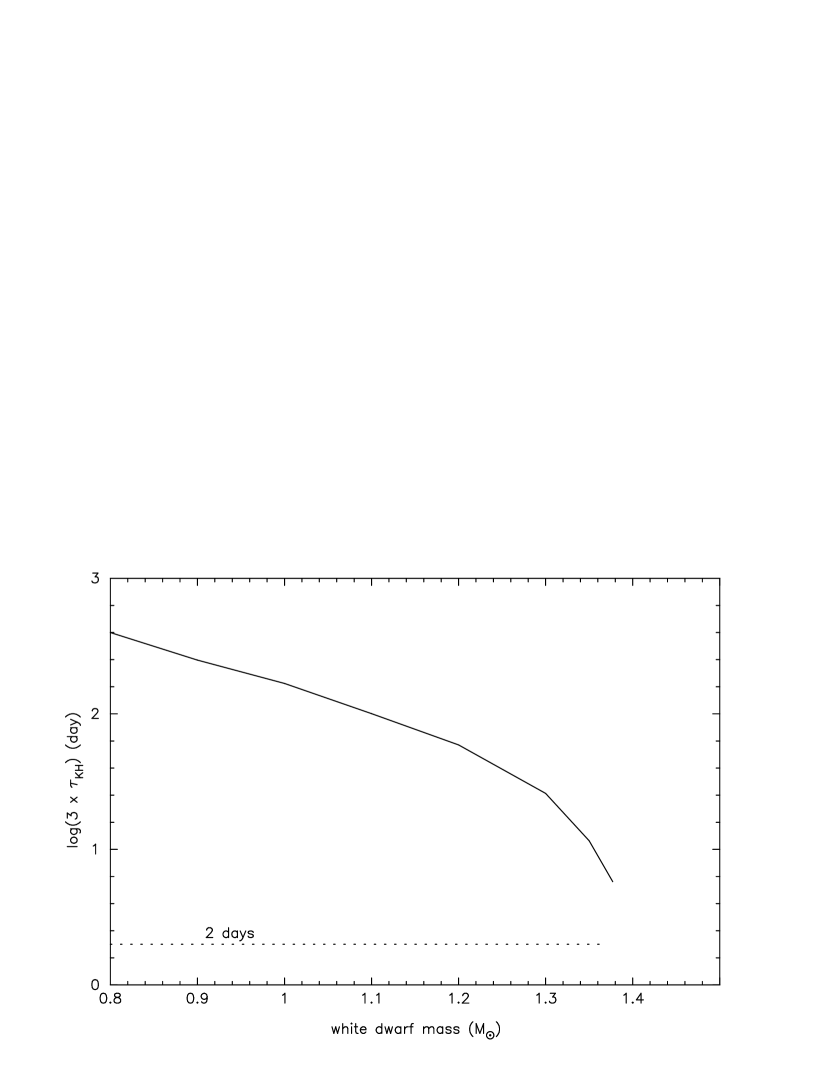
Thus, we are able to reproduce the transition between the optical high and low states of RX J0513 as shown in Figure 4. Our new model is essentially different from the previous expansion/contraction models of the white dwarf photosphere in the following sense: The emergence/decay timescale of the observed supersoft X-rays is as short as one or two days (Reinsch et al., 2000). This short timescale cannot be explained by the expansion/contraction of the envelope. We have calculated the timescales of photospheric contraction based on our WD envelope model (Kato & Hachisu, 1994) and show them in Figure 5 against the WD mass. The contraction timescale depends on the envelope mass of the WD and it is shortest just after the optically thick wind stops as shown in Figure 4. In this phase, the timescale of contraction by a factor of four is about three times the Kelvin-Helmholtz timescale. It is clear that the timescale of contraction by a factor of four cannot be shorter than six days even if the WD mass is very close to the Chandrasekhar mass. We may conclude that only the expansion/contraction model of the white dwarf photosphere cannot reproduce a very short timescale of X-ray on/off. We need another mechanism.
On the contrary, optically thick winds completely obscure supersoft X-rays within one day after it starts. The wind mass loss rate increases from zero to yr-1 in a day when it starts, or it decreases from yr-1 to zero in a day when it ceases, as easily seen from Figure 4. This wind mass loss rate of yr-1 is large enough to absorb supersoft X-rays (see, e.g., discussion of Southwell et al., 1996).
In the scenario proposed by Hachisu et al. (1999a, b), all the progenitor systems of Type Ia supernovae once experience the optically thick wind phase during their way to Type Ia supernova. RX J0513 may be an example for such a wind phase. We have calculated the efficiency of mass accretion to be about 35% for the case of Figure 4. The other 65% is blown in the wind or stripped off from the companion surface and eventually lost from the binary system. Assuming this efficiency being kept, we can expect that the white dwarf in RX J0513.96951 will explode as a Type Ia supernova after about is transferred even when the WD mass is .
References
- Alcock et al. (1996) Alcock, C. et al. 1996, MNRAS, 280, L49
- Cowley et al. (2002) Cowley, A.P., Schmidtke, P.C., Crampton, D., & Hutchings, J.B. 2002, AJ, 124, 2233
- Cowley et al. (1993) Cowley, A. P., Schmidtke, P. C., Hutchings, J. B., Crampton, D., & McGrath, T. K. 1993, ApJ, 418, L63
- Fagotto et al. (1994) Fagotto, F., Bressan A., Bertelli G., Chiosi C. 1994, A&AS, 105, 29
- Gänsicke et al. (1998) Gänsicke, B. T., van Teeseling, A., Beuermann, K., & de Martino, D. 1998, A&A, 333, 163
- Greiner & DiStefano (2002) Greiner, J., & DiStefano, R. 2002, ApJ, in press (astro-ph/0210035)
- Hachisu & Kato (2001a) Hachisu, I., & Kato, M. 2001a, ApJ, 553, L161
- Hachisu & Kato (2001b) Hachisu, I., & Kato, M. 2001b, ApJ, 558, 323
- Hachisu et al. (2000) Hachisu, I., Kato, M., Kato, T., & Matsumoto, K. 2000, ApJ, 528, L97
- Hachisu et al. (1999a) Hachisu, I., Kato, M., & Nomoto, K. 1999a, ApJ, 522, 487
- Hachisu et al. (1999b) Hachisu, I., Kato, M., Nomoto, K., & Umeda, H. 1999b, ApJ, 519, 314
- Hachisu et al. (2002) Hachisu, I., Kato, M., & Schaefer, B. E. 2002, ApJ, in press (astro-ph/0210592)
- Kahabka et al. (1999) Kahabka, P., Hartmann, H. W., Parmar, A. N., & Negueruela, I. 1999, A&A, 374, L43
- Kato & Hachisu (1994) Kato, M., & Hachisu, I., 1994, ApJ, 437, 802
- Kiss et al. (2001) Kiss, L. L., Thomson, J. R., Ogloza, W., Fürész, G., & Sziládi, K. 2001, A&A, 366, 858
- Lederle & Kimeswenger (2002) Lederle, C., & Kimeswenger, S. 2002, A&A, in press (astro-ph/0209580)
- Matsumoto et al. (2002) Matsumoto, K., Ishioka, R., Uemura, M., Kato, T., Kawabata, T. 2002, MNRAS, in press (astro-ph/0211241)
- Matsumoto et al. (2001) Matsumoto, K., et al. 2001, A&A, 378, 487
- Meyer-Hofmeister et al. (1997) Meyer-Hofmeister, E., Schandl, S., & Meyer, F. 1997, A&A, 321, 245
- Nomoto et al. (1984) Nomoto, K., Thielemann, F., & Yokoi, K. 1984, ApJ, 286, 644
- Pakull et al. (1993) Pakull, M. W., Motch, C., Bianchi, L., Thomas, H.-C., Guibert, J., Beaulieu, J. P., Grison, P., & Schaeidt, S. 1993, A&A, 278, L39
- Reinsch et al. (1996) Reinsch, K., van Teeseling, A., Beuermann, K., & Abbott, T. M. C. 1996, A&A, 309, L11
- Reinsch et al. (2000) Reinsch, K., van Teeseling, A., King, A. R., & Beuermann, K. 2000, A&A, 354, L37
- Schaeidt et al. (1993) Schaeidt, S., Hasinger, G., & Truemper, J. 1993, A&A, 270, L9
- Schandl et al. (1997) Schandl, S., Meyer-Hofmeister, E., & Meyer, F. 1997, A&A, 318, 73
- Schmeja et al. (2000) Schmeja, S., Armsdorfer, B., & Kimeswenger, S. 2000, Inf. Bull. Variable Stars, 4957
- Shakura & Sunyaev (1973) Shakura, N. I., & Sunyaev, R. A. 1973, A&A, 24, 337
- Southwell et al. (1996) Southwell, K. A., Livio, M., Charles, P. A., O’Donoghue, D., & Sutherland, W. J. 1996, ApJ, 470, 1065
- Thoroughgood et al. (2001) Thoroughgood, T. D., Dhillon, V. S., Littlefair, S. P., Marsh, T. R., & Smith, D. A. 2001, MNRAS, 327, 1323