XMM-Newton observations of the Perseus Cluster I: The temperature and surface brightness structure
Abstract
We present preliminary results of the XMM-Newton 50 ksec observation of the Perseus cluster which provides an unprecedented view of the central 0.5 Mpc region. The projected gas temperature declines smoothly by a factor of 2 from a maximum value of 7 keV in the outer regions to just above 3 keV at the cluster center. Over this same range, the heavy element abundance rises slowly from 0.4 solar to 0.5 solar as the radius decreases from to , and then rises to a peak of almost 0.7 solar at before declining to 0.4 at the center. The global east/west asymmetry of the gas temperature and surface brightness distributions, approximately aligned with the chain of bright galaxies, suggests an ongoing merger, although the modest degree of the observed asymmetry certainly excludes a major merger interpretation. The chain of galaxies probably traces the filament along which accretion has started some time ago and is continuing at the present time. A cold and dense (low entropy) cluster core like Perseus is probably well “protected” against the penetration of the gas of infalling groups and poor clusters whereas in non-cooling core clusters like Coma and A1367, infalling subclusters can penetrate deeply into the core region. In Perseus, gas associated with infalling groups may be stripped completely at the outskirts of the main cluster and only compression waves (shocks) may reach the central regions. We argue, and show supporting simulations, that the passage of such a wave(s) can qualitatively explain the overall horseshoe shaped appearance of the gas temperature map (the hot horseshoe surrounds the colder, low entropy core) as well as other features of the Perseus cluster core. These simulations also show that as compression waves traverse the cluster core, they can induce oscillatory motion of the cluster gas which can generate multiple sharp “edges”, on opposite sides or the central galaxy. Gas motions induced by mergers may be a natural way to explain the high frequency of “edges” seen in clusters with cooling cores.
1 Introduction
The Perseus cluster of galaxies (Abell 426) is the X-ray brightest nearby cluster (with , corresponds to 30 kpc (29.7 kpc) for which we use throughout). It was first reported as an extended X-ray source from UHURU observations (Forman et al. 1972) and first images (Gorenstein et al. 1978; see also Fabian et al. 1974; Wolff et al. 1974; Malina et al. 1978) provided a glimpse of the X-ray structure of Perseus. Detailed X–ray images were obtained with the Einstein IPC (Branduardi–Raymont et al. 1981) and HRI (Fabian et al. 1981), the ROSAT PSPC (Schwarz et al. 1992, Ettori, Fabian, White 1998), HRI (Böhringer et al. 1993) and recently with Chandra (Fabian et al. 2000, Schmidt, Fabian & Sanders, 2002). The cluster has a prominent X–ray surface brightness peak centered on the active galaxy NGC 1275, containing a strong core-dominated radio source (Per A, 3C84) surrounded by a lower surface brightness halo (e.g. Pedlar et al. 1990, Sijbring 1993). Many studies have explored the correlations between X-ray, radio, optical, and ultraviolet emission in the core (see e.g. McNamara, O’Connell & Sarazin 1996 and references therein). The proximity and brightness of the cluster make it a natural target for studies of a relatively relaxed cluster with a cold core. In this contribution, we report preliminary results of the XMM-Newton 50 ksec observations of the Perseus cluster.
The structure of the paper is as follows: in Section 2 we discuss XMM-Newton observations of the cluster, in Section 3 we describe the analysis of the data and present the results, in Section 4 we discuss possible implications of the results, and in Section 5 we summarize our findings. The analysis of the substructure in the very core (less than ) of the Perseus cluster and details of the heavy element abundance and distribution are beyond the scope of this paper and will be reported in subsequent publications.
2 Observations and background subtraction
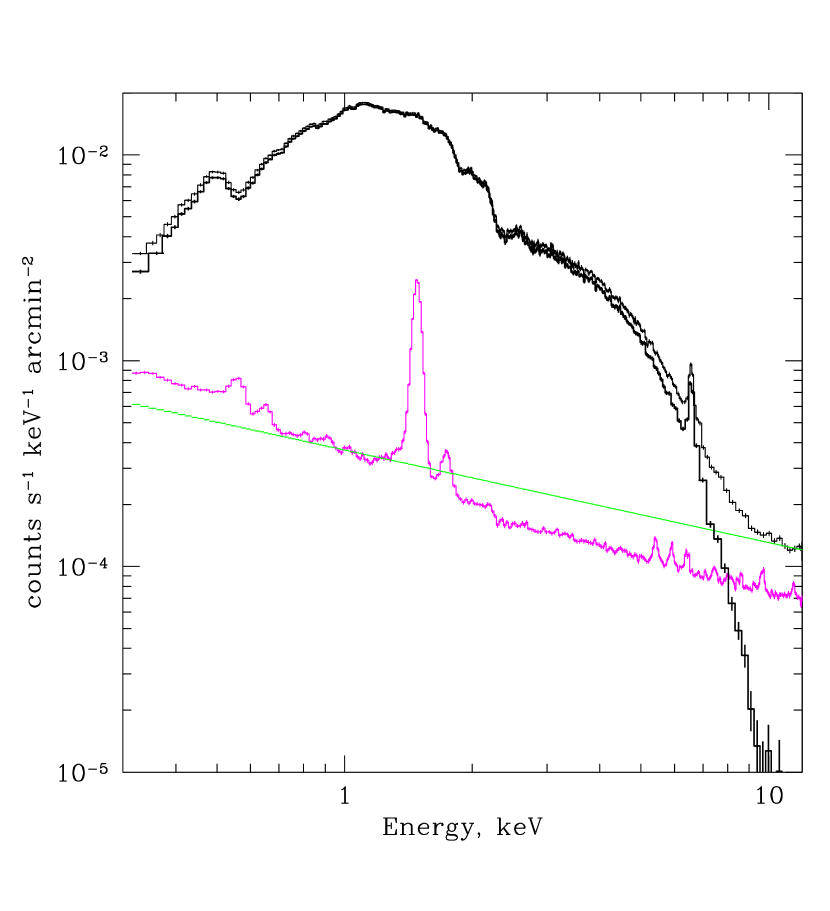
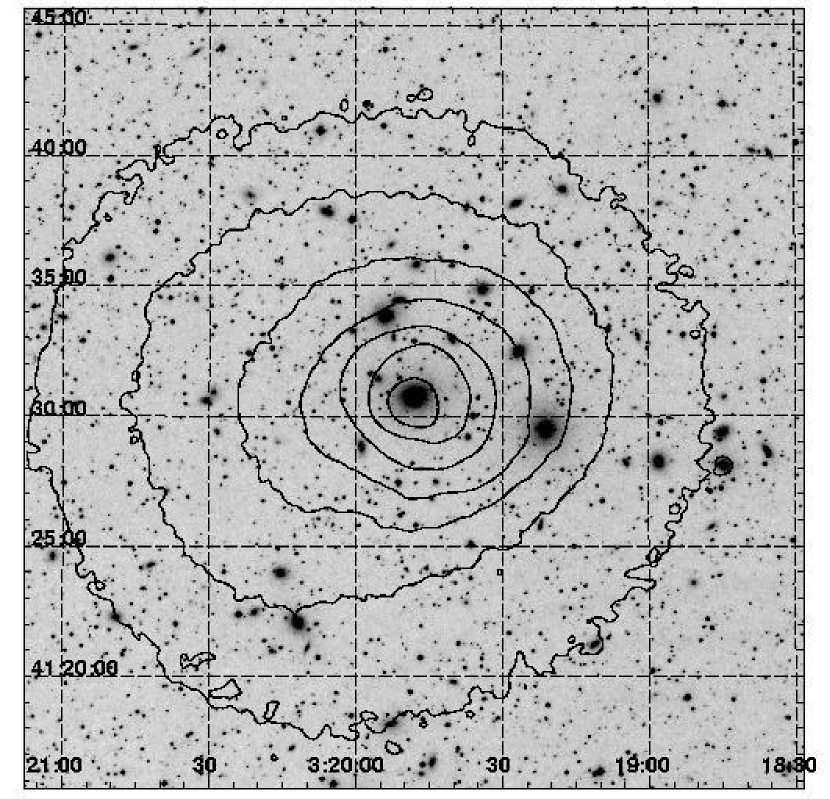
The core of the Perseus cluster was observed with XMM-Newton on 2001, Jan. 30 with a total integration time of 53 ksec (observation ID #00851101). The pointing was centered on NGC 1275 (Fig. 1). We report below on the results obtained with the MOS instrument only. Results from the RGS and PN observations will be reported elsewhere. Calibrated event lists were generated using SAS v5.3. As is known the MOS background has a steady (quiescent) component partly associated with cosmic X–ray background and variable component due to charged particles (e.g. Lumb et al. 2002). To check the level of the variable background component, we used the same tracer as implemented in the SAS task emchain – i.e. the count rate of events with energy deposited in a single pixel higher than a threshold value (“REJECTED_BY_GATTI” – in SAS notation). Although there are no obvious spikes in the light curve of such events, the count rate is several times higher than the recommended threshold value for the entire observation, indicating a significantly enhanced background level. Thus a straightforward application of the recommended cleaning procedure (using emchain default settings) would remove essentially all the data. To use the dataset, we had to adopt special procedures to correct for the variable background component. As a first step, the steady component of the background was subtracted using data from blank field observations, provided by the XMM SOC site (background data files are from 2002, Jan., see Lumb et al. 2002). The spectra of all but the central chip were accumulated for MOS1 and MOS2. Assuming that the variable component of the background has a power law shape (in counts/channel space) with the slope of and using the data in the 11-12 keV range, we calculated the normalization of the variable component. The slope of the variable background spectrum is known to vary from observation to observation and (rather arbitrarily) has been fixed at . We then assumed that the intensity of the variable component per unit area is constant across the detector and corrected all observed spectra for this variable component. The sample source and background spectra for the annulus is shown in Fig. 2. The same procedure applied to the publicly available datasets with the “quiescent” background typically yields a normalization for the additional background component that is at least an order of magnitude lower.
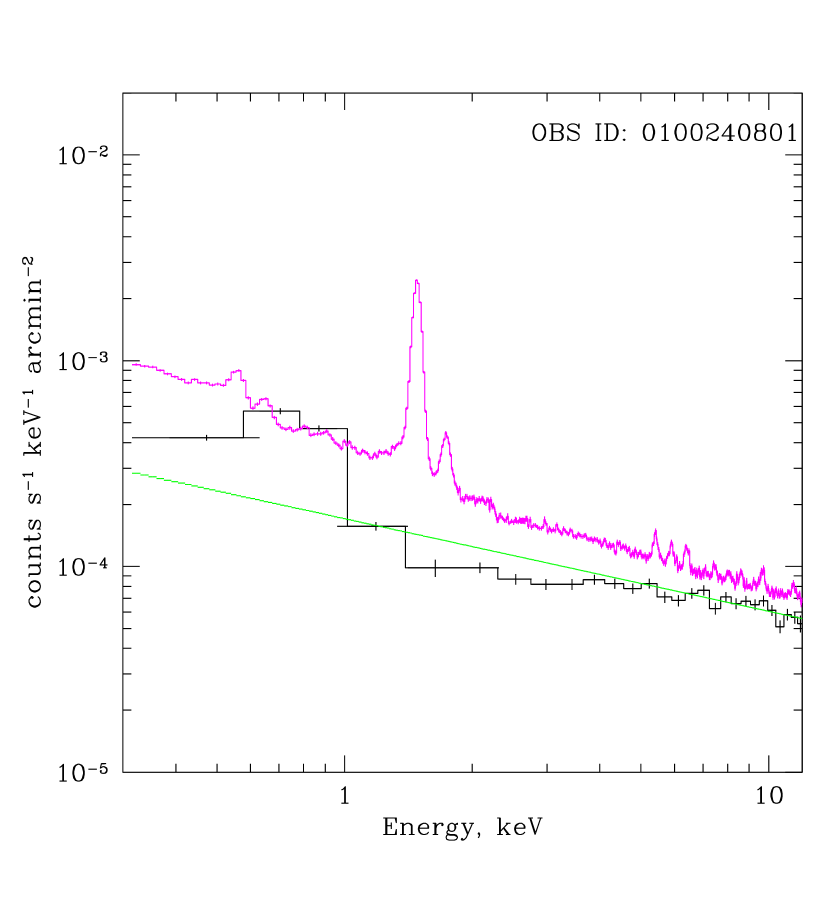
To verify the quality of the background subtraction procedure we used a publicly available 30 ksec observation (OBSID 0100240801) performed 14 hours after the end of the Perseus observation. In this observation the background level was still enchanced compared to the quiescent level, although a factor of 2 lower than in the Perseus observation. There are no strong sources in this field (apart from the target - a compact source) and it is easier to see how well the background is corrected in the regions far from the center of the field of view. For this data set we repeated exactly the same background correction procedure as for the Perseus observation. The results are shown in Fig. 3. One can see that above 4 keV the predicted extra background component matches almost perfectly the accumulated spectrum (corrected for quiescent background). Below 2 keV some residuals are present, but given the brightness of Perseus at these energies (factor 10 to 100 brighter than the background) such residuals have no significant impact on the results of the spectral fits.
The procedure and functions described above are the result of extensive tests with various shapes of the additional background and different methods to determine its normalization. The results reported below were found to be robust to the remaining uncertainties in the background subtraction. Further refinement of the background correction procedure may change slightly some of the numerical values, in particular the maximum gas temperature close to the edge of the field of view by 5-10%, but cannot affect any of the principle results in the paper. More subtle features, like the limits on the possible nonthermal emission components, which are in principle attainable with the required statistics are deferred to future work. For the same reason we report only on the MOS observation, for which we achieved the most robust results.
For the subsequent analysis we used MOS data with patterns in the range 0-12 and the recommended value of the flag (XMM_EA). For the spectral analysis we use one of the MOS response matrixes provided by the XMM SOC (namely “m1_thin1v9q19t5r5_all_15.rsp”) and assume that the same response (corrected for energy dependent vignetting) is applicable for all regions.
3 Analysis

Although the cluster is not perfectly symmetric (see Fig. 1) it is illustrative to derive the radial dependence of major parameters, in particular the density, temperature and heavy element abundance, assuming spherical symmetry with the center at NGC 1275.
The radial dependence of the surface brightness is shown in Fig. 4. The dotted line shows the expected profile (taking into account the PSF of the telescope) for a point source plus constant surface brightness. The central excess (within ) is therefore consistent with being due to the contribution of the unresolved, compact source – the nucleus of NGC 1275.
3.1 Spectrum of NGC 1275

Given the XMM-Newton spatial resolution and complicated surface brightness distribution near the cluster core, the precise determination of the NGC 1275 nuclear spectrum is difficult. We used the central (radius) circle and the – annulus as the source and background regions respectively. The resulting spectrum is shown in Fig. 5. It is fairly well fit with an absorbed () power law with a photon index of 1.65 and a narrow line at an energy of 6.289 keV (with confidence interval from 6.276 to 6.313 keV) and an equivalent width of 165 eV. The assumption that the line is due to fluorescent emission of neutral iron at 6.4 keV implies a redshift of , fully consistent with the optically determined redshift of NGC 1275 . A significant amount of cold gas and dust is known to be associated with the high velocity (HV) system (Minkowski 1957, see also Conselice, Gallagher, & Wyse 2001), but the excellent agreement between the redshifts of the line and the galaxy indicates that reprocessing by the HV gas does not contribute significantly to the observed spectrum. The 6.7 keV line which is dominant in the cluster gas emission is very weak in the nuclear spectrum, suggesting that background has been subtracted with sufficient accuracy. We conclude that the observed spectrum of the nucleus is consistent with typical AGN spectra. The luminosity of the nucleus derived from the best fit parameters is of the order of in the 0.5–8 keV range and is subject to systematic uncertainties (at the level of 20%) due to background subtraction and PSF correction.
3.2 Projected parameters

Spectra were accumulated in a set of annuli centered at NGC 1275. The resulting spectra were fit (in the 0.5–9 keV range) with a single temperature APEC (Smith et al. 2001) model in XSPEC (version 11.2.0; Arnaud 1996) with the gas temperature , abundance of heavy elements (relative to the solar values of Anders and Grevesse 1989) and low energy photoelectric absorption column density as free parameters. The redshift has been fixed at the optically determined value for NGC 1275: (Strauss et al. 1992). The projected radial dependence of all parameters is shown in Fig. 6. The derived value of cm-2 is comparable with (and even somewhat lower than) the galactic hydrogen column density in this direction (Dickey & Lockman 1990). No intrinsic absorption is required by the data and no large variations are observed with radius. However we note that, given the uncertainty in the background subtraction procedure described above, it is possible that we systematically underestimate the absorbing column density. The temperature shows a clear decrease from 7 keV at large radii to 3.7 keV near the center of the cluster, except for the very central region which is contaminated by hard emission from the NGC 1275 nucleus. The abundance of heavy elements shows an opposite trend, decreasing (outside the central region) with distance from the center.
3.3 Asymmetric surface brightness substructure
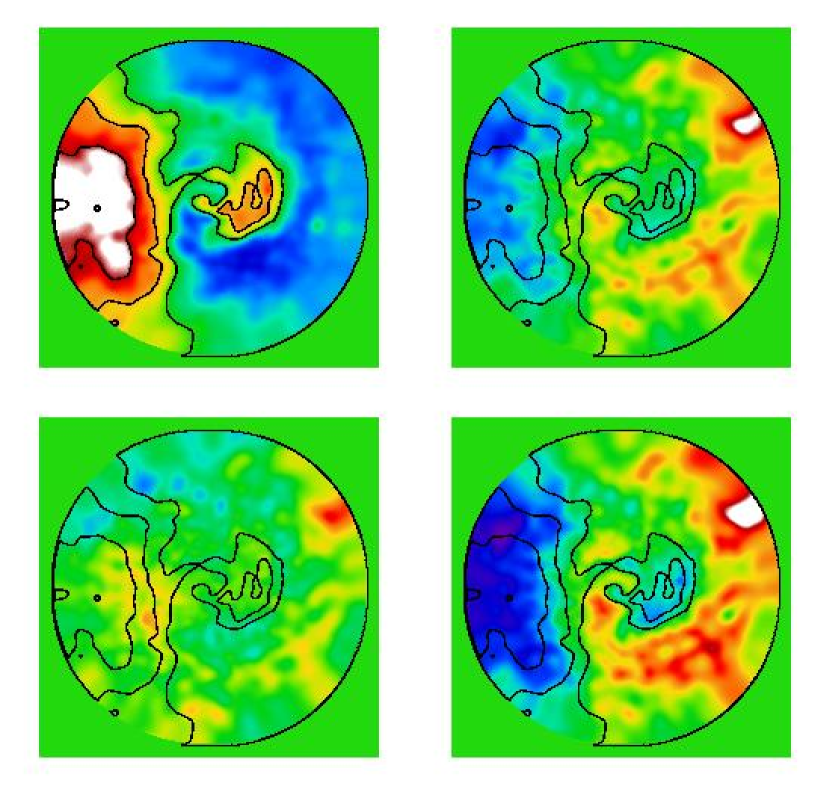
As is clear from Fig. 1 and known from earlier Einstein and ROSAT observations (Branduardi-Raymont et al. 1981), the surface brightness is not symmetric around NGC 1275. In order to further enhance the asymmetric structure, we plot in Fig. 7 the relative deviations of the surface brightness from the azimuthally averaged surface brightness value (i.e. ). The resulting image has been smoothed with a Gaussian. Apart from the complicated structure in the innermost (2′) region probably dominated by the interaction of the thermal gas with the central AGN radio lobes (e.g. Böhringer et al., 1993, Churazov et al. 2000, Fabian et al. 2000, 2002) there are two regions of prominent excess emission on large scales – one 4′-7′ west of the center and one east of the center. The same structures were also clearly seen in earlier ROSAT PSPC and HRI images (e.g. Schwarz et al. 1992). The possible nature of these structures is further discussed in Section 4.
3.4 Deprojection analysis
The above radial dependencies of the gas parameters are affected by projection effects and the azimuthal asymmetry of the cluster. The first problem can be solved using deprojection analysis. Various flavors of deprojection techniques are frequently used (e.g. Fabian et al. 1981, Kriss, Cioffi & Canizares 1983, McLaughlin 1999). In our analysis we assume spherical symmetry but make no specific assumption about the form of the underlying gravitational potential. We first calculate the surface brightness (in a given energy band) in a set of annuli and choose a set of spherical shells. The radii of the annuli and shells need not be the same. The gas parameters are assumed to be uniform inside each shell. The outermost radii of the annuli and shells are chosen so that . The emissivity of the gas for radii larger than is assumed to decline with the radius as a power law with a given slope, namely . The normalization of this extra component is an additional free parameter of the model. One can then write a simple expression which describes the contribution of all shells and outer regions from to infinity to the surface brightness in a given annulus .
| (1) |
where is the emissivity of a given shell. A simple analytical expression for and which are functions of the radii of corresponding shell and annulus can be easily written (e.g. Kriss, Cioffi and Canizares 1983, McLaughlin 1999).
We then formulate a least squares problem – what set of emissivities in our set of shells will provide the best description of the surface brightness recorded in our set of annuli:
| (2) |
where is the statistical error associated with the surface brightness in a given annulus. As usual the differentiation of this relation with respect to and yields a system of linear equations, which can easily be inverted. The properties of the inverse matrix (in particular an error enhancement due to ill-conditioned problem) can be easily controlled by making the spherical shells broader. The emissivities of the shells are then expressed through the observed surface brightness distribution as an explicit linear combination:
| (3) |

We then accumulate a set of spectra (corrected for the background and vignetting) for each annulus. The emission spectrum associated with each shell can then be calculated as the same linear combination of the observed spectra. Since the whole procedure is linear the (statistical) errors can be propagated straightforwardly. The resulting spectra for every shell are fit with standard models in XSPEC. The radial dependence of the electron density, temperature and heavy element abundance is shown in Fig. 8. As usual for any kind of deprojection analysis the errors on the deprojected values of temperature and abundance are significantly larger than for the projected spectra. However the biggest uncertainty in the deprojected parameters probably comes from the assumption of spherical symmetry. As is clear from Section 3.3 the cluster is significantly asymmetric. Furthermore when deriving the density in a given shell we assume that X–ray emitting gas uniformly fills the volume of the shell. Nonetheless we present below two simple analytical approximations to the density and temperature distributions which crudely characterize the radial behavior of these two parameters (shown in Fig. 8 with the solid lines):
| (4) |
where the second term is the density distribution on larger scales taken from Jones & Forman (1999) and shown in Fig. 8 with the dotted line.
| (5) |
The analytical approximations shown in Fig. 8 clearly fail to follow the data in the innermost region (within the central 10 kpc). Given the XMM-Newton angular resolution, the major problem here is the contribution from the bright compact source – the nucleus of NGC 1275. This makes Chandra much more suitable for studies of the innermost region.
Schmidt et al. (2002), using Chandra data and excluding the contribution from the nucleus, showed that within about 50 kpc, the deprojected temperature profile is essentially flat (see their Fig. 7) with a mean of approximately 3.1 keV in excellent agreement with the XMM-Newton temperature values from 10-50 kpc (away from the region in which the nuclear source contributes to the XMM-Newton spectral data). The temperature profile derived from the projected Chandra spectra in finer radial bins (Fig. 2 from Schmidt et al. 2002) does however show a slight increase in temperature in the innermost (10 kpc) bin. It is possible that projection effects (due to the presence of X–ray “holes” in the inner region) increase somewhat the apparent gas temperature there. Therefore, equation 5, with its essentially constant temperature at kpc is a reasonable approximation. A comparison of the azimuthly averaged Chandra surface brightness profile in the inner region with the XMM-Newton data also shows that a gas density profile with a flat core (eq. 4) is a reasonable approximation to the data.
3.5 Projected Temperature Structure
To calculate the projected gas temperature distribution, we employed the method described in Churazov et al. (1996, 1999) and applied previously to the ASCA data (e.g. Donnelly et al. 1998, 2001). Briefly we use template spectra corresponding to emission from an optically thin plasma (convolved with the MOS energy response) with temperatures 3 and 9 keV with a given metallicity and low energy photoelectric absorption and determine the best fit weights of these template spectra needed to describe the spectrum observed in a given pixel of the image, i.e.
| (6) |
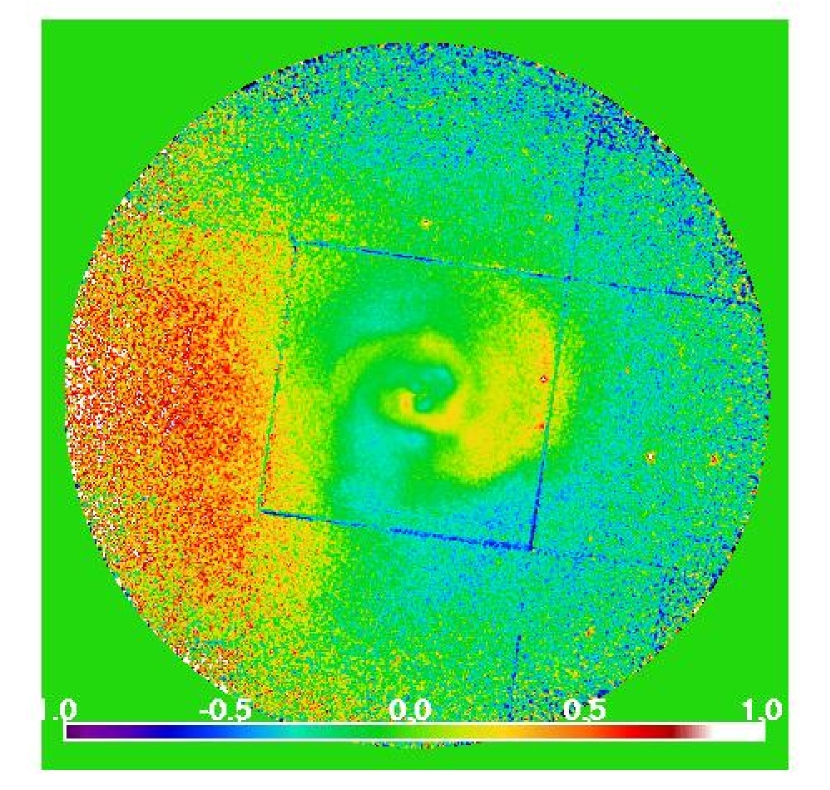
where is the template spectrum for a given value of temperature . The temperature is then calculated as a function of the relative weights of the template spectra. As is shown in Churazov et al. (1996) an expectation value of the temperature calculated this way is usually very close (within a few percent) to the temperature obtained by conventional spectral fitting under the assumption of a single temperature plasma with fixed metallicity and absorption. Compared to hardness ratios, typically used for the same purpose, this method is significantly more sensitive. The determination of weights is a linear procedure (i.e. fast) and further smoothing can be applied after the images containing weights are calculated. The resulting temperature map for Perseus is shown in Fig. 9. An adaptive smoothing has been applied to the map in such a way that each value of the temperature has been calculated using regions containing counts. Comparison with the results of direct spectral fitting of individual regions shows good agreement with the overall temperature structure.
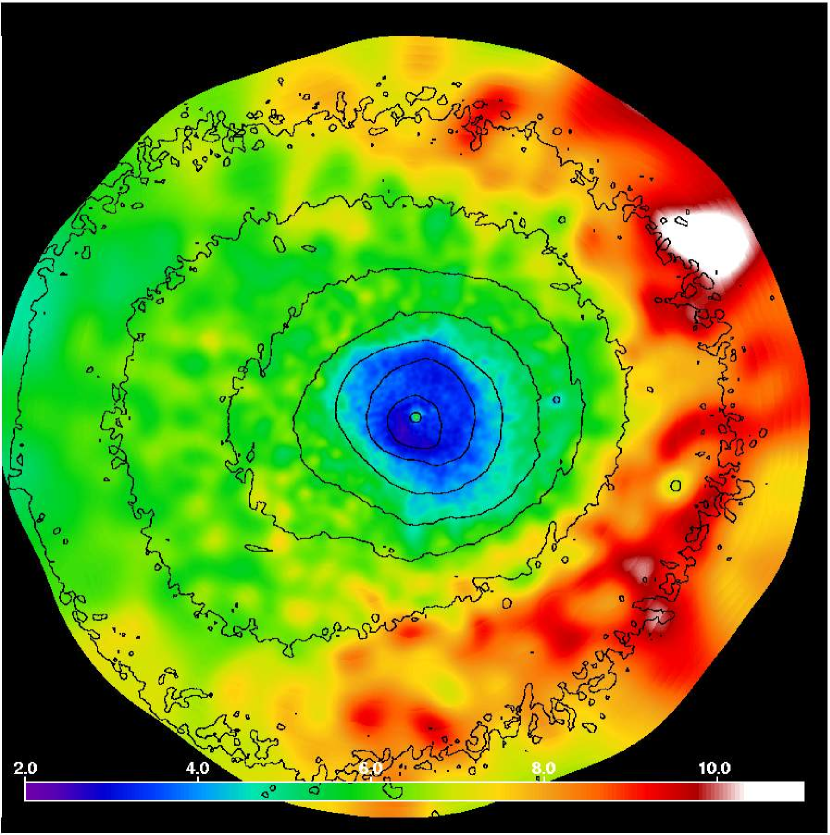
Compared with the previous ASCA temperature maps (Arnaud et al. 1994, Furusho et al. 2001) XMM-Newton data show the innermost region in much greater detail, while the global asymmetry is broadly consistent with the lower resolution ASCA maps, which cover a much larger area. The temperature structure of the very central region (within ) is consistent with the recent Chandra results (Fabian et al. 2000, Schmidt et al. 2002).
On the spatial scales of 1–15 arcminutes, which are particularly well mapped by the XMM-Newton observations, the most remarkable feature of the temperature map is a horseshoe-shaped high temperature region to the West, enveloping the central cooler region. Thus the global east-west asymmetry of the cluster seen in the surface brightness distribution (Fig. 7) is also clearly present in the gas temperature distribution.
If the cluster gas is in a state of a hydrostatic equilibrium then the gas density and temperature should remain constant along the equipotential surfaces set by the gravitating mass. In the example of a spherical or elliptical potential, all features in the observed surface brightness or temperature distribution should reflect the symmetry of the underlying potential. Shocks or strong sound waves (e.g. produced by a merger) may reveal themselves as distinct features in the observed images or temperature maps. The variations of density and temperature in shocks are obviously correlated leading to a positive correlation of the variations in surface brightness images and temperature maps. The observed variations (Fig. 7 and Fig. 9), on the contrary, suggest that in Perseus the variations of the temperature and surface brightness are anticorrelated. One can see that all the most prominent positive features in Fig. 7 correspond to regions of lower (relative to the mean value at the same distance from the center) temperature. To show this more clearly in Fig. 10 we plot side by side the deviations of the surface brightness and temperature from the azimuthally averaged values. The surface brightness image and the temperature map can be further combined in the form of two additional images and . Since the surface brightness scales as the square of the electron density (i.e. ) then and . Therefore these two images and can be used to approximately characterize the azimuthal variations of pressure and entropy111we use the term entropy for the quantity , true specific entropy is determined by the logarithm of this quantity of the gas. These variations are also shown in Fig. 10. It is clear that the relative amplitude of the azimuthal variations in pressure is smaller than that for any of the other quantities shown in Fig. 10 and there is no clear east-west asymmetry in the pressure distribution. This argues against the attribution of the bulk of the observed substructure in the surface brightness distribution and temperature to strong shocks. Instead the observed features clearly resemble edges or “cold fronts” found recently in several clusters (e.g. Markevitch et al. 2000, 2002, Vikhlinin et al. 2001). The possible origin of this substructure is discussed below.
4 Discussion
During the lifetime of any cluster, it experiences a few major mergers with another cluster of comparable mass and much more frequent accretion of smaller clusters or groups. A chain of bright optical galaxies extending to the west from NGC 1275 suggests that at present the Perseus cluster is merging with a subcluster coming from that direction. The effect of a merger on the appearance of the cluster obviously depends strongly on the mass ratios and gas fractions of merging clusters (see recent reviews by Evrard & Gioia 2002, Sarazin 2002, Schindler 2002 and references therein). Given that the deviations from spherical symmetry in the surface brightness and temperature, although clearly present, are not very large then we probably have a case of a merger with a relatively small subcluster or group of galaxies. Furthermore the lack of large azimuthal pressure variations (Fig. 10) suggests that we observe the merger in a progressed stage when strong shocks have already left the central region of the cluster mapped with XMM-Newton. The numerical (N-body and fluid dynamics) simulations of the merger most relevant for the Perseus case are probably those of Gomez et al. (2002). Their merger 7 (see Table 1 from Gomez et al., 2002) has a mass ratio 1:16 and small gas fraction for the subcluster so that the cooling flow is not disrupted during the merger. One can see some features in the gas density and temperature distributions in their simulations (Fig. 5 and 6 in Gomez et al., 2002) which are qualitatively similar to the structures found in the Perseus data.
In Perseus the most striking feature is a clear edge in the surface brightness which separates cooler gas in the very core from the hotter horseshoe-shaped region in the West, enveloping the core. One plausible explanation of these structures is a contact discontinuity separating main cluster gas from the gas of the infalling subcluster. The shape of the contact discontinuity depends primarily on the density profiles of colliding clusters. For two identical clusters involved in a head-on merger the contact discontinuity is a plane perpendicular to the line connecting the centers of two clusters and located half way between the centers. In the case of a merger of a rich cluster with smaller and less dense subcluster the contact discontinuity shifts towards the center of the smaller subcluster and bends due to stronger impact of the ram pressure onto the outer regions of the smaller subcluster, giving the infalling gas a conical shape (see e.g. Fig. 5 in Gomez et al. 2002). The presence of a very dense core in the main cluster may reverse this trend and bend the contact discontinuity in the opposite direction so that it will envelop the very core of the main cluster. This behavior is less obvious in the simulations by Gomez et al. (2002) although flattening of the contact discontinuity is definitely seen. Assuming that merger 7 of Gomez et al. (2002) is a close analog of the Perseus merger, one would conclude that the present state of the Perseus cluster corresponds to a time Gyr after the core crossing when the contact discontinuity is located within 200 kpc of the center of the main cluster (upper right panel of their Fig. 4). After 0.5-0.75 Gyr the dense and cold gas of the main cluster rebounds and shifts the bulk of the subcluster gas to larger distances from the center (middle right panel of their Fig. 4).
An alternative explanation of the edge and horseshoe structures in Perseus assumes that the contact discontinuity is located farther away from the cluster core and the observed structures are solely composed from the disturbed gas of the main cluster. If the chain of bright galaxies marks the ongoing accretion direction of very small groups of galaxies, it is possible that (given the richness of Perseus) in each individual merger event the gas of the infalling subcluster is decelerated far from the Perseus core and never comes close to the center. Such a situation resembles the picture of a piston which initially is moving through the gas but then stops. The gas in the core of the Perseus cluster would then see a compression wave (shock) followed by a rarefaction wave. The gas density and temperature increase during the compression phase, but then decrease as the gas reexpands. There should be only a modest increase in the final gas temperature associated with the increase of the entropy in the shock. The velocity of the gas in the core of the main cluster also first increases and then falls back to zero, with the net effect that every volume element of gas is displaced some distance from its initial position. Since the density, temperature and pressure change significantly across the core (particularly in the direction perpendicular to the direction of the compression wave motion) the impact of the passing compression/rarefaction wave will differ in terms of the increase in temperature and the net displacement. If the characteristic amplitude of the wave propagating through the nonuniform medium scales as the square root of the density then the amplitude of the initial displacement at a distance from the center scales as . Therefore the wave would induce a smaller net displacement in the very core region (where the density is the highest), than in the region farther from the core. Such a process can lead to characteristic “horseshoe” structures in the temperature and density distributions that are qualitatively similar to those observed in the Perseus cluster. However the relative amplitude of the displacement is a decreasing function of radius for density profiles less steep than . Therefore the relative amplitude of the displacement in the very core of the cluster will still be strong. The displaced gas in the core will then try to restore hydrostatic equilibrium and oscillate in the potential.
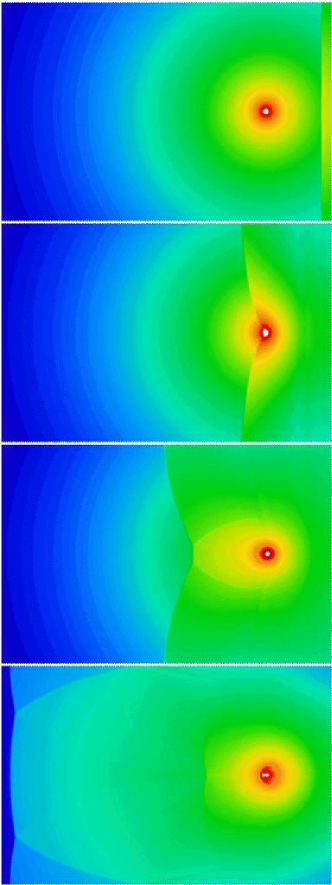
We illustrate the bending of the shock and the induced oscillatory motion of the gas in the core with a simple numerical simulation of a plane compression wave passing through a cluster gas. The simulations were made using the ZEUS-2D code (Stone & Norman 1992a, b). In our simulations we employed an ideal gas equation of state with . Equations 4 and 5 were used for the initial density and temperature distributions. The gravitational potential was calculated from the same density and temperature distributions and assumed to be static. The computational domain spans a Mpc region and is covered by 600 400 grid points. At some distance from the cluster, we modify the gas velocity, density and temperature in a slab 200 kpc wide, to mimic the situation when a piston is first driven into a cluster gas with a Mach number of 2 and then stops. The results shown below were obtained from the simulations on a Cartesian grid, while simulations on the cylindrical grid produce qualitatively very similar results.
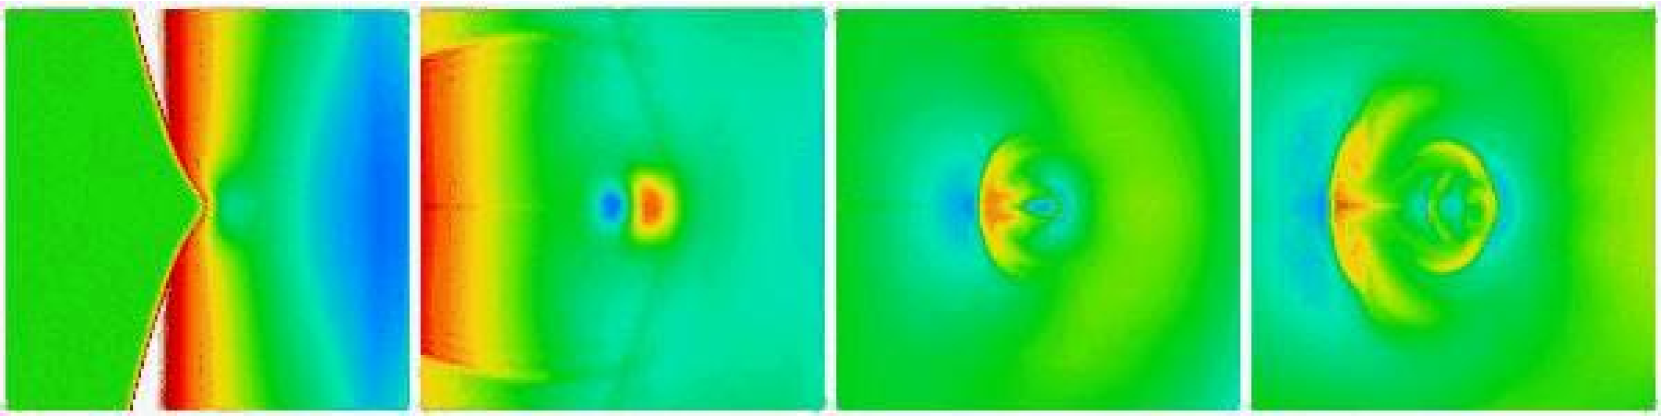
Snapshots of the gas density distribution at several successive moments of time (0, 0.3, 0.7, 1.6 Gyr from the beginning of the simulations) are shown in Fig. 11. Initially the plane shock bends, when passing through the core, because of the higher pressure and lower temperature in the central region. Shortly after the passage of the wave through the core, the gas distribution is clearly elongated in the direction of motion, with the very core regions experiencing smaller displacements than the outer layers. The gas then begins “sloshing” (this term was introduced in Markevitch, Vikhlinin & Mazzotta 2001, see also Markevitch, Vikhlinin & Forman 2002) in the potential well, which in our case is assumed to be static. To show the structure of the density distribution more clearly, we plot the relative deviation of the gas density from the undisturbed value in Fig. 12. The first frame corresponds to the time when the shock front is passing through the core. Although originally the gas is swept in the direction of the wave propagation, in 0.5 Gyr it rebounds and produces excess emission on the opposite side of the core. The relevant time scales for the gas sloshing are probably set by the acoustic cutoff frequency and the buoyancy (Brunt-Väisälä) frequency , which can be written as
| (7) |
| (8) |
where is the gas entropy, is the radius, and is the Keplerian frequency at a given radius. The dependence of the acoustic cutoff and the buoyancy frequencies on radius (using the density and temperature profiles according to equations 4 and 5) are shown in Fig. 13.

While strictly speaking these frequencies are determined by the local properties of the gas (and we are interested in global oscillations), it is likely that they set an approximately correct timescale for the gas sloshing. Since these frequencies vary with radius, the gas will slosh with different periods, with the possibility of forming several asymmetric structures at the same time on either side of the core. This is illustrated in Fig. 12 where the deviation of the gas density from the undisturbed value is shown at several times. The structures seen in the density distribution resemble the cold edges or fronts observed by Chandra in many clusters (e.g. Markevitch et al. 2002). The edges in this simulation are due to sloshing of the cluster core gas and are of course transient events, which however can persist for a few Gyr, although their shapes evolve continuously. As usual for oscillatory motion, the gas spends most of the time near one of the points of maximum displacement – i.e. in the configuration favorable for the detection of the disturbed gas as an “edge”.
From Fig. 13, the shortest period of sloshing is on the order of a Gyr. This means that it takes about a 0.5 Gyr for the gas displaced by the initial shock to rebound to the opposite side of the center of the potential and form an edge there. If this mechanism is responsible for the formation of the edge in the Perseus cluster then we can roughly estimate that the initial shock has passed through the core some 0.5 Gyr before. On such time scales the primary wave has enough time to propagate outside the region mapped with XMM-Newton and the disturbed dense gas in the center has enough time to rebound.
In this interpretation the increase of gas entropy on the western side of the cluster (see Fig.10) can be attributed to the initial shock or sequence of shocks. If the gas in that region was originally on the same adiabat as now observed at the eastern side of the cluster then in a single shock interpretation the increase of entropy by 50% (estimated from Fig.10) would require a shock with a Mach number of 2.6. Assuming that the gravitating mass profile of the Perseus cluster follows the Navarro-Frenk-White profile (Navarro, Frenk & White, 1997) with the parameters obtained by Ettori, De Grandi and Molendi (2002) we can estimate that the free fall velocity reaches a Mach number of 2.6 (for 6.5 keV gas) at a distance of 300 kpc from the cluster center. This is of course an upper limit on the velocity of the contact discontinuity, attainable only if the infalling gas is sufficiently dense. Depending on the geometry of the contact discontinuity the forward shock will have a velocity similar to the velocity of the discontinuity (e.g. bow shock) or slightly higher (for a plane parallel shock). Therefore the observed asymmetry in the entropy distribution is only marginally consistent with the assumption that a single shock was responsible for the entropy increase. Multiple small accretion events from roughly the same direction, which can be expected if there is indeed a large scale filament in the direction set by the chain of bright galaxies could more easily provide the observed rise of the entropy.
The motion of the cD galaxy relative to the larger scale potential of the cluster has long been suspected to play a role in clusters with cool and dense cores (e.g. David et al. 1994, Fabian et al. 2001, Markevitch et al. 2001). Since the distinction between the cD potential and cluster potential may be somewhat artificial, one can think instead in terms of perturbations of the potential in the cluster core. The gas can then start sloshing in the disturbed potential (e.g. Markevitch et al. 2001, 2002). We argue above that pure hydrodynamics may cause similar sloshing. What matters is the displacement of the gas relative to hydrostatic equilibrium, which can be achieved either through disturbances in the gas or the gravitating mass. In real mergers, both mechanisms are probably operating.
Markevitch et al. (2001, 2002) suggested that dissipation of the sloshing kinetic energy may be sufficient to offset radiative gas cooling. Assuming that the asymmetry in the surface brightness distribution in the inner 200 kpc region around NGC 1275 directly characterizes the amount of sloshing energy, one can estimate this energy as 10-20% of the thermal energy of the gas. At a radius of 100 kpc, the cooling time is comparable to the sloshing turn around time ( or ) and at 200 kpc it is several times longer than the sloshing time. Assuming that this energy is dissipated over several sloshing turn around times (and neglecting the fact that part of the energy would be emitted as acoustic waves which escape the region), we conclude that the dissipated energy is not sufficient to offset cooling. However, the magnitudes (for cooling and dissipation) are comparable and one can imagine scenarios where the dissipation of the sloshing kinetic energy plays a more important role. In particular our estimate that the sloshing energy constitutes 10-20% of the thermal energy may be an underestimate.
4.1 The fate of the stripped gas

During the merger process the subcluster gas is stripped from the dark matter potential of the infalling subcluster and mixes with the main cluster gas. As was pointed out by Fabian & Daines (1991), the infalling gas does not necessarily pass through a very strong shock during the merger process and therefore the gas may remain on approximately the same adiabat as before the merger. This means that even stripped and decelerated lumps of subcluster gas may continue to move towards the center of the main cluster if their entropy is low enough. Even neglecting mixing with the main cluster gas, this motion can continue only until the lump reaches the radius in the main cluster where the main cluster gas has the same entropy as the lump. In Fig. 14, we plot the entropy (defined as ) profile of the gas in the Perseus cluster. One can compare the values of the entropy with the characteristic values of the entropy found in clusters and groups (e.g. Ponman, Cannon & Navarro 1999; Lloyd-Davies, Ponman, & Cannon 2000) which exceed 100 keV cm2 even for poor groups. Thus, even if the infalling gas does not pass through a strong shock, which would further increase its entropy, it will find gas with comparable entropy at a distance at least several hundred kpc from the Perseus core. The infalling gas cannot easily penetrate below this radius. Therefore the core of the Perseus cluster is well “protected” against penetration by infalling gas (unless the infalling subcluster itself contains a cool core with low entropy gas).
4.2 Mergers in the absence of a dense (cool) core
The picture discussed above assumes that the main cluster contains a very dense (cool) core, while the infalling subcluster does not. In reality, various combinations of these parameters are possible, leading to a wealth of different appearances for mergers. In particular, if the main cluster lacks a dense (cool) core and the entropy of the infalling gas is significantly lower than that of the main cluster, the infalling gas may penetrate deep into the cluster core. The infalling cooler gas will be progressively stripped (Fabian & Daines 1991) from the dark matter halo and partly mixed with the main cluster gas. Even when stripped, the gas remains overdense compared to the main cluster gas and it will keep moving (although more slowly) towards the bottom of the potential well. This would result in a “cool wedge” penetrating deep inside (or even crossing) the main cluster. This kind of structure is probably observed in A1367 (Forman et al. 2003) and in Coma. Both clusters have very high values for the gas entropy in their cores, so it is relatively easy for infalling gas to penetrate the core. Thus the cores in such clusters may appear much more disturbed than the cores of the “cooling flow” clusters, even if the infalling subclusters have similar parameters.
Thus if the main cluster does not have a dense and cool core, the gas from smaller infalling subclusters may penetrate deep into the cluster and mix with the main cluster gas. One can therefore expect the abundance of heavy elements to be more or less uniform throughout the cluster. However when the main cluster has a dense cool core, the infalling gas is stopped before reaching the core and only small lumps from any cool cores in the infalling groups themselves are “allowed” to penetrate deeper. These infalling cool lumps are generally centered on a bright galaxy and are presumably also enriched in metals compared to the bulk of the subcluster gas which is stopped at larger distances from the center of the main cluster. Therefore this process may serve to maintain (or even enhance) the radial abundance gradients observed in many clusters with cool cores.
5 Conclusions
We present the first results of the 50 ksec XMM-Newton observations of the Perseus cluster. The surface brightness and the gas temperature maps show a wealth of substructure on all spatial scales.
The inner region () is clearly disturbed by the interaction of the outflow of relativistic plasma from NGC 1275 with the thermal gas. On larger scales the horseshoe structure of the gas temperature and the surface brightness structure suggest an ongoing merger along the direction defined by a chain of bright (optical) galaxies. The gas from the infalling subcluster may be stripped from the dark matter halo at a large distance from the core of the Perseus cluster, with only compression/rarefaction waves passing through the core of the main cluster. These waves may induce “sloshing” in the gas in the cluster core. As a result an “edge” (or even several edges) in the surface brightness and in the gas temperature distribution may appear.
Similar structures may be present in other clusters with peaked (cool) cores which are presently accreting smaller subclusters (e.g. Centaurus cluster). For clusters without a cool dense core, the situation may be different since the subcluster gas is cool and can penetrate deep inside the core of the main cluster and form a cool wedge of partially stripped and mixed gas (e.g. Coma, A1367).
References
- Arnaud (1996) Arnaud K.A. 1996, Astronomical Data Analysis Software and Systems V, eds. Jacoby G. and Barnes J., p17, ASP Conf. Series volume 101.
- (2) Anders, E. & Grevesse, N. 1989, GeCoA, 53, 197
- (3) Arnaud, K. et al. 1994, ApJL, 436, L67
- (4) Böhringer, H., Voges, W., Fabian, A. C., Edge, A. C., & Neumann, D. M. 1993, MNRAS, 264 L25
- (5) Branduardi-Raymont, G. Fabricant, D., Feigelson, E., Gorenstein, P., Grindlay, J., Soltan, A. & Zamorani, G. 1981, ApJ, 248, 55
- (6) Churazov, E., Gilfanov, M., Forman, W. & Jones, C. 1996, ApJ, 471, 673
- (7) Churazov, E., Gilfanov, M., Forman, W. & Jones, C. 1999, ApJ, 520, 105
- (8) Churazov, E., Forman, W., Jones, C. & Böhringer, H. 2000, A&A, 356, 788
- Conselice, Gallagher, & Wyse (2001) Conselice, C. J., Gallagher, J. S., & Wyse, R. F. G. 2001, AJ, 122, 2281
- David (1994) David, L., Jones, C., Forman, W., & Daines, S. 1994 ApJ 428, 544.
- (11) Dickey, J. & Lockman, F. 1990, ARA&A, 28, 215
- (12) Donnelly, H. Markevitch, M., Forman, W., Jones, C., David, L., Churazov, E. & Gilfanov, M. 1998, ApJ, 500, 138
- (13) Donnelly, H., Forman, W., Jones, C., Quintana, H., Ramirez, A., Churazov, E. & Gilfanov, M. 2001, ApJ, 562, 254
- (14) Ettori, S., Fabian, A., & White, D. 1998, MNRAS, 300, 837
- Ettori, De Grandi, & Molendi (2002) Ettori, S., De Grandi, S., & Molendi, S. 2002, A&A, 391, 841
- Evrard & Gioia (2002) Evrard, A. E. & Gioia, I. M. 2002, ASSL Vol. 272: Merging Processes in Galaxy Clusters, 253, eds. Feretti, L., Gioia, I.M., Giovannini, G., Kluwer Academic Publishers, Dordrecht
- (17) Fabian, A., Zarnecki, J., Culhane, L. & Hawkins, F. 1974, ApJL, 189, L59
- (18) Fabian, A. & Daines, S. 1991, MNRAS, 252, P17
- (19) Fabian, A., Hy, E., Cowie, L. & Grindlay, J. 1981, ApJ, 248, 47
- (20) Fabian, A. Sanders, J., Ettori, S., Taylor, G., Allen, S., Crawford, C., Iwasawa, K., Johnstone, R. & Ogle, P. 2000, MNRAS, 318, L65
- Fabian et al. (2001) Fabian, A. C., Sanders, J. S., Ettori, S., Taylor, G. B., Allen, S. W., Crawford, C. S., Iwasawa, K., & Johnstone, R. M. 2001, MNRAS, 321, L33
- Fabian et al. (2002) Fabian, A. C., Celotti, A., Blundell, K. M., Kassim, N. E., & Perley, R. A. 2002, MNRAS, 331, 369
- (23) Forman, W., Kellogg, E., Gursky, H., Tananbaum, H. & Giacconi, R. 1972, ApJ 178, 309
- (24) Forman et al. 2003, in preparation
- Furusho et al. (2001) Furusho, T., Yamasaki, N. Y., Ohashi, T., Shibata, R., & Ezawa, H. 2001, ApJ, 561, L165
- Gómez, Loken, Roettiger, & Burns (2002) Gómez, P. L., Loken, C., Roettiger, K., & Burns, J. O. 2002, ApJ, 569, 122
- (27) Gorenstein, P., Fabricant, D.,Topka, K. & Harnden, F. R. 1974, ApJ, 224, 718
- (28) Jones, C. & Forman, W. 1999, ApJ, 511, 65
- (29) Kriss, G., Cioffi, D., & Canizares, C. 1983, ApJ, 272, 439
- (30) Lloyd-Davies, E., Ponman, T. & Cannon, D. 2000, MNRAS, 315, 689
- (31) Lumb, D., Warwick, R., Page, M. & De Luca, A. 2002, A&A, 389, 93
- (32) Malina, R., Bowyer, C., Lea, S. & Lampton 1978, ApJ, 219, 795
- Markevitch et al. (2000) Markevitch, M. et al. 2000, ApJ, 541, 542
- (34) Markevitch, M. Vikhlinin, A. & Mazzotta, P. 2001, ApJL, 562, L153
- (35) Markevitch, M., Vikhlinin, A. & Forman, W. 2002, Invited review at “Matter and Energy in Clusters of Galaxies”, Taiwan, 2002 April 23-27, astro-ph/0208208
- McLaughlin (1999) McLaughlin, D. E. 1999, AJ, 117, 2398
- (37) McNamara, B., O’Connell, R. & Sarazin, C. 1996, AJ, 112, 91
- Minkowski (1957) Minkowski, R. 1957, IAU Symposium No. 4,, p. 107, ed. van der Hulst, H.C., Cambridge University Press, Cambridge
- Navarro, Frenk, & White (1997) Navarro, J. F., Frenk, C. S., & White, S. D. M. 1997, ApJ, 490, 493
- (40) Pedlar, A., Ghataure, H., Davies, R., Harrison, B., Perley, R., Crane, P. & Unger, S. 1990, MNRAS, 246, 477
- (41) Ponman, T., Cannon, D., & Navarro, J. 1999, Nature, 397, 135
- Sarazin (2002) Sarazin, C. 2002, ASSL Vol. 272: Merging Processes in Galaxy Clusters, 1, eds. Feretti, L., Gioia, I.M., Giovannini, G., Kluwer Academic Publishers, Dordrecht
- Schindler (2002) Schindler, S. 2002, ASSL Vol. 272: Merging Processes in Galaxy Clusters, 229, eds. Feretti, L., Gioia, I.M., Giovannini, G., Kluwer Academic Publishers, Dordrecht
- (44) Schmidt, R., Fabian, A. & Sanders, J. 2002, MNRAS in press (astro-ph/0207290)
- (45) Schwarz, R., Edge, A., Voges, W., Böhringer, H., Ebeling, H. & Briel, U. 1992, A&A, 256, L11
- (46) Sijbring, D. 1993, Ph.D., Groningen Univ.
- Smith, Brickhouse, Liedahl, & Raymond (2001) Smith, R. K., Brickhouse, N. S., Liedahl, D. A., & Raymond, J. C. 2001, ApJ, 556, L91
- (48) Stone, J. & Norman, M. 1992a, ApJS, 80,753
- (49) Stone, J. & Norman, M. 1992b, ApJS, 80,791
- Strauss et al. (1992) Strauss, M. A., Huchra, J. P., Davis, M., Yahil, A., Fisher, K. B., & Tonry, J. 1992, ApJS, 83, 29
- (51) Wolff, R., Helava, H., Kifane, T. & Weisskopf, M. 1974, ApJL, 193, L53
- Vikhlinin, Markevitch, & Murray (2001) Vikhlinin, A., Markevitch, M., & Murray, S. S. 2001, ApJ, 551, 160