Potential of the Surface Brightness Fluctuation method to measure distances to dwarf ellipticals in nearby clusters
Abstract
The potential of the Surface Brightness Fluctuation (SBF) method to determine distances to dwarf ellipticals in nearby clusters is investigated. We find that for the Fornax cluster, the SBF method yields reliable results down to very faint magnitudes, in our case down to mag when observing for about 1 hour at good seeing with an 8m-class telescope in the -filter. Comparison between real and simulated data for the Centaurus Cluster shows that our simulations do not overestimate the achievable S/N of the SBF method.
keywords:
galaxies: dwarf – galaxies: distances – techniques: photometricguessConjecture {article} {opening}
1 Introduction
In this contribution, we investigate the potential of the surface brightness
fluctuation (SBF) method (Tonry & Schneider [1988]) to unambigously determine cluster membership of large
samples of dwarf ellipticals (dEs) in nearby clusters. The SBF method exploits
the fact that on a
galaxy image each seeing disc contains a finite number of stars. This
number is quadratically proportional to distance and thus its relative rms
(causing the SBF) is inversely proportional to distance.
In the context of the SBF method, the distance modulus of a galaxy is given by the difference between apparent and absolute fluctuation magnitude
. is measured directly, while is derived from a distance independent observable, mostly colour.
Tonry et al. [1997] have determined a well defined relation between and for nearby giant early type galaxies in the range :
| (1) |
Regarding dwarf galaxies, the SBF method has only been applied to small samples of nearby dEs (e.g. Jerjen et al. [2001]). With the arrival of wide field imagers on large telescopes, the use of SBF to measure distances to large sets of dEs in nearby clusters will be possible.
2 Simulating and measuring SBF of dEs at the Fornax cluster distance
The simulations were performed by adding artificial galaxy images with implemented SBF signal onto a background field image obtained with VLT and FORS1 in the I-filter. The exposure time was 3000 sec, the seeing 0.5′′, and the pixel scale 0.2′′/pixel. The completeness limit for point sources was I mag. The colour range investigated was mag. was derived from Tonry et al.’s [1997] equation (1) and for from Worthey’s [1994] stellar evolutionary models for old and intermediate age stellar populations. A distance modulus of 31.4 mag to Fornax (Ferrarese et al [2000]) was adopted. The magnitude-surface brightness relation was chosen to fit the relation observed for Fornax dEs by Hilker et al. [2003]. An exponential intensity profile was adopted.
To measure the SBF, first an elliptical model of the galaxy light was subtracted from the image. The resulting image was divided by the square root of the model. On this image, contaminating point and extended sources were masked out. The contribution of contaminating sources below the detection limit was negligible.
Of the cleaned image, the power spectrum (PS) was calculated and azimuthally averaged. The result can be written in the form:
| (2) |
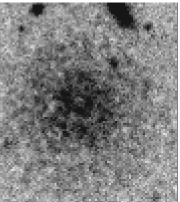
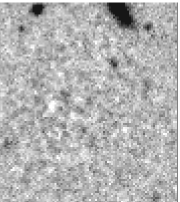
is the PS of the seeing profile. is the amplitude of the SBF, given in ADU. is the white noise component. Fig. 1 shows an example image and power spectrum for a simulated galaxy.

3 Results of the simulations
Fig. 2 summarizes the results of the SBF measurements on the simulated dEs. For mag, about 50% of the measured galaxies have SBF with S/N and smaller than 0.5 mag. As nearby clusters such as Fornax or Virgo are isolated from background galaxies by several magnitudes in distance modulus, the SBF method therefore allows for unambigous cluster membership determination even for low S/N SBF data.

3.1 Simulations vs. Reality
To demonstrate that our simulations do not overestimate the S/N of the SBF measurement on real galaxies, we compared SBF measurements for Centaurus Cluster galaxies, obtained from VLT-FORS1 images in the I-filter, with simulations tuned to reproduce the measured values for these galaxies. As one can see in Fig. 3, the S/N of the simulations matches well the S/N of real galaxy measurements.

4 Conclusions
It has been shown that for nearby clusters such as the Fornax cluster, the SBF Method can yield reliable membership determination for dEs down to very faint magnitudes. We find that our simulations do not overestimate the achievable S/N, but are in good agreement with real measurements. An ideal application of the SBF method would be a deep wide field survey of nearby clusters such as Fornax or Virgo.
References
- [2000] Ferrarese, L., Ford, H. C., Huchra, J., 2000, ApJS 128, 431
- [2003] Hilker, M., Mieske, S., Infante, L., A&AL, accepted
- [2001] Jerjen, H., Rekola, R., Takalo, L., Coleman, M., Valtonen, M., 2001, A&A 380, 90
- [1988] Tonry, J.L., Schneider, D.P. 1988, AJ 96, 807
- [1997] Tonry, J.L., Blakeslee, J.P., Ajhar, E.A., Dressler, A. 1997, ApJ 475, 399
- [1994] Worthey G., 1994, ApJS 95, 107