Testing the circumstellar disk hypothesis: A search for H2 outflow signatures from massive YSOs with linearly distributed methanol masers
Abstract
The results of a survey searching for outflows using near-infrared imaging is presented. Targets were chosen from a compiled list of massive young stellar objects (YSOs) associated with methanol masers in linear distributions. Presently, it is a widely held belief that these methanol masers are found in (and delineate) circumstellar accretion disks around massive stars. If this scenario is correct, one way to test the disk hypothesis is to search for outflows perpendicular to the methanol maser distributions. The main objective of the survey was to obtain wide-field near-infrared images of the sites of linearly distributed methanol masers using a narrow-band 2.12 filter. This filter is centered on the H2 =1–0 S(1) line; a shock diagnostic that has been shown to successfully trace CO outflows from young stellar objects. Twenty-eight sources in total were imaged of which eighteen sources display H2 emission. Of these, only two sources showed emission found to be dominantly perpendicular to the methanol maser distribution. Surprisingly, the H2 emission in these fields is not distributed randomly, but instead the majority of sources are found to have H2 emission dominantly parallel to their distribution of methanol masers. These results seriously question the hypothesis that methanol masers exist in circumstellar disks. The possibility that linearly distributed methanol masers are instead directly associated with outflows is discussed.
keywords:
circumstellar matter – infrared: stars – stars:formation – masers – ISM: molecules – ISM: lines and bands1 Introduction
Our understanding of star formation, despite decades of research, is still quite limited. While the prescription for low mass star formation is based on the ideas of creation via accretion (Shu, Adams & Lizano 1987), it is unknown if massive stars form in this way. There are problems when applying the standard model of accretion to the highest mass stars – most notably the effects of radiation pressure which may inhibit any further accretion once the star has accreted 10 M☉. Since stars more massive than 10 M☉ do exist, and since they tend to form in the middle of dense clusters, the idea of massive stars forming through a process of coalescence of low mass stars or protostars has been proposed (Bonnell, Bate & Zinnecker 1998). However, recent modelling by McKee & Tan (2002) has shown that despite all the alleged problems, the highest mass stars can indeed be formed theoretically via accretion alone.
If massive stars do form via accretion, then at the least, in the earliest stages of development they too must have accretion disks. So one way of proving or disproving that massive stars form via accretion would be to try to directly image these accretion disks around the most massive B and O type stars. Despite many attempts at several different wavelengths, there exists today no directly imaged accretion disk confirmed to exist around a star of spectral type B2 or earlier. There are two main reasons why it is more difficult to observe these accretion disks around massive stars in comparison to low mass stars. First, regions of massive star formation lie at distances of typically a few to 10 kpc away. This is much more distant than regions of low mass star formation which are on the order of 100s of parsecs away. Second, the earliest stages of massive star formation are difficult to observe. Massive stars form so quickly that they are still accreting when they enter the ZAMS and are therefore enshrouded in their placental cloud. The extinction towards a still-accreting massive star is so high that no ultraviolet or optical light from the young star will make it to the observer, and even near-infrared photons (1-2 ) are typically believed to suffer this extinction. Furthermore, because these regions are so distant, resolution has been a problem in the mid- and far-infrared. Interferometry in the millimeter and radio can achieve the necessary resolution, but these wavelengths are not best suited for observing thermal dust emission from accretion disks due to possible contamination by free-free radiation. The final alternative is the submillimeter, which can probe the cool thermal emission from a dust disk with minimal contamination. But we are still 5-10 years away from the submillimeter interferometric arrays that are necessary for achieving the resolution needed to resolve these disks.
We may be extremely limited when trying to observe these disks in their thermal emission, however there is a non-thermal phenomenon that is thought to trace these disks. Methanol masers tend to be distributed in the sky in linear structures, and often with velocity gradients along the masers which may indicate rotation (Norris et al. 1993). They are also believed to be signposts for massive star formation. There is a growing belief that these linearly distributed methanol masers exist in, and delineate, circumstellar disks around massive stars.
But do methanol masers really trace disks? More proof is needed than a line of masers displaying (perhaps) a rotating motion. Since several of these linear distributions of methanol masers are of the order of 05 – 15 in size, and if they are indeed residing in disks, then perhaps one could in fact directly observe them. In the mid-infrared, resolutions of 06 on a 4-m class telescope and 025 on a 10-m class telescope are achievable. However, despite attempts to directly image these disks in the mid-infrared, results have been inconclusive. The survey of De Buizer, Pina & Telesco (2000) included ten sources of linearly distributed methanol masers, but only three had mid-infrared emission that was resolved using a 4-m telescope. All three resolved sources were elongated in their thermal dust emission at the same position angles as their methanol maser distributions. They argued, based on several pieces of observational evidence, that their results were consistent with the circumstellar disk hypothesis for methanol masers.
One of these three elongated mid-infrared sources was observed on a 3.6-m telescope by Stecklum & Kaufl (1998). They also argued that the elongated source that they observed in the mid-infrared was a circumstellar disk around a high mass star. However, follow-up observations by De Buizer et al. (2002a) using the Keck 10-m, discovered that this elongated “disk” was in reality three aligned mid-infrared sources. Consequently, direct detection of these disks is still a problem in the mid-infrared from the standpoint of resolution. Furthermore, it has been argued that in the mid-infrared it is difficult to tell if you are observing dust emission from a circumstellar accretion disk or dust emission from the placental envelope (Vinković et al. 2000). Corroborative evidence that linearly distributed methanol masers exist in circumstellar disks, therefore, needs to come from something other than direct detection of the accretion disks.
Fortunately, there is an indirect way of testing whether or not linearly distributed methanol masers exist in accretion disks. According to the standard model of accretion, during the phase of stellar formation where the star is being fed by an accretion disk, it is also undergoing mass loss through a bipolar outflow. This bipolar outflow is perpendicular to the plane of the accretion disk, and along the axis of rotation. Therefore, one can search these sources of linearly distributed methanol masers for evidence of outflow perpendicular to the methanol maser position angle. Such evidence would create an extremely solid case for the hypothesis that these methanol masers exist in circumstellar disks, without the need for their direct detection. Also, if collimated outflows are found to be a general property of young massive stars, this would be clear observational support for the idea that massive stars, like low mass stars, do indeed form via accretion.
In this vein, a survey of these sources of linearly distributed methanol masers was undertaken to search for signs of outflow. The main objective of the survey was to image each site in the near-infrared with a narrowband 2.12 filter, which is centered on the H2 =1–0 S(1) line. H2 can be excited by collisions in shocks (i.e. McKee, Chernoff & Hollenbach 1982), and specifically shocks associated with outflows from young stellar sources. Davis & Eislöffel (1995) convincingly showed that H2 emission traces shocks in CO outflows from low-mass YSOs. However, the excitation of H2 emission can be due to another process, namely radiative excitation by UV photons (i.e. Burton 1992). By looking at the morphology of the H2 emission one can, in principal, differentiate between what is most likely H2 emission excited by UV fluorescence and what is likely H2 excited by shocks. Since massive stars generally produce copious UV photons, thus forming ultracompact HII (UC HII) regions, one would expect radiatively excited H2 to be present in the very near stellar environment of massive stars. On the other hand, H2 emission from shocks in outflows is expected to exist in knots or regions offset from the central stellar engine. Therefore, by imaging these regions in the near-infrared one can look for structures associated with hydrogen emission emanating from the locations of the methanol masers. Near-infrared observations of H2 have become a standard technique for observing molecular outflows, and it is a suitable initial step in testing the circumstellar disk hypothesis of methanol masers through outflow observations.
2 Observations and Data Reduction
The target list consisted of 28 maser sites compiled mostly from the articles by Walsh et al. (1998), Phillips et al. (1998), and Norris et al. (1998). The coordinates for all of these sites are shown in the Table 1. These sites all contain sources of linear methanol maser distributions, many with velocity gradients along their distributions indicative of rotation, and therefore represent the best circumstellar disk candidates.
Observations of all sources were made in 2002 June on the CTIO Blanco 4-m telescope in Chile using OSIRIS, the Ohio State InfraRed Imager/Spectrometer. OSIRIS operates at wavelengths from 0.9 to 2.4 and uses a 10241024 HAWAII HgCdTe array supplied by CTIO. All observations were taken using the f/2.8 imaging mode, yielding a pixel scale of 0403 pixel-1, for a field of view of 233. Each source was observed through 2 filters: the narrowband H2 (=2.12 , =0.027 ) filter centered on the =1–0 S(1) line of H2, and the narrowband =2.14 (=0.021 ) continuum-only filter.
Observations were performed by using a 9 element dither pattern with 20 offsets. This pattern was performed three times for each source. First time through the pattern, the H2 filter was used with an exposure time of 20 seconds in each of the 9 positions, and the pattern was repeated once more with the same filter and exposure time. The third time through the pattern, the filter was changed to the 2.14 continuum filter and an exposure time of 20 seconds was again used in each element of the pattern.
The 9 images from each element in the dither pattern were then stacked and median averaged to produce a sky frame where the source and background stars were completely removed. Approximately half the sources observed were in rather crowded areas of the Galactic plane or in areas of extended near-infrared emission. In a few cases, extended emission was seen in the preliminary reductions at the telescope, and the telescope was slewed 6 north, and a 9 element dither pattern was done on a less-crowded but nearby piece of sky in both filters. In all other cases, frames from the source observed just before or after were used in conjunction with the 9 images for the source at hand. Once medianed, the sky frames were very clean. In this manner a clean sky frame for both the H2 and continuum filter were produced. These sky frames were then subtracted from each image of the 9 element dither pattern, and then the 9 sky-subtracted images were registered and aligned to produce the final mosaicked image. The alignment of each element was done with a chi-square algorithm to ensure accurate registration.
For each source this process yielded two H2 images, and one continuum image, all with exposure times that are effectively 3 minutes, except on the edges of the images where there was less overlap of the dither frames, and correspondingly a shorter effective exposure time. However, the edges of these images were far enough away from the central source and were cropped so that only the central portions of the images (where the collective exposure times are 3 minutes) were used. Any of these images found not to have a zero mean background or a gradient in the background had this residual sky emission subtracted off by use of an algorithm that subtracts off a two-dimensional polynomial surface of second order in x and y. Bright stars were found in one of the H2 images and the brightness of these sources were determined using aperture photometry. These same stars were found on the continuum image and again their brightnesses were found. Using the ratio in brightness between the H2 and continuum sources, the images were then normalized so that these bright continuum-only stars on the frame were the same brightness in both the H2 and continuum image. The continuum image was then shifted to match the positioning of the stars on the H2 image, again using a chi-square technique. The continuum image was then subtracted from the H2 image. This continuum subtraction technique was repeated for the other H2 image, and then the two continuum subtracted H2 frames were stacked. This final image was then examined for H2-only emission. In most cases, once the continuum and H2 images were normalized and placed side-by-side, it was easy to differentiate between H2-only or H2-dominated sources and continuum-only sources on the frames.
These final images were then compared to fields from the Digitized Sky Survey (DSS) provided by the Space Science Telescope Institute (STScI). Astrometric calibration of each field was found in this way, and the accuracy of the DSS coordinates was checked by identifying Tycho-2 Catalog stars in the fields. Once the images were in an absolute coordinate system, the position of the methanol masers (known to an absolute astrometric accuracy of 1) were identified. Taking into account the fact that the pixel size is 17 for the DSS STScI images, and the effects of seeing and PSF size, the overall accuracy of this method of astrometry is estimated to be accurate to 30. The error on the position given by the DSS STScI images could be of the order of 4 on the plate edges, but this large of an offset was never found in the comparisons with the Tycho-2 sources on the fields.
No attempts were made to accurately flux calibrate the images in either filter. One or two standard stars were observed throughout the course of each night so a rough estimate of fluxes could be determined if necessary. The main objective of this program was to see if there is any H2-only emission emanating from these sources and if they are preferentially found to be collimated and perpendicular to the methanol maser distributions. Therefore no source fluxes will be included in the results presented here.
3 Results
Of the 28 maser targets observed, H2 emission was detected from 18 sites (64%). The distribution of the H2 emission from these sites takes on three forms: 1) extended diffuse areas of H2-dominated emission; 2) individual knots or blobs of H2-only emission that range in number, sometimes cometary-shaped; and 3) some combination of extended H2-dominated emission with knots of H2-only sources.
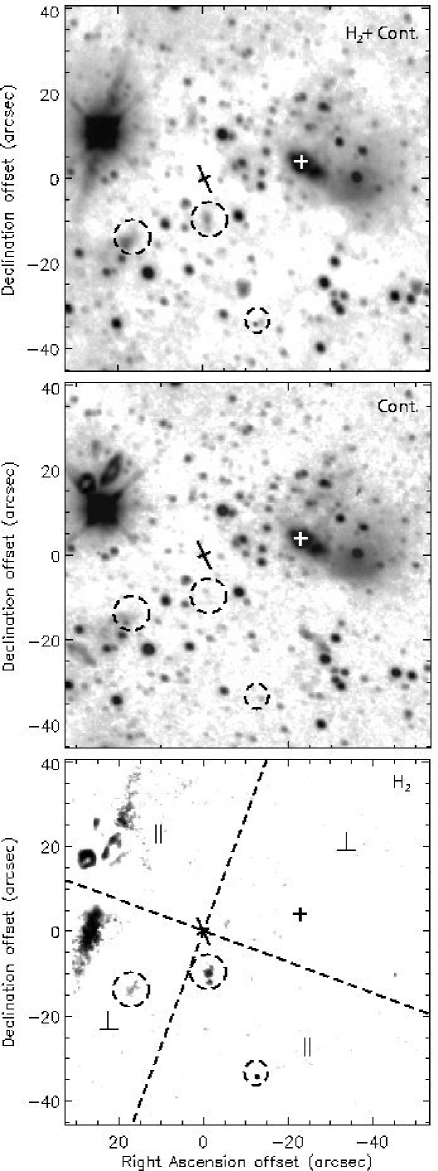
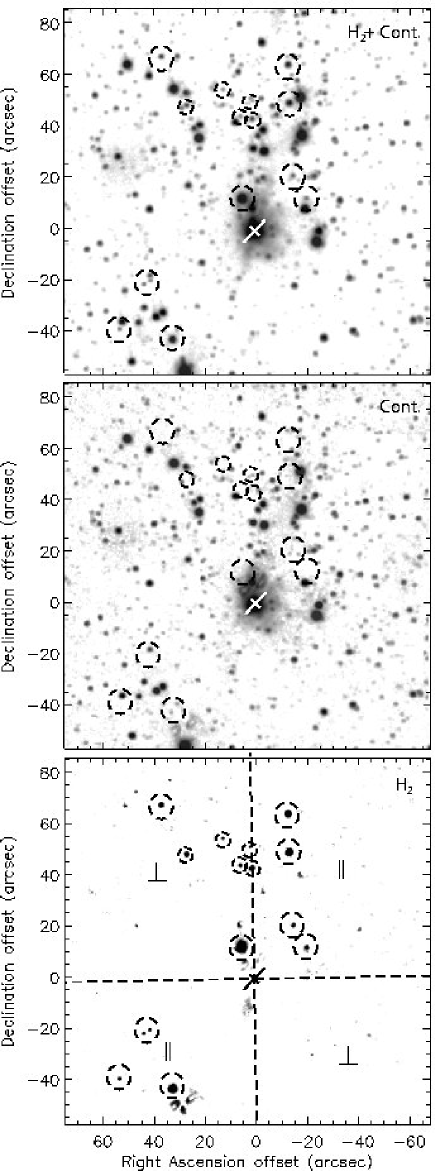
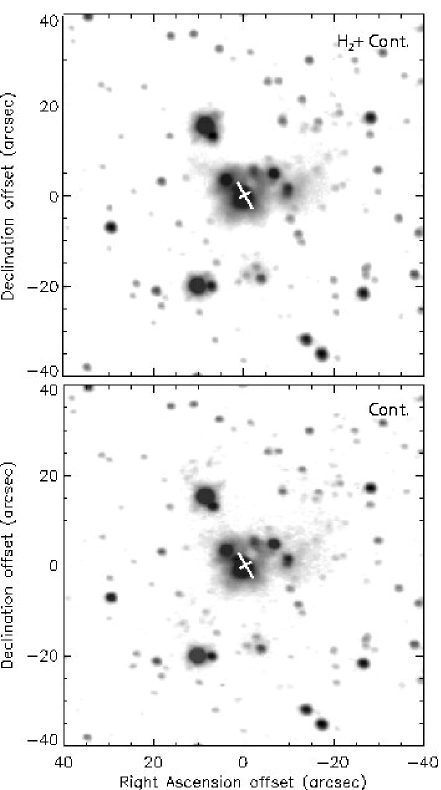
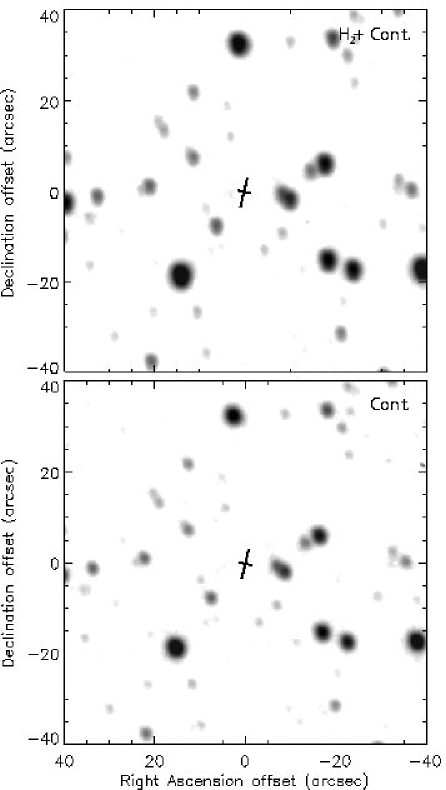
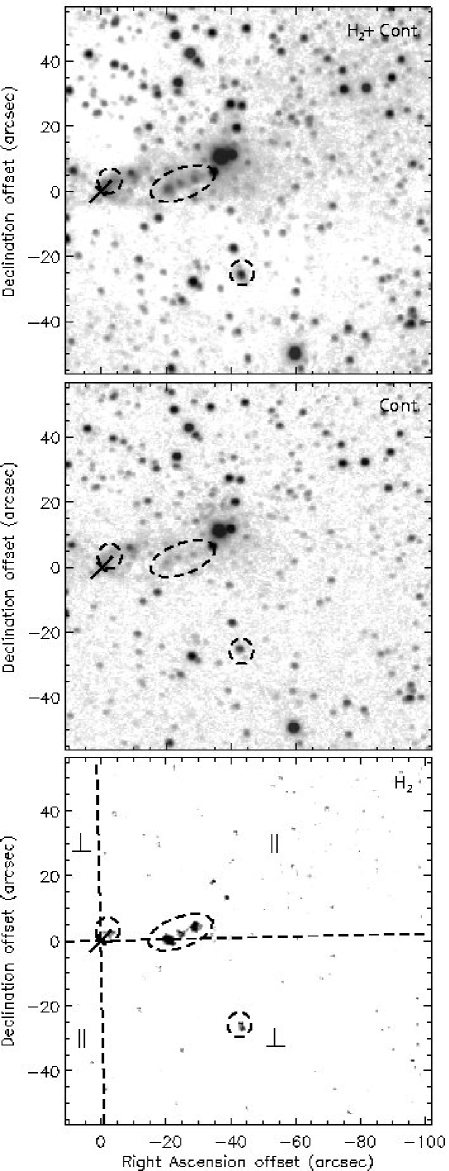
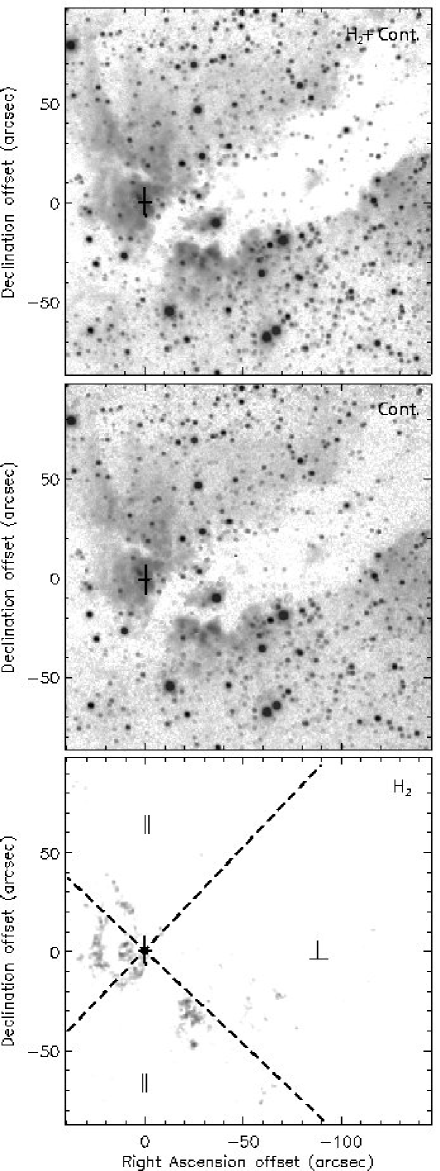
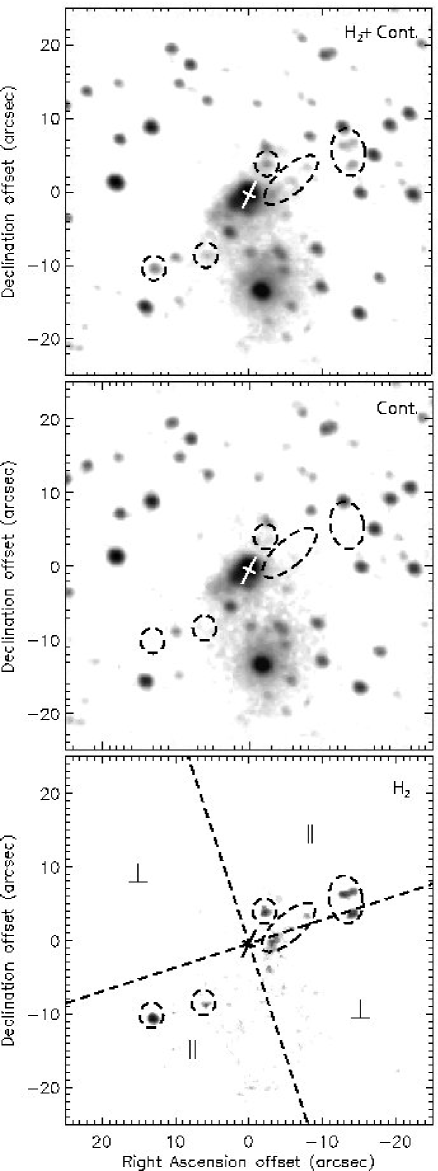
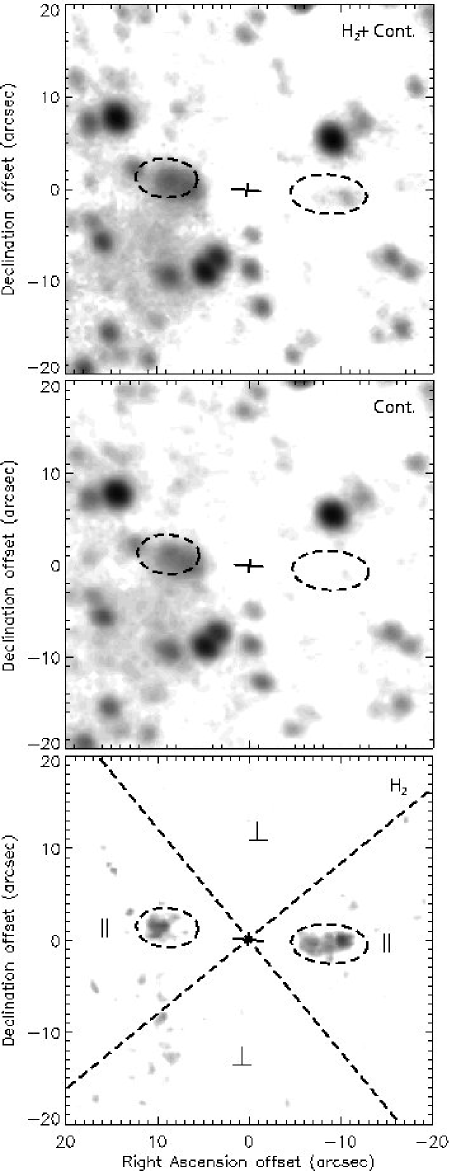
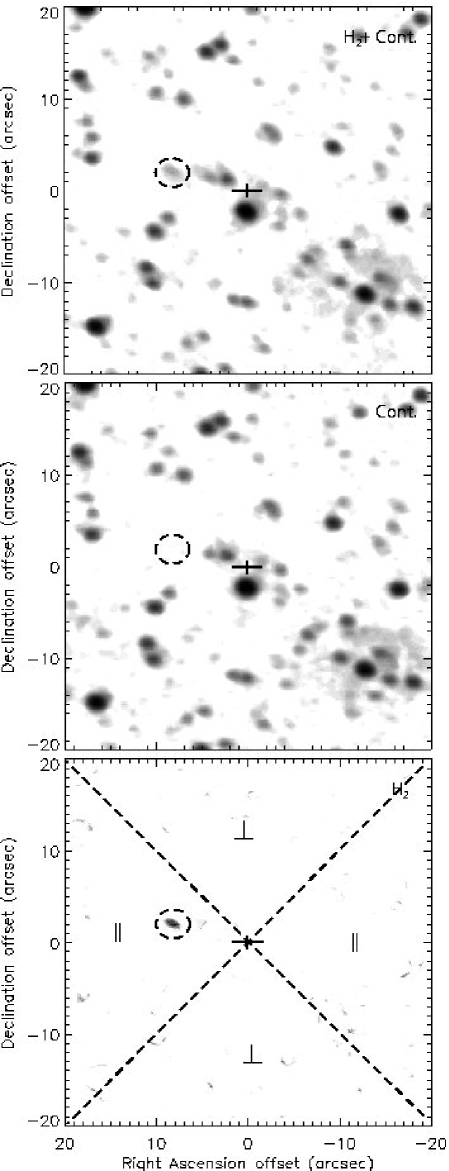
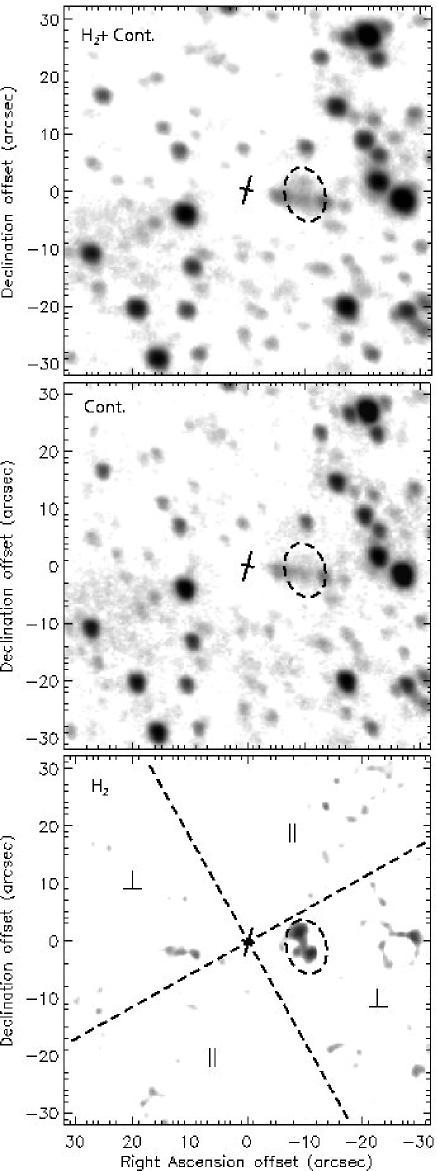
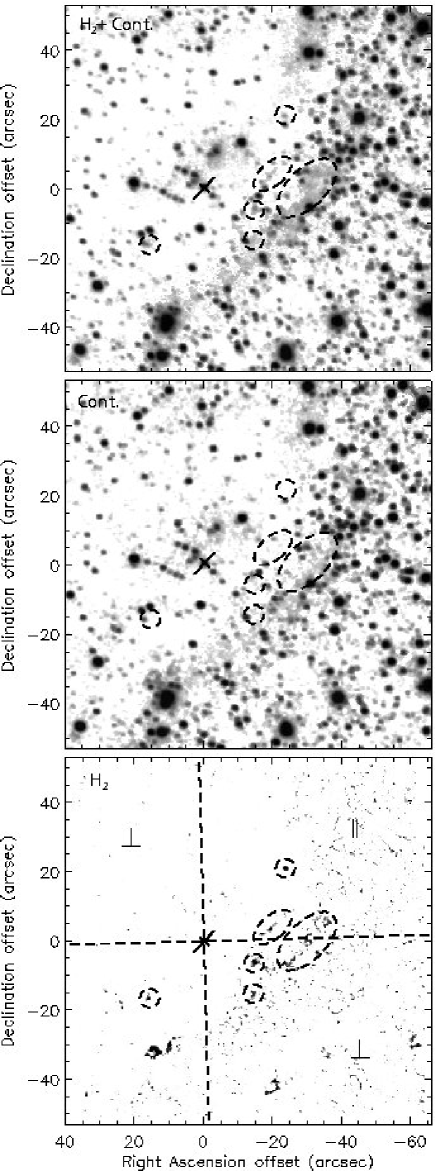
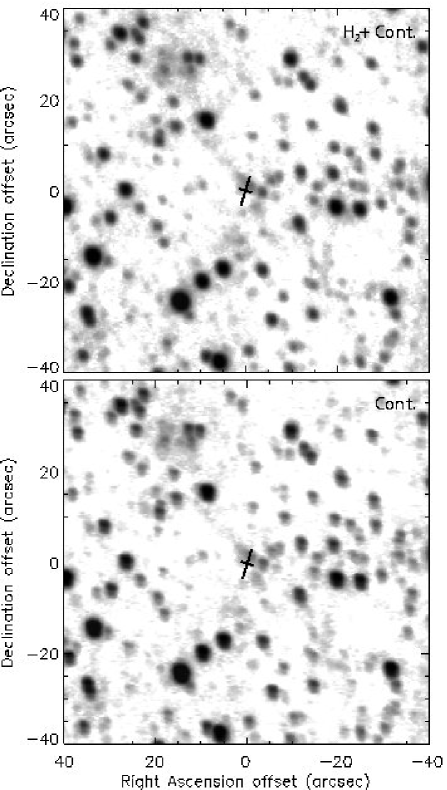
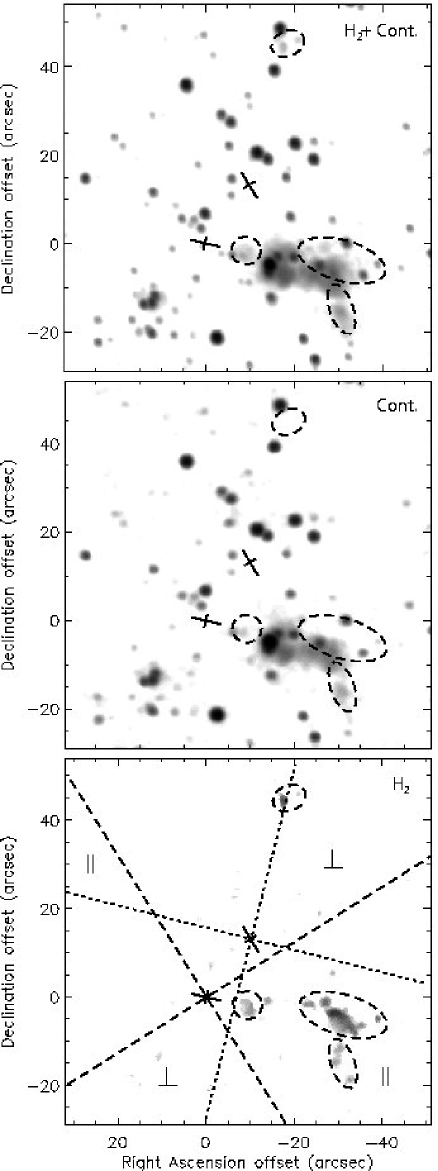
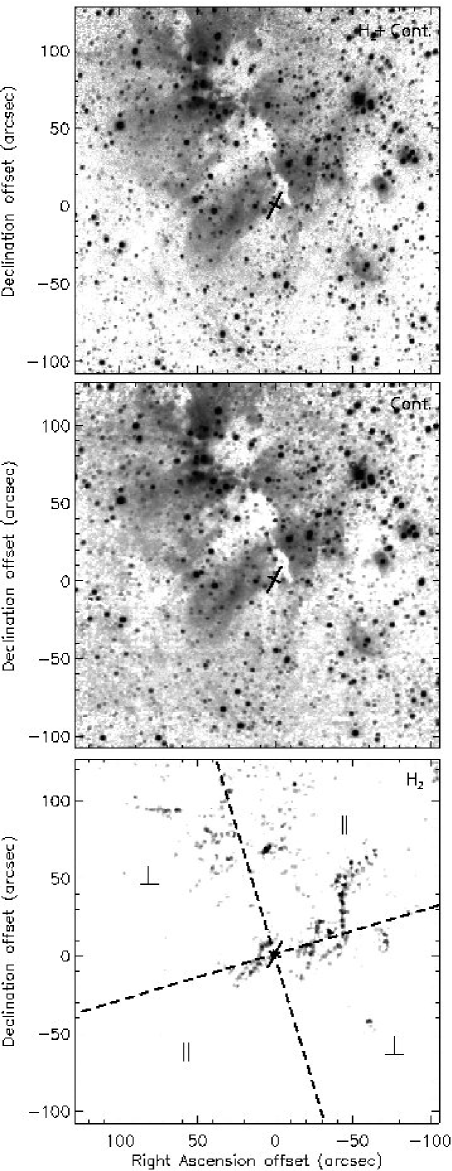
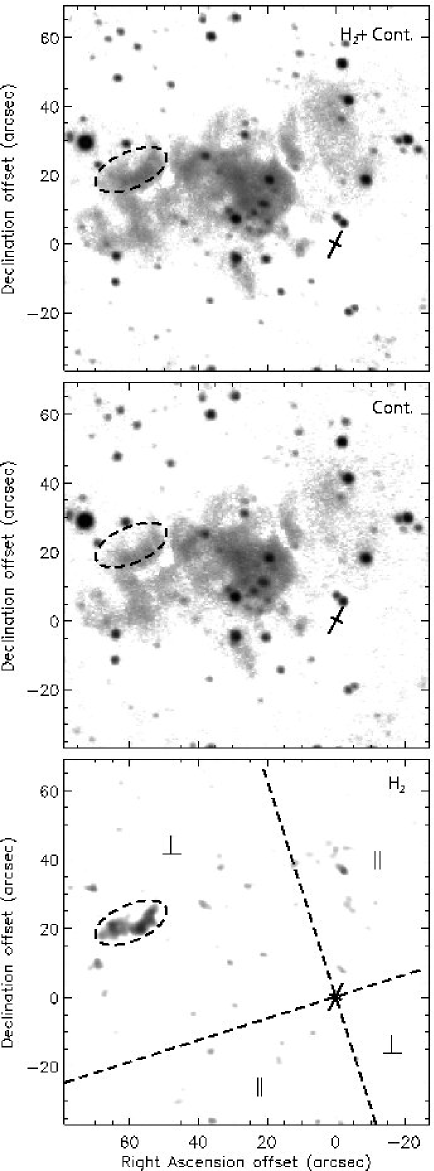
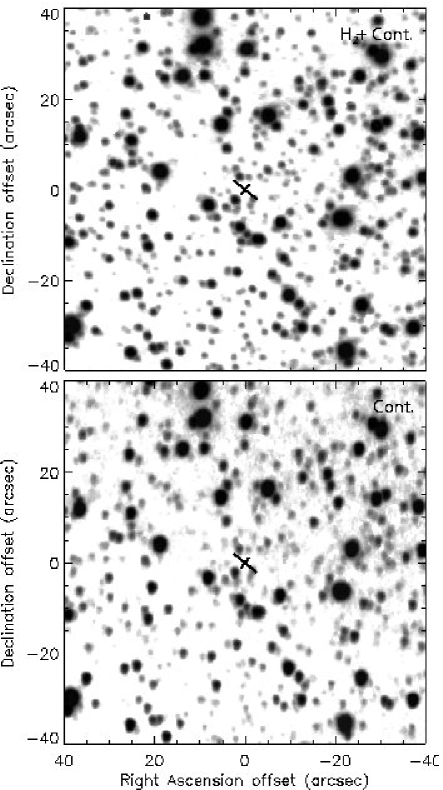
All of the methanol maser sites observed are shown in Figures 1 to 26. Each figure displays a panel showing the H2+continuum image of the region around the masers, as well as the continuum-only image normalized to the same intensity. If there is detectable H2 emission in the region, then the figure also contains a residual H2 image produced from the differencing of the continuum image and the H2+continuum image. In many cases, the H2-only and H2-dominated sources are so obvious that they can be discerned by eye when comparing the H2+continuum image with the continuum images in each figure. However, in some cases the H2 emission can only be seen in the residual frame.
There is also “noise” on the residual H2 frames because of the inability to subtract off stellar continuum sources completely. This is due to changes in seeing in the time between taking the H2+continuum image and the continuum-only image, as well as and diffraction spikes and internal reflections, especially for the brightest sources. The differencing method produces a positive residual for any emission seen exclusively in either the H2+continuum or continuum-only image. Careful inspection was made to ensure that noise sources were not mistaken for H2 sources. An example of a diffraction spike can be seen in the upper left corner of the H2+continuum and residual images in Figure 1. Examples of internal reflections can best be seen in the continuum image of Figure 17 as the “double halos” just north of the four bright continuum sources on the field.
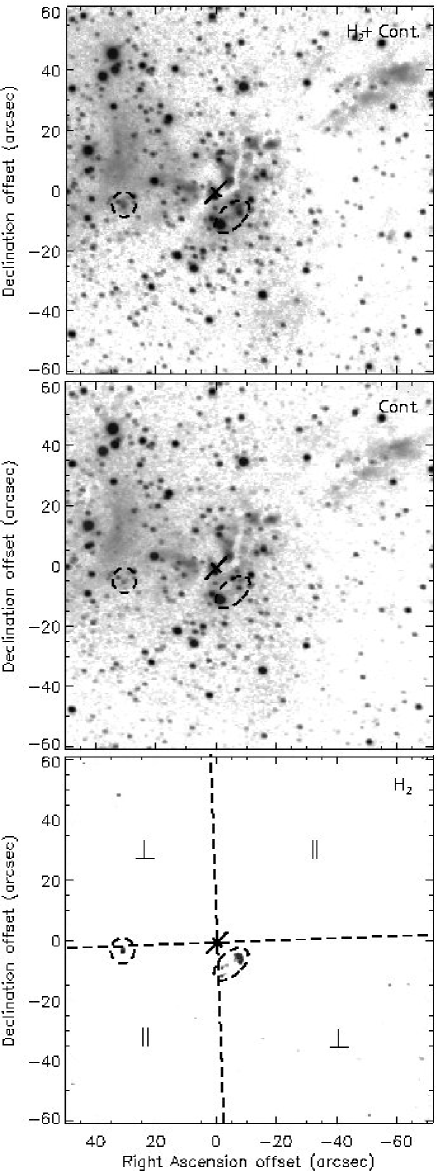
The position of the maser distributions is given by the crosses in each figure. One axis of the cross was made longer than the other and rotated so that the long axis indicates the position angle of the linear distribution of methanol masers. Dashed circles were added to show the locations of the H2 sources, and ellipses encompass multiple sources and/or regions of H2 emission. Again, other residuals may be seen on the H2 residual frame and are not circled because they are confirmed to be noise. In order to check if the majority of H2 emission in the fields was predominantly perpendicular or parallel, dashed lines were added to the residual H2 frames of each figure where H2 was detected. These dashed lines divided each image into parallel and perpendicular quadrants, which are marked. A target was deemed to have H2 emission “perpendicular” if the majority of the H2 sources were found in the perpendicular quadrants.
Again, H2 emission can be due to either UV fluorescence or shocks. One way of differentiating between shock and radiatively excited H2 emission is to compare the line intensities of the 1–0 S(1) line of H2 at 2.12 to the 2–1 S(1) line of H2 at 2.25 . However, since targets were not imaged through a 2–1 S(1) H2 filter, the only way to determine the likely origin of the H2 emission is by looking at the morphology of the H2 emission. For some targets in the survey, extended star-forming clouds were present, and H2 emission from these regions is most likely dominated by UV fluorescence rather than shock excited by outflows. These types of sources are deemed “not outflow” in nature. Table 1 lists each source, with the status of the H2 emission for each as “parallel”, “perpendicular”, “not outflow”, or “confused”. A site is labelled “confused” if it can not be fit into any one of the other three categories. The reasons for calling a maser site confused are site-specific, so refer to §3.1 on individual sources for clarification.
Contrary to what was expected, of the 18 sites with H2 emission, only two sites were found to have H2 emission dominantly perpendicular to their methanol maser position angles. The majority of the H2 sources, are found to be parallel to the maser distributions. Of the 18 sources where H2 was detected, 12 have H2 distributed predominantly in quadrants parallel to the maser position angle.
3.1 Individual sources
Below is a summary of what is known about each source, as it pertains to the interpretation of the H2 emission on each field. There are several sources that have complex fields, and such interpretation is difficult. This section is intended as a complete guide to the figures and Table 1. Though most of the sources in the survey are from Walsh et al. (1998) who used IRAS names, throughout this paper the names are given in terms of their galactic coordinates. This type of naming convention is more informative and also helps resolve confusion if there is more than one maser group associated with a particular IRAS source. For completeness, however, the IRAS names will be given in the section headings below and in Table 1.
| Target | IRAS Name | Right Ascension | Declination | Maser | H2 | Maser association | |
|---|---|---|---|---|---|---|---|
| (J2000) | (J2000) | p.a. | Radio? | NIR? | |||
| G305.21+0.21 | 13079-6218 | 13 11 13.72 | -62 34 41.6 | 25° | parallel? | Np | N |
| G308.918+0.123 | 13395-6153 | 13 43 01.75 | -62 08 51.3 | 137° | parallel | Yp | Y |
| G309.92+0.48 | 13471-6120 | 13 50 41.76 | -61 35 10.1 | 30° | no detection | Yp | Y |
| G312.11+0.26 | 14050-6056 | 14 08 49.30 | -61 13 26.0 | 166° | no detection | Nw | N |
| G313.77-0.86 | 14212-6131 | 14 25 01.62 | -61 44 58.1 | 135° | parallel | Nw | Y |
| G316.81-0.06 | 14416-5937 | 14 45 26.44 | -59 49 16.4 | 1° | not outflow | Nw | Y |
| G318.95-0.20 | 15 00 55.40 | -58 58 53.0 | 151° | parallel | Ne | Y | |
| G320.23-0.28 | 15061-5814 | 15 09 51.95 | -58 25 38.1 | 86° | parallel | Nw | N |
| G321.031-0.484 | 15122-5801 | 15 15 51.64 | -58 11 17.4 | 0° | parallel? | Nw | Y |
| G321.034-0.483 | 15122-5801 | 15 15 52.52 | -58 11 07.2 | 85° | parallel? | Nw | Y |
| G327.120+0.511 | 15437-5343 | 15 47 32.71 | -53 52 38.5 | 150° | no detection | Yp | Y |
| G327.402+0.445 | 15454-5335 | 15 49 19.50 | -53 45 13.9 | 62° | no detection | Yp | Y |
| G328.81+0.63 | 15520-5234 | 15 55 48.61 | -52 43 06.2 | 86° | parallel | Yw | Y |
| G331.132-0.244 | 16071-5142 | 16 10 59.74 | -51 50 22.7 | 90° | parallel | Yp | N |
| G331.28-0.19 | 16076-5134 | 16 11 26.60 | -51 41 56.6 | 166° | perpendicular | Yp | N |
| G335.789+0.174 | 16 29 47.33 | -48 15 52.4 | 136° | parallel? | Np | Y | |
| G336.43-0.26 | 16303-4758 | 16 34 20.34 | -48 05 32.5 | 163° | no detection | Np | Y |
| G337.705-0.053 | 16348-4654 | 16 38 29.61 | -47 00 35.7 | 137° | no detection | Yp | Y |
| G339.88-1.26 | 16484-4603 | 16 52 04.66 | -46 08 34.2 | 137° | ? | Ye | Y |
| G339.95-0.54 | 16455-4531 | 16 49 07.99 | -45 37 58.5 | 122° | no detection | Nw | N |
| G344.23-0.57 | 17006-4215 | 17 04 07.70 | -42 18 39.1 | 117° | no detection | Nw | N |
| G345.01+1.79 | 16533-4009 | 16 56 47.56 | -40 14 26.2 | 78° | parallel? | Yw | N |
| G345.01+1.80 | 16533-4009 | 16 56 46.80 | -40 14 09.1 | 30° | parallel? | Nw | N |
| G348.71-1.04 | 17167-3854 | 17 20 04.02 | -38 58 30.0 | 152° | not outflow | Nw | N |
| G353.410-0.360 | 17271-3439 | 17 30 26.17 | -34 41 45.6 | 153° | not outflow | Yp | N |
| G00.70-0.04 | 17441-2822 | 17 47 24.74 | -28 21 43.7 | 51° | no detection | Nw | Y |
| G10.47+0.03 | 18056-1952 | 18 08 38.21 | -19 51 49.6 | 98° | no detection | Yw | N |
| G11.50-1.49 | 18134-1942 | 18 16 22.13 | -19 41 27.3 | 174° | perpendicular | Nw | N |
? denotes that there is confusion associated with the H2 observations. See §3.1 for details.
p denotes that the result is from Phillips et al. (1998).
w denotes that the result is from Walsh et al. (1998).
e denotes that the result is from Ellingsen, Norris & McCulloch (1996).
3.1.1 G305.21+0.21 (IRAS 13079-6218)
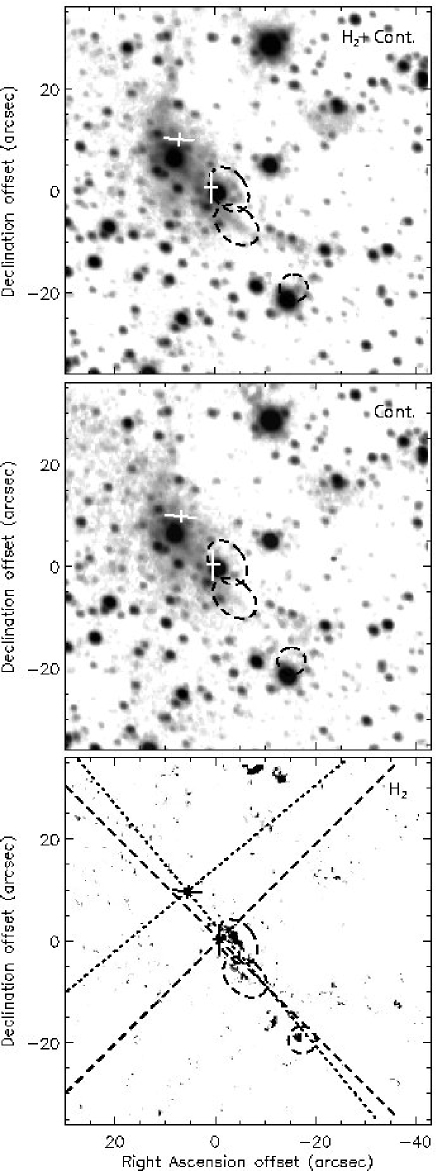
G305.21+0.21 is a linear distribution of 4 bright maser spots as seen by Norris et al. (1993), with 3 weaker spots found by Phillips et al. (1998). These seven maser spots are not distributed in a straight line, but more like in a flattened structure with a position angle of 25. The observed field also contains the methanol maser site known as G305.20+0.21, which contains two methanol maser spots (Norris et al. 1993) in a tight grouping. Again, other weaker spots were found here by Phillips et al. (1998). These two maser sites are only separated by 22. Their close proximity to the H2 emission detected here leads to uncertainty in which maser site the H2 emission is associated with, or if the H2 emission is being produced from both sites. There are two H2-only sources, one located 10 south, and the other 37 southwest, of G305.21+0.21. There is also an extended H2-dominated source located 22 southeast of G302.21+0.21 (Figure 1). If G305.21+0.21 is solely responsible for all the H2 emission (which may be the case since it appears closer to all three H2 sources) then the H2 sources are distributed more parallel than perpendicular to the methanol maser distribution. However, because these H2 sources could also be generated in part or solely by the source of the G305.20+0.21 masers, this H2 distribution for this site is labled “parallel but confused” in Table 1.
There is a very bright near-infrared source coincident with G305.20+0.21 that is surrounded by extended emission also seen by Walsh et al. (1999) who determine its magnitude to be = 7.0, and = 3.9. There is a compact and extremely bright mid-infrared source at this maser location as well (F10µm = 29 Jy; De Buizer et al. 2000). G305.21+0.21 was not found to have near-infrared emission by Walsh et al. (1999), however in the data presented here, there is indeed a small, compact near-infrared continuum source coincident with the maser position. A rough estimate of its apparent magnitude at 2.14 is = 13.6. However, there is no color information in this data set, therefore this source may be a field star. Neither of the maser positions are associated with radio continuum emission, however, the extended near-infrared emission containing G305.20+0.21 appears to be a large (1510) HII region (Phillips et al. 1998). This HII region can also bee seen at mid-infrared wavelengths (De Buizer et al. 2000; Walsh et al. 2001).
3.1.2 G308.918+0.123 (IRAS 13395-6153)
This maser site contains the most H2-only sources of any target observed in this survey. All 15 of these sources can be seen in Figure 2. The line of masers for this site is comprised of only 4 maser spots (Phillips et al. 1998). Surprisingly, there is no detectable extended H2 emission. The vast majority of the 15 H2 sources (10) are distributed within a region 45 from parallel to the maser distribution angle of 137.
Phillips et al. (1998) show that these masers are on the northern edge of an apparently spherical, extended HII region that has a radius of 6. Given the astrometry in this work, it was found that the masers are coincident with the peak of a bright near-infrared continuum source, but there does not appear to be any large HII region here seen in reflected dust emission in the near-infrared. Phillips et al. (1998) speculate that the radio continuum could be the ionized component of an outflow from the central source, which may be consistent in angle with these observations, however they caution that the narrow velocity range of the radio continuum make it unlikely.
3.1.3 G309.92+0.48 (IRAS 13471-6120)
The distribution of masers at this site is more arc-like than linear, and spans almost a full arcsecond. This site contains 10 maser spots (Phillips et al. 1998) with a very well-defined velocity gradient along the spots that is argued to be consistent with a systemic rotation. For this and several other reasons, this site has been characterized as a good circumstellar disk candidate by De Buizer et al. (2000) and De Buizer (2001), who observed the source to be elongated in thermal dust emission at the same position angle as the maser distribution.
However, contrary to what was expected, no H2 emission was found perpendicular to this maser distribution (Figure 3). In fact, no detectable H2 emission was found in the field at all. This is consistent with the observations of Oliva & Moorwood (1986), who do not detect any H2 emission spectroscopically from this region within a 30 aperture. Nonetheless, the masers are associated with a bright near-infrared continuum source, that was also seen at mid-infrared wavelengths by De Buizer et al. (2000) and Walsh et al. (2001), and is also a radio strong radio continuum source (Phillips et al. 1998).
3.1.4 G312.11+0.26 (IRAS 14050-6056)
This site contains 4 bright maser spots in a line (Walsh et al. 1998), but they are isolated and offset more than 3 from the nearest UC HII region and more than 4 from the position of IRAS 14050-6056. The near-infrared continuum image in Figure 4 shows no signs of extended near-infrared emission within a 40 radius of the maser position. Furthermore, there is no detectable near-infrared emission at the location of the masers. Likewise, there is no sign of H2 emission from this source. Unpublished observations of this site in the mid-infrared (De Buizer, in preparation) have also failed to detect any thermal dust emission at this location. This site, therefore, has none of the normal characteristics of a star forming region. If a massive star is forming here, it must be extremely young and forming in relative isolation, which is contrary to the established idea that massive stars form in clusters at the center of giant molecular clouds.
3.1.5 G313.77-0.86 (IRAS 14212-6131)
There is a hydroxyl maser (Caswell 1998) coincident in location to the group of 4 methanol maser spots at this location. These 4 spots are shown to be linearly distributed in Walsh et al. (1998), but due to the size of the error bars in the maser positions, the reality of the linear distribution of these spots is perhaps debatable.
In Figure 5, extended near-infrared emission can be seen in a structure elongated roughly east-west. The majority of H2 emission here is associated with this diffuse near-infrared lobe of emission. Furthermore, except for one H2 source to the southwest, all of the H2 emission at this site is found in one quadrant parallel to the methanol maser position angle. Therefore, in Table 1 this source is listed as dominantly “parallel.”
The methanol masers are coincident with a extended near-infrared source that contains no radio emission (Walsh et al. 1998). Interestingly, the near-infrared source appears to be cometary shaped. This can not be a cometary UCHII region, due to the lack of radio emission from this site. The near-infrared emission associated with the masers may appear to be extended simply because of environmental effects or due to several unresolved young stellar sources present at this location. However, an alternative scenario can be suggested based on the morphology of the whole region. In Figure 5, there is a group of three bright near-infrared sources at the location (, = (-37, +10). The opposite side of the elongated lobe of near-infrared emission ends near these bright sources. Assuming the near-infrared and H2 emission is due to outflow, one could argue that instead of the maser location being the center of outflow lobe, the masers could be at the head of the outflow lobe and one of these bright sources is at the center. This would explain the cometary or “bow-shock” shape of the near-infrared source associated with the masers. This is the only source in the survey where there is evidence pointing towards the methanol masers existing in the shock-excited area at the head of the outflow, rather than the center.
There is another cluster of 3 methanol masers 23 east and off the edge of the image presented in Figure 5 at about the same declination as the three bright near-infrared sources.
3.1.6 G316.81-0.06 (IRAS 14416-5937)
The masers at this location are in the middle of a spectacular and large dust cloud complex. The near-infrared images in Figure 6 show the expansive region taken up by the near-infrared emission alone, with a dark lane of dust cutting through the region diagonally. This region is full of extended mid-infrared emission as well (Walsh et al. 2001), and some radio continuum emission (Walsh et al 1998).
The H2 emission at this site comes from many areas of the cloud. The masers are situated on the edge of a what appears to be a “ring” of H2-dominated emission. Due to the fact that the masers reside in a star-forming cloud complex, it is more likely that the H2 emission is produced by UV fluorescence than by shocks. Such rings of H2 near massive YSOs has also been seen in IRAS 20293+3952 and IRAS 05358+3543 by Kumar, Bachiller & Davis (2002). For this reason, this maser site is described as being “not an outflow” in Table 1.
3.1.7 G318.95-0.20
This site has 7 maser spots distributed in a linear fashion at an angle of 151 (Norris et al. 1998). The masers are coincident with a very bright near-infrared continuum source (Figure 7), which is also seen in the mid-infrared (De Buizer et al. 2000; Walsh et al. 2001). There does not appear to be any radio continuum from this source, however (Ellingsen, Norris & McCulloch 1996).
There are several sources of H2-only and H2-dominated emission coming from this source, all of which are from parallel. Interestingly, this same source was looked at in H2 by Lee et al. (2001), and apart from the lower level emission, the major sources that are seen in Figure 7 can also be seen in the work of Lee et al. (2001). They conclude that there is no definitive angle of emission, probably due to confusion of the bright sources with the low-level emission. This low-level emission can come from poor subtraction of the continuum from the H2 image, and is a difficult problem to avoid. For this reason, the brighter H2 sources are the most convincing and may have the greatest validity. Even so, the majority of the H2 emission in the image of Lee et al. (2001) is still 45 of being parallel to the maser distribution position angle. While there is disagreement on the morphology of the H2 emission, Lee et al. (2001) do argue that the H2 emission is most likely shock excited rather than due to UV fluorescence.
3.1.8 G320.23-0.28 (IRAS 15061-5814)
Of all the sources in the survey, this region contains H2 emission that most closely resembles a bipolar outflow morphology. This maser site contains 10 maser spots, 9 of which are distributed into a tight linear distribution spanning 05 (Walsh et al. 1998). The tenth maser spot lies 02 north of the center of this distribution. Even including this tenth maser spot, the distribution is clearly elongated at an angle of about 86. The H2 emission in this region is distributed on either side of the masers and extremely close to parallel (Figure 8). The H2 emission to the west is almost all H2-only emission, whereas the emission to the east is H2-dominated and can best be seen in the residual H2 frame of Figure 8. Walsh et al. (1998) find a small radio continuum source 5 north of the location of the eastern H2 source. There does not appear to be an association with any near-infrared source at this location. This source not only represents the best case of an outflow from a methanol maser source in this survey, it is also the best candidate for further observations in disproving the circumstellar disk hypothesis for linearly distributed methanol masers.
3.1.9 G321.031-0.484 & G321.034-0.483 (IRAS 15122-5801)
There are two sites of linearly distributed methanol masers in this field separated by 10 (Walsh et al. 1998). The northern maser site is G321.034-0.483 and has nine maser spots distributed in a line that is almost perpendicular to the maser group in the south, G321.031-0.484, which is composed of 6 maser spots. G321.031-0.484 is closest to all of the H2 emission found here (Figure 9). Though an extended source of H2 emission is located perpendicular to the maser distribution of G321.031-0.484, the majority of the H2 emission is found within the parallel quadrant. Of all the H2 sources on the field, the source that is perpendicular to G321.031-0.484 lies closest to G321.031-0.484 and lies in its parallel quadrant. This extended H2 source is also elongated radially to the position of G321.031-0.484, and so may be associated. In this scenario then, the H2 emission here would be predominantly parallel to both maser sources. Regardless of these arguments, the presence of both maser groups leads to some confusion as to which source is responsible for what H2 emission, if any. Therefore both of these maser groups are listed as “parallel but confused” in Table 1.
3.1.10 G327.120+0.511 (IRAS 15437-5343)
This maser distribution is not only linear, but there is a well-defined velocity gradient along the 5 maser spots (Phillips et al. 1998). The masers appear to be coincident with a bright near-infrared source (Figure 10) that also has faint radio continuum emission (Phillips et al. 1998). Interestingly, the extended near-infrared continuum emission appears morphologically similar to a single-sided outflow originating from the location of the masers. However, there does not appear to be any H2 emission in the area, and therefore is not likely an outflow. This is consistent with the observations of Oliva & Moorwood (1986), who do not detect any H2 emission spectroscopically from this region within a 30 aperture.
3.1.11 G327.402+0.445 (IRAS 15454-5335)
This site actually contains two sites of methanol masers, G327.402+0.444 and G327.402+0.445, as well as an isolated, single methanol maser spot G327.402+0.444E (Phillips et al. 1998). However, all three maser sites lie within 5 of each other. G327.402+0.445 has a linear maser distribution consisting of 5 maser spots with a well-defined velocity gradient. This maser site is coincident with the center of a radio continuum region seen by Phillips et al. (1998). G327.402+0.444 is also claimed by Phillips et al. (1998) to be linearly distributed if one ignores maser spot ‘B’. However if one instead ignores the weakest source, maser spot ‘A’ (or indeed any other maser spot in the group), then the distribution would not appear linear at all. For this reason, this methanol maser site is not considered to be linearly distributed in this paper.
In Figure 11, the masers of G327.402+0.445 are shown. G327.402+0.444 and G327.402+0.444E lie 2 and 5, respectively, to the east and are not shown. All of the methanol masers here lie on the southern edge of a extended near-infrared source, however there is no detectable H2 in the region. Perhaps the extended near-infrared emission that is present is related to the northern part of the radio continuum region seen by Phillips et al. (1998).
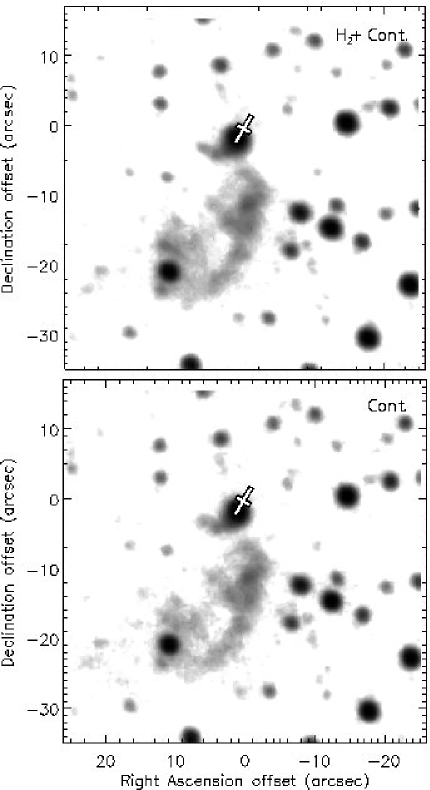
3.1.12 G328.81+0.63 (IRAS 15520-5234)
This linear distribution of 9 methanol maser spots (Norris et al. 1998) is also associated with a mid-infrared source (De Buizer et al. 2000) and an UC HII region (Walsh et al. 1998). The masers lie 5 south of a very bright near-infrared source (Figure 12), but according to Osterloh, Henning & Launhardt (1997) this is a reddened foreground star that is not associated with the masers. The masers do appear to be associated with near-infrared continuum emission in Figure 12. There are 4 sources of H2-only emission near the masers, all located to the east of the maser group and within 40 of being parallel to the position angle of the methanol masers.
3.1.13 G331.132-0.244 (IRAS 16071-5142)
The 9 methanol maser spots here are arranged predominantly at an angle of 90, and have a velocity gradient along the spot distribution (Phillips et al. 1998). An extended region of radio continuum emission is found to be associated with the masers (Phillips et al. 1998, Walsh et al. 1998), and the source appears to exist very close to (but not coincident with) a bright near-infrared continuum source (Figure 13). There is only one H2-only source in the field, and it is extended and offset 8 from the position of the masers at an angle close to parallel with the maser distribution position angle.
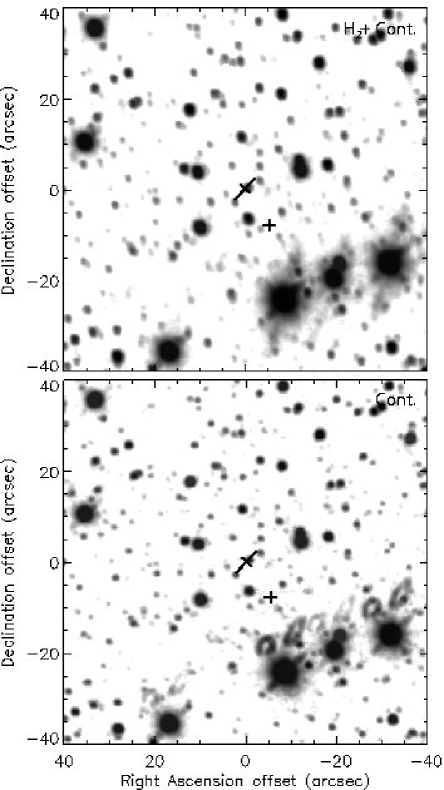
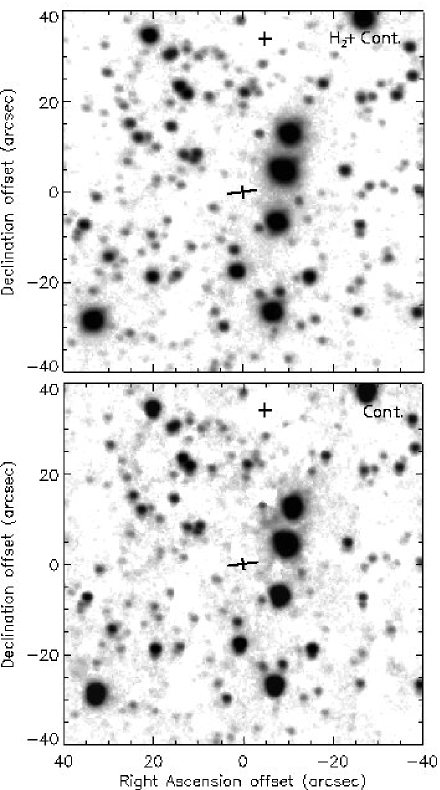
3.1.14 G331.28-0.19 (IRAS 16076-5134)
This site contains eleven methanol maser spots, and though they are not in a tight line, they are distributed in a flattened structure at an angle of 166. Phillips et al. (1998) find extended radio continuum emission enveloping this maser region and extending to the southeast for more than 8. It is possible that this could be the partially ionized component to an outflow from the maser location, in which case the outflow would be close to parallel to the maser distribution angle. The other explanation for the radio continuum emission could be that is is an extended UC HII region, however it is interesting to note that there is no near-infrared emission coming from it (Figure 14), as is often seen in more developed UC HII regions. This leans the evidence in favor of the radio continuum coming from an outflow. However there is an extended, diffuse, region of near-infrared continuum emission to the west of the location of the masers that is not seen in the radio. In addition, this diffuse source does indeed have a significant amount of H2 associated with it. This H2 emission, however, is positioned perpendicular to the methanol maser position angle. Similar observations by Lee et al. (2001) of this region show this same bright H2 source, and it is argued by those authors as being evidence of outflow and that the methanol masers do indeed arise for a circumstellar disk. However, if this is indeed the outflow from the maser location, and the radio emission is not a UC HII region, the nature of the radio continuum is then a mystery.
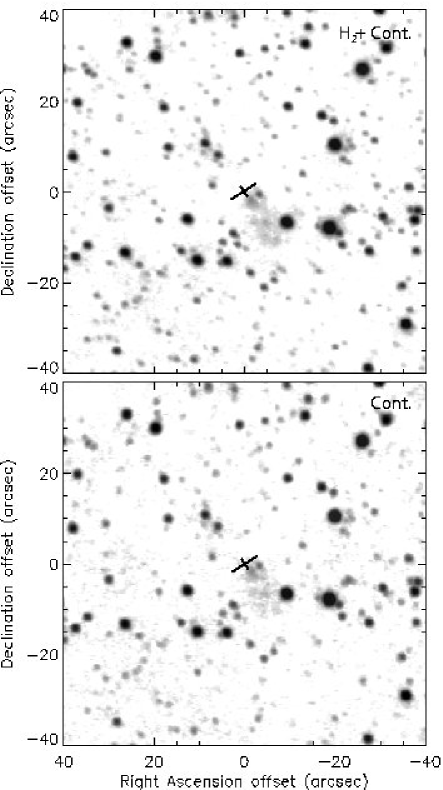
3.1.15 G335.789+0.174
There are 11 maser spots at this sight, 6 of which are concentrated in a linear distribution at a position angle of 136 spanning 01 (Phillips et al. 1998). The other masers are found in separate maser sites consisting of 3 and 2 spots offset (02 and 03 away, respectively) from this main linear distribution, and it is not clear if the masers are related or associated with different sources. Observations in the near-infrared of this region (Figure 15) show that the masers are located 20 from a ‘ridge’ of extended emission running diagonally across the field. The masers are coincident with a near-infrared continuum source, however because there is no color information it can not be said with certainty if this near-infrared source is the exciting source for the maser emission. The majority of the H2 emission found here is associated with the edge of this ridge of near-infrared emission which is most likely a photodissociation region. Therefore, the H2 in this ridge is most likely excited by fluorescence, however there are a few components offset from the ridge that lie parallel to the maser position angle (Figure 15). Though this offset H2 emission is parallel to the maser position angle, it is still difficult to discern if the emission is, in fact, associated with the maser source or part of the photodissociation ridge. Therefore the H2 emission from this site is referred to as ‘parallel but confused’ in Table 1.
3.1.16 G336.43-0.26 (IRAS 16306-4758)
The methanol masers at this site were shown to have a linear distribution by Norris et al. (1998), however the work of Phillips et al. (1998) added additional components to the maser group, making it appear much less linearly distributed. However, the rough, overall appearance of the maser group is still elongated, though not overwhelmingly so. This maser site is another interesting region like that of G312.11+0.26, where there appears to be little evidence of star formation, although not as extreme. No radio emission was detected here by Phillips et al. (1998), there was no detected thermal dust continuum emission in the mid-infrared by De Buizer et al. (2000), and no OH masers were detected here by Caswell et al. (1995). Furthermore, as seen in Figure 16, there is no evidence of H2 emission. Walsh et al. (1999) also claim there is no near-infrared source at the maser location. However, comparing their near-infrared images with the ones presented here reveal that Walsh et al. (1999) erroneously placed the masers 41 southeast of the actual maser location in their image. With the masers in the correct location in Figure 16, it can be seen that there is some extended near-infrared continuum emission present near the position of the methanol masers.
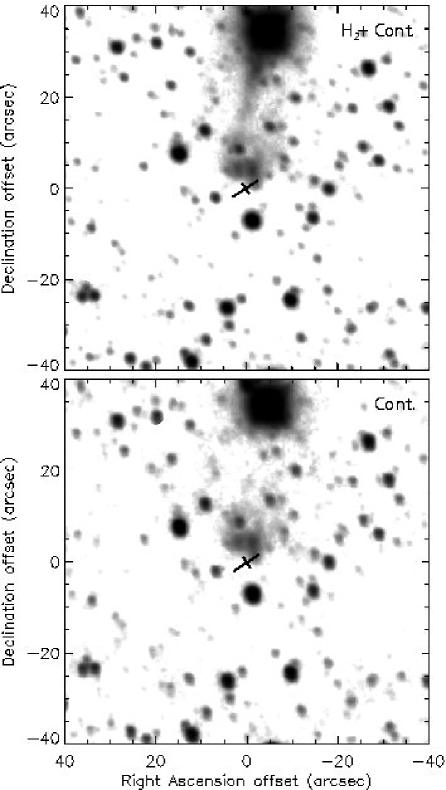
3.1.17 G337.705-0.053 (IRAS 16348-4654)
This site has 10 methanol maser spots linearly distributed with a velocity gradient (Phillips et al. 1998). There is also another site consisting of 2 methanol maser spots, G337.703-0.053, also nearby (Figure 17). The site of linearly distributed masers is coincident with the peak of an unresolved HII region seen by both Philips et al. (1998) and Walsh et al. (1998). In the near-infrared the masers appear coincident (within the errors of astrometry) with a continuum source as well. Whether this is the near-infrared component of emission from the UC HII region or a field star is not known. There is no detectable H2 emission in the field.
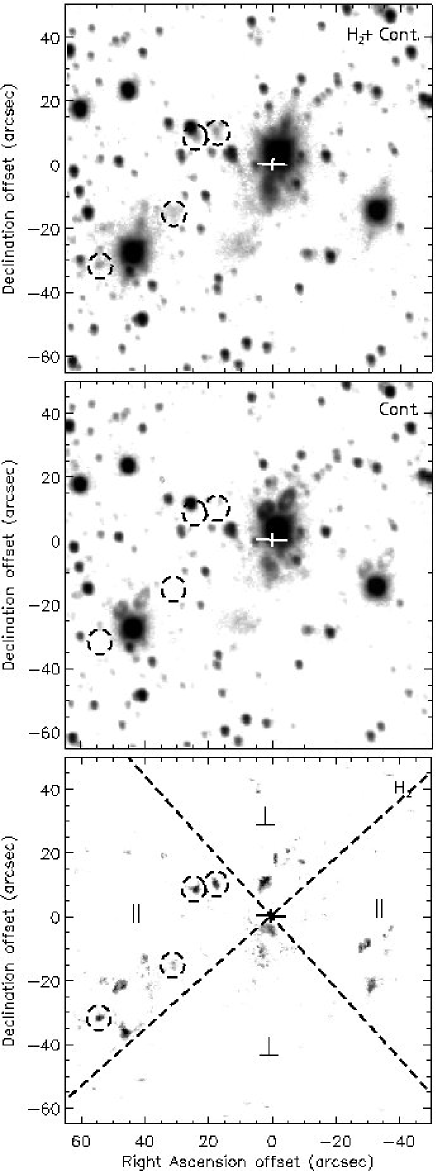
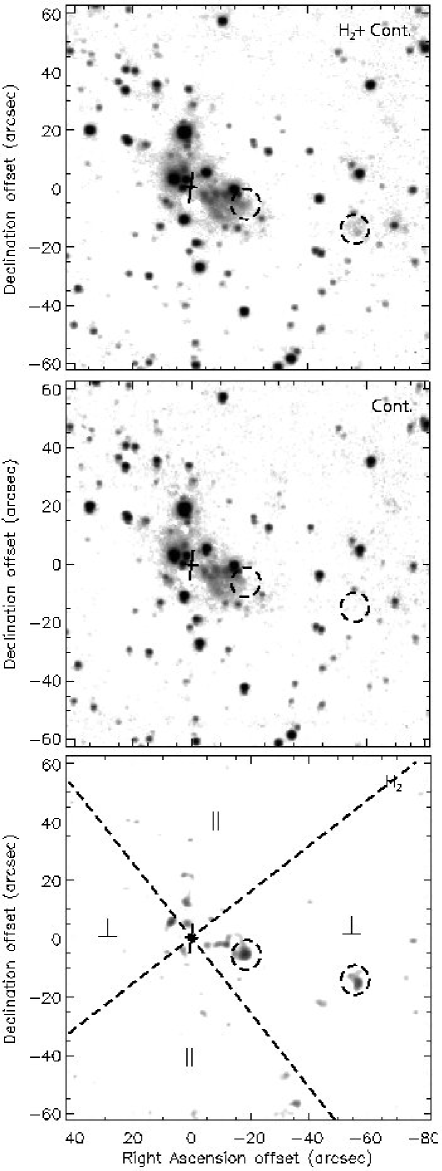
3.1.18 G339.88-1.26 (IRAS 16484-4603)
The properties and observations of this site have been explored in detail by De Buizer et al. (2002a). There are 49 methanol maser spots at this site in a linear distribution and spread over 15. There is extended radio continuum emission present (Ellingsen et al. 1996), with the methanol masers slightly offset to the south of the radio peak. There are three mid-infrared sources coincident with the masers as well. De Buizer et al. (2002a) speculate that the radio continuum, which is extended at a position angle perpendicular to the maser distribution, may be the ionized component of an outflow. Inspection of the near-infrared images of this region (Figure 18) shows extended continuum emission in the direction perpendicular to the maser distribution position angle. However, there is also extended near-infrared continuum emission parallel to the masers as well, seen by an outflow-shaped, elongated, and diffuse source that is centered 60 northwest of the maser location. The H2 emission image does not help solve this dilemma, since there are two sources of H2 emission, with one located in a quadrant parallel to the maser distribution and the other in a perpendicular quadrant (Figure 18). Due to the lack of H2 present, the extended near-infrared emission here is most likely associated with the nearby star formation region and not an outflow. Therefore, the nature of the H2 sources, either shock excited or UV excited, can not be ascertained either. The lack of copious amounts of H2 emission could be viewed as being inconsistent with the speculation that the radio emission here is delineating an outflow. One could argue that the radio emission could be simply an elongated UC HII region, and the weaker features speculated as being periodic mass ejection features may be artificial by-products of the data reduction. However, further radio continuum observations and observations of other outflow diagnostics, such as HCO+ could help solve this problem.
3.1.19 G339.95-0.54 (IRAS 16455-4531)
The linearly distributed methanol masers at this site are offset by 90 from a UC HII region which has one methanol maser spot associated with it (Walsh et al. 1998). This linearly distributed group of masers has 16 maser spots. The near-infrared images of this site show that the masers lie near a small region of low signal-to-noise extended continuum emission, however there appears to be no clear evidence of H2 emission on the field (Figure 19). The extended emission region is perpendicular to the maser distribution, however, and the masers are slightly offset from the edge of this region where one would expect morphologically an outflow to originate.
3.1.20 G344.23-0.57 (IRAS 17006-4215)
This site contains 10 methanol maser spots in a tight linear distribution (Walsh et al. 1998) offset by 90 from a UC HII region that lies to the southeast. Walsh et al. (1999) detect no near-infrared component at the maser location in K or L bands, consistent with the non-detection presented here (Figure 20). Furthermore, there is no detectable H2 in the field.
3.1.21 G345.01+1.79 & G345.01+1.80 (IRAS 16533-4009)
Separated by only 19, G345.01+1.79 and G345.01+1.80 both display methanol maser distributions that are linear. Norris et al. (1998) found G345.01+1.79 to have 6 methanol maser spots distributed over 03, whereas G345.01+1.80 has 14 methanol maser spots in a tight linear distribution spanning the same angular size. Walsh et al. (1999) found both sites to be lacking emission at K, but G345.01+1.79 was found to have a component in the L band. Both sites have a mid-infrared component at their maser locations (De Buizer et al. 2000; Walsh et al. 2001), but only G345.01+1.79 has radio continuum emission (Walsh et al. 1998). Due to the close spacing of the two methanol maser sources, it is difficult to say for sure which maser source the H2 emission in Figure 21 is associated with, or indeed if both are associated with the emission. There is a long, extended region of near-infrared emission offset 15 from G345.01+1.79 and located exactly parallel to the methanol maser distribution. It is also elongated along this direction. The H2 emission is dominantly from this elongated source, although there are two small H2 sources 30 north of G345.01+1.80. All of the H2 emission on the field is 45 from parallel with the maser distribution of G345.01+1.80 (Figure 21). The two northern sources of H2 are more likely to be associated with G345.01+1.80 than G345.01+1.79 because of proximity, and the rest of the H2 emission in the field is also 45 from parallel to the maser distribution angle of G345.01+1.79. Therefore, even though there is confusion regarding which source is responsible for the H2 emission, it can be said that the H2 sources are consistent with being distributed more parallel than perpendicular to both G345.01+1.79 and G345.01+1.80. Therefore, both sources are labelled “parallel but confused” in Table 1.
3.1.22 G348.71-1.04 (IRAS 17167-3854)
The 11 maser spots that make up this linear distribution (Walsh et al. 1998) are situated in the middle of the impressively extended ( = 4) star formation region RCW 122, also known as BFS 65 (Figure 22). Due to the fact that this region contains widespread ionized gas and is extended in all directions from the maser location, the diffuse and extended H2 emission found here (Figure 22) is most likely due to UV fluorescence. Therefore, in Table 1 this source is labelled “not an outflow.” Even though there is extended emission present, there is no near-infrared or radio component directly associated with the maser location.
3.1.23 G353.410-0.360 (IRAS 17271-3439)
The five methanol maser spots comprising this group are linearly distributed with a well-defined velocity gradient along the spots (Phillips et al. 1998). The maser site lies 30 from the middle of an extended near-infrared cloud of emission (15), but is not coincident with a near-infrared continuum source itself (Figure 23). The methanol masers are, however, coincident with the location of OH masers and a slightly extended radio continuum source (Forster & Caswell 2000). The H2 emission is scattered weakly throughout the extended region of near-infrared emission, and is brightest on the side of the region furthest from the masers. There is also extended radio continuum emission in this area seen by Forster and Caswell (2000), however, they do not image the radio continuum as far east as the location of the brightest H2 emission. Given that the H2 emission is coming from this infrared cloud and that it is located on the opposite side of the cloud from the masers, it is assumed that the masers are not related to the H2 sources. Therefore, this site is labelled “not an outflow” in Table 1.
3.1.24 G00.70-0.04 (IRAS 17441-2822)
This maser site is one of several different regions of maser emission within the rather complex Sag B2 star forming region. The 5 methanol maser spots in the group that was observed here are offset from the IRAS source by (, ) = (677, 835). The masers have no associated radio continuum emission (Walsh et al. 1998), however there are several nearby radio continuum sources. This maser group is only roughly linear given the relatively large error bars (005) in the relative offsets between individual components and the fact that the distribution spans only 013. It is perhaps not surprising, therefore, that the was no detected H2 emission at this location (Figure 24). The masers also do not appear to be associated with any near-infrared continuum source either.
3.1.25 G10.47+0.03 (IRAS 18056-1952)
The site of the well-observed hot core from the ammonia observations of Cesaroni et al. (1994), the masers here are coincident with the water masers and the compact radio continuum sources ‘A’ and ‘B’ of Hofner & Churchwell (1996). However, Figure 25 shows that there is no near-infrared component to these radio continuum and ammonia sources. None of the bright sources to the west of the maser location are see at optical wavelengths in the Digital Sky Survey. However, not only is there no detectable near-infrared component to G10.47+0.03, there are also no signs of H2 emission in the field. Also present in this field is the maser site G10.48+0.03 lying 35 north of G10.47+0.03 and consisting of 3 maser spots (Figure 25).
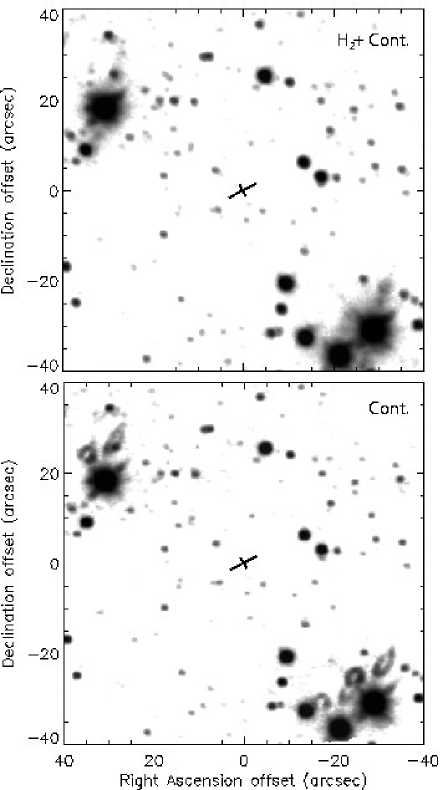
3.1.26 G11.50-1.49 (IRAS 18134-1942)
There are 12 methanol maser spots linearly distributed at this site, however there is no detectable radio continuum emission (Walsh et al. 1998). Figure 26 shows that the maser site is not directly coincident with any bright near-infrared source, but is located in an large (40) area of extended near-infrared emission. It is not clear if this extended near-infrared emission is a star forming cloud (in which case the emission would be due to UV fluorescence) or if it is emission from outflow shocks. There are two bright sources of H2 emission present and both are very close to lying perpendicular to the position angle of the methanol maser distribution. This is only one of two sources (the other being G331.28-0.19) in the survey that have H2 emission perpendicular to the maser position angle which are also likely outflow candidates.
4 Discussion
4.1 The case against linearly distributed methanol masers delineating disks
The first important result from these observations is the fact that the H2 emission is found to be perpendicular to the methanol maser distribution angle in only 2 of the 28 sources observed (7%). This result was contrary to what was expected. An even more surprising result was that, of the sites where H2 emission was detected, the emission did not appear to be randomly distributed throughout the field of view. Excluding the “no detections” and the H2 sites determined to be radiatively excited (i.e. “not outflow”), Table 1 shows that the great majority (12/15, 80%) of these maser sites have H2 emission that is found to be predominantly parallel to the linear distributions of methanol masers. However, the exact nature of the H2 emission observed in this survey is not known. It is possible that all the sources of H2 emission on each field are unrelated to the masers and, in the case of multiple H2 sources on the field, unrelated to each other. Sources may simply be radiatively excited regions of H2 emission. They may also be shock signatures from stellar sources other than the stellar source exciting the masers. However, while any one source of H2 observed may be unrelated to the source exciting the masers, the fact that the H2 emission is preferentially found to be parallel to the maser distributions suggests a general physical relationship between the H2 observed and the masers. Therefore, since there appears to be a link between the methanol masers and the H2 emission, and since the general result of the survey is that the the H2 is situated predominantly parallel to the maser distributions, then these results are contrary to what is expected if the disk hypothesis of methanol masers was true.
The near-stellar environment of an O or early B type star is highly caustic, and it is not expected that circumstellar disks can survive long after accretion stops feeding them. There are also no observations of massive stars with debris disks at later stages of evolution. Therefore, these early accretion phases are most likely the only times when massive stars will have disks and their accompanied outflows. It is therefore surprising that 46% of the maser sites surveyed do not display any evidence of outflow from H2 emission. The detection of H2 in 8 out of 8 low mass YSOs with known CO outflows (Davis & Eislöffel 1995), and the detection of H2 in 7 out of 7 high mass YSOs with known CO outflows (Kumar et al. 2002) demonstrates the seemingly strong correlation between CO and H2 emission in outflows from YSOs of all masses. Therefore, the high rate of non-detection of H2 from these sources is an additional result contrary to the hypothesis that methanol masers exist in circumstellar disks around massive stars.
A possible reason for the non-detection of H2 emission may be the high obscuration towards these massive stellar sources. The earliest phases of massive stellar birth are indeed heavily embedded. However, since 6 of the 10 maser sites where no H2 was detected have a near-infrared continuum source present at 2.14 , extinction of the 2.12 H2 photons towards these sites cannot play a large factor in explaining the lack of H2 detected. Another possible reason is that the outflows from these sources may be at the wrong velocity to excite the H2 to emit collisionally. H2 is excited in molecular shocks with velocities from 10 to 50 km s-1 (Smith 1994). In the survey by Shepherd & Churchwell (1996), out of 94 high mass stars, 80% had CO gas components with velocities in the range of 15 to 45 km s-1, which corresponds to the collisional excitation range of H2. Therefore, one might again expect to find a strong correlation between the CO outflows and H2 emission from high mass YSOs similar to what is seen from low-mass mass YSOs. However, it should be noted that massive YSOs have been observed with outflow velocity components ranging 2 orders of magnitude from to more than 3000 km s-1 (i.e., Shepherd & Churchwell 1996; Chlebowski & Garmany 1991). Once the shock speeds of the outflows begin to exceed 40 km s-1, H2 starts to become collisionally dissociated (Pineau des Forêts et al. 2001).
4.2 Methanol masers as tracers of outflow?
Since there is little alternate wavelength information on outflows for these sources, it begs the question: Are these H2 sources outflow signatures? The non-random distribution of H2 sources with respect to the methanol masers suggests a physical link between the two, however the general appearance of the H2 emission in these fields does not look very much like the collimated structures of Herbig-Haro objects and H2 emission seen coming from lower mass young stars (i.e. Davis & Eislöffel 1995, Eislöffel 2000). The exception is G320.23-0.28, which has H2 distributed in a bipolar morphology with respect to the maser location, and the western “lobe” of H2 appears cometary shaped. This H2 emission is exactly parallel with the maser distribution.
There exists some other evidence that linearly distributed methanol masers have outflows parallel to their position angles. The observations of Walsh, Lee & Burton (2002) of G323.74-0.26 also show extended shock excited H2 emission apparently coming from the region of two methanol maser groups. The more pronounced of these two maser groups, G323.740-0.263, is linearly distributed with a position angle consistent with being parallel to the distribution of H2 emission. Furuya et al. (2002) have observations of G24.78+0.08 that show 12CO(1–0) in a bilobed outflow parallel to, and centered on, the linearly distributed methanol masers there. Furthermore, observations of G318.95-0.20 (Minier, Wong & Burton in prep.) using HCN show a bilobed outflow situated more or less north-south and consistent with being parallel with the methanol maser distribution that the outflow is centered on.
These other observations, along with the results present in this paper, not only make a good case against linearly distributed methanol masers being associated with circumstellar disks, they hint at the possibility that the masers are instead more directly associated with the outflows from these sources. This can be argued simply on the grounds that the outflow tracers seem to be preferentially closer to parallel with the methanol maser distribution angles. Furthermore, it would appear (with the possible exception of G313.77-0.86) that the methanol masers are associated with some process near the center of the outflows.
There are several possibilities as to what exactly the methanol masers would trace if they are associated with outflows. Looking to H2O masers, one sees that they are found to be excited in shocks of protostellar jets in close proximity ( AU) to young low-mass stars (i.e., Claussen et al. 1998, Patel et al. 1999). Perhaps methanol masers are excited in protostellar jets from high mass stars in a similar way. In the case of H2O masers tracing the jets of low-mass stars, proper motions of the masers have been measured, for instance, in W3(H2O) by Alcolea et al. (1992), clearly indicating that the masers are indeed associated with a radio jet and are moving along the jet away from the central star. The only proper motion study to date of methanol masers is of G9.62+0.19 (Minier et al. 2000b) which showed proper motions consistent with the masers existing in a wide-angled outflow. Another place that H2O masers are thought to be found is along the working surfaces at the side interfaces of the jet with the surrounding ambient gas (i.e. Strelnitski et al. 2002, and references therein). In this case, one might expect, therefore to see methanol masers preferentially in ‘X’ or ‘V’ shapes, instead of straight lines. Looking at very high resolution (1 mas) structure of methanol maser sites, Minier, Conway & Booth (2001) find W75N has masers all within a conical structure. Minier et al. (2000b) argues the methanol masers of W75N are at a similar position angle as the outflow from this source and are likely to be outflow related. Furthermore, the methanol masers of G31.28+0.06, S 231, and Mon R2 as seen by Minier et al. (2000a) have a well-defined V-shapes. This V-shape is also present with NGC 7538, however this is the site of perhaps two separate maser sites.
4.3 Young massive stars and circumstellar disks
The idea that methanol masers might exist in circumstellar disks around massive stars has generated a lot of interest in the hypothesis. Several authors have performed research to test this hypothesis (i.e. Phillips et al. 1998; Walsh et al. 1998, 1999, 2001; De Buizer et al. 2000, Minier et al. 2000a; Lee et al. 2001) and all have found their data consistent with the hypothesis. However, though the data was consistent, it was by no means conclusive. The work presented here is the first data that seemingly contradicts the hypothesis that linearly distributed methanol masers are generally found in circumstellar disks.
However, these observations can be said to be indirect proof that massive stars do have circumstellar disks. If the H2 emission seen in these sources is outflow related, then outflow implies a disk exists to feed the central star and collimate the outflow. Though in the case of outflows from massive stars, the opening angles can be larger than 90°, and thus do not need much collimation. Such large opening angle could encompass all of the H2 sources in G308.918+0.123 (Figure 2), for instance. These large opening angles may hint to the fact that circumstellar accretion disks may not be necessary for the collimation of outflows in massive stars.
A high mass star with outflow has been observed in detail with no detection of an inner accretion disk (i.e. Feldt et al. 1999). The association between outflow and accretion for massive stars has thus been questioned. There are several possibilities to explain this problem, including: 1) The collimation may be achieved through pressure confinement of a larger-scale equatorial torus or envelope of dense gas (Feldt et al. 1999); 2) Circumstellar disks do exist for a time collimating an outflow and then dissipate leaving remnants of the outflow that are later detected; or 3) High mass stars do not generally form via accretion and so there should be no accretion disks. In this last case, outflows from the massive stellar sources that are observed would have to be explained in some other way. A possibility could come from “circulation models” (see Shepherd 2003, and references within) where material in the surrounding molecular cloud is gravitationally attracted to a massive stellar core and is diverted at large radii into mass loss through the magnetic poles. This model can account for the large mass loss observed in outflows from massive stars, as well as the large opening angles with no need for an accretion disk.
4.4 Methanol masers in the evolutionary sequence of massive star formation
Much work has been done to try to fit masers of all species into some sort of evolutionary sequence. Some argue that H2O masers are signposts for the earliest phases of star formation because they seem to be associated with hot molecular cores (HMCs; Cesaroni et al. 1994). These HMCs are seen in ammonia emission and are thought to be an extremely young and heavily embedded stage of massive star formation. Because of extinction, they have no visible or near-infrared emission. In fact, they are so deeply embedded that it has been difficult to observe mid-infrared emission from any of these sources as well (De Buizer 2003; De Buizer et al. 2002b). Furthermore, these massive stars are so young that they have no detectable radio continuum emission either.
However, still others believe that methanol masers trace these earliest stages of massive star formation (e.g. Walsh et al. 1998). This argument comes from the fact that only 20% of the sites of methanol maser emission in Walsh et al. (1998) are associated with radio continuum emission. Also these UC HII regions are generally compact and small and it is argued that this is evidence for the youth of the UC HII stage. However, this can also be said to be at the same time an argument in favor of the idea (De Buizer et al. 2000; Phillips et al. 1998) that methanol masers may be generally associated with less-massive stars, say B1-B4 spectral types, because these types of stars would have no UC HII regions or small UC HII regions due to the low ionization rates of these stars. Lee et al. (2001) argue that methanol masers are also seen in some known HMCs and therefore add evidence to the idea of methanol masers existing in the early stages of massive star formation. They argue that methanol masers begin to show up sometime during the accretion phase of the star and turn off when the UC HII region begins to expand.
Table 1 lists for each maser location the presence of radio continuum emission and near-infrared emission directly coincident with the masers (within the astrometrical accuracy). Assuming that all of the stellar sources exciting methanol maser emission are more massive than B3 (a point in debate, see for instance Lee et al. 2001; De Buizer et al. 2000; Phillips et al. 1998), then massive stars with no radio continuum emission and no near-infrared emission are thought to be at a much earlier stage of formation than stars with both radio and near-infrared continuum emission. Interestingly, in this survey 8 sources are found to have neither type of emission and 7 are found to have both type of emission. This implies that there is an almost equal number of methanol masers at very early and embedded times as there is when the massive stars have evolved enough to dissipate their placental envelopes and be seen by their radio emission and near-infrared emission. A good example of methanol masers existing at much later stages of stellar formation is NGC 6334F (De Buizer et al. 2002c), where the methanol masers exist near a young massive star (or stars) with an evolved and extended UC HII region.
There is some dispute whether one would see near-infrared emission before radio emission from these embedded massive stellar sources. However, maser sources with near-infrared emission but no radio emission are twice as common in this survey (8 sources) than sources with radio emission but no near-infrared emission (4). Simplified radiative transfer models show that one can get near-infrared emission without radio continuum emission in the earliest embedded stages of O-type stellar formation (Testi et al. 1998). However, while such models may explain the existence of dust reprocessed 2 emission, many near-infrared sources associated with methanol masers have been found to have stellar photospheric emission observed in H (1.65 ) and even J (1.25 ) bands (Walsh et al. 1999). It is quite possible that the maser sources with near-infrared emission but no radio emission are stellar sources with a lower, non-ionizing, spectral type than B3 (De Buizer et al. 2000).
In light of this, and all of the available information on H2O masers, OH masers, and methanol masers that exist, one thing is certain: methanol masers, and masers in general, form in a wide variety of locations and during a variety of stellar phases. It seems gross generalizations about when in the star formation process a certain species of maser turns on and off may be an effort in vain. The only thing for certain about maser formation is that masers will form where the conditions are right for them to form. In reality, the near-stellar region around forming stars (massive stars especially) are diverse and dependent on many environmental variables. This diversity is reflected in the variety of circumstances and locations we observe masers to exist. In general, therefore, masers do not have to exist exclusively at certain stages or with certain processes. What is known for sure is that masers of all kinds are indeed associated with star formation, and that all of these masers appear to exist at many stages of stellar formation. Furthermore, there is evidence now that masers are linked to a variety of processes, such as disks, outflows, and shock fronts.
5 Conclusions
The purpose of these observations was to try to test the hypothesis that linearly distributed methanol masers exist in, and directly delineate, circumstellar disks by searching for shock excited H2 outflow signatures perpendicular to the methanol maser position angle. Surprisingly, H2 emission was found to be perpendicular to the methanol maser distribution angle in only 2 of the 28 sources observed (7%). Furthermore, of the maser locations observed to have H2 emission, the majority have H2 emission found to be dominantly distributed at a position angle within 45°of being parallel to the maser position angle. This non-random distribution suggests that there is a physical link between the H2 emission and the masers in general. The fact that H2 is predominantly parallel to the methanol masers further contradicts the circumstellar disk hypothesis of methanol masers.
H2 emission can also be due to UV florescence, so for any one source in this survey, follow-up observations (in say, 12CO or HCN) would be needed to confirm if the H2 is from outflow directly related to the stellar source exciting the masers. Observations by other authors of a small number of linearly distributed methanol maser sources lend agreement to the idea that the H2 from these sources may indeed be shock excited in outflows parallel to the methanol maser distributions. A likely explanation for all of this is that at least some linearly distributed methanol masers may be directly associated with outflows. The methanol masers appear to be located coincident with a stellar source at the center of the outflows in most cases. Perhaps the masers trace the jets or outflow surfaces near the central (proto-)stellar source. The overall morphology and bipolar nature of the H2 emission from G320.23-0.28 makes it the best candidate from this survey for further observations in disproving the circumstellar disk hypothesis and establishing the possible link between methanol masers and outflow.
The large number (13/28) of non-detections of H2 from these sites (including sites with H2 but unrelated to outflow), also adds doubt to the general presence of circumstellar accretion disks around young massive stars since the disks are thought to be directly responsible for collimating the outflows. Models have been developed that can describe the outflows that are observed from massive stars without the need for accretion disks. The next generation of sub-millimeter and millimeter telescopes (ALMA and SMA) will be needed to conclusively prove whether or not massive stars have, as a general property, circumstellar disks when they form. Until then, it may be uncertain if massive stars form via accretion like low mass stars.
It was pointed out in the discussion that masers of all species will form wherever the conditions are right for them to form. Therefore trying to prove that any maser species is linked to a single process or evolutionary stage of star formation may be futile. Water and hydroxyl masers have been observed to be linked to a variety of processes during the many different early evolutionary stages of stars, and methanol masers are also in reality most likely associated with outflows, disks, and shocks concurrently. Though the sample size is small, a result of this survey is that methanol masers are just as likely to exist in the earliest stages of star formation when the star is very embedded as when the massive star is well into the stages when its UC HII regions has developed and expanded.
Acknowledgments
Many thanks are given to J. T. Radomski for his critical reading of the manuscript. I would also like to thank the anonymous referee for several suggestions that improved the quality of the paper. Astrometry was performed in part with the help of Aladin, developed by CDS, Strasbourg, France.
References
- [\citeauthoryearAlcolea et al.1992] Alcolea J., Menten K. M., Moran J. M., Reid M. J., 1992, in Clegg A. W., Nedoluha, G. E., eds, Astrophysical Masers. Springer-Verlag, Heidelberg, p. 225
- [\citeauthoryearBonnell, Bate & ZinneckerBonnell et al.1998] Bonnell I. A., Bate M. R., Zinnecker H., 1998, MNRAS, 298, 93
- [\citeauthoryearBurton1992] Burton M. G., 1992, Aust. J. Phys., 45, 463
- [\citeauthoryearCaswell1998] Caswell, J. L., 1998, MNRAS, 297, 215
- [\citeauthoryearCaswell et al.1995] Caswell J. L., Vaile R. A., Ellingsen S. P., Whiteoak J. B., Norris R. P., 1995, MNRAS, 272, 96
- [\citeauthoryearCesaroni et al.1994] Cesaroni R., Churchwell E., Hofner P., Walmsley C. M., Kurtz S., 1994, A&A, 288, 903
- [\citeauthoryearChlebowski & Garmany1991] Chlebowski T., Garmany, C. D., 1991, ApJ, 368, 241
- [\citeauthoryearClaussen et al.1998] Claussen M. J., Marvel K. B., Wootten A., Wilking B. A., 1998, ApJ, 507, L79
- [\citeauthoryearDavis & Eislöffel1995] Davis C. J., Eisloeffel J., 1995, A&A, 300, 851
- [\citeauthoryearDe Buizer2001] De Buizer J. M., 2001, in Garzón F., Eiroa C., de Winter D., Mahoney T. J., eds, ASP Conf. Ser. 219, Disks, Planetesimals, and Planets. ASP, San Francisco, p. 162
- [\citeauthoryearDe Buizer2003] De Buizer J. M., 2003, in De Buizer, J. M., van der Bliek, N. S., eds, ASP Conf. Ser. 287, Galactic Star Formation Across the Stellar Mass Spectrum. ASP, San Francisco, p. 230
- [\citeauthoryearDe Buizer, Pina & TelescoDe Buizer et al.2000] De Buizer J. M., Piña R. K., Telesco, C. M., 2000, ApJS, 130, 437
- [\citeauthoryearDe Buizer et al.2002a] De Buizer J. M., Walsh, A. J. Piña R. K., Phillips C. J., Telesco C. M., 2002a, ApJ, 564, 327
- [\citeauthoryearDe Buizer et al.2002b] De Buizer J. M., Watson A. M., Radomski J. T., Piña R. K., Telesco C. M., 2002b, ApJ, 564, L101
- [\citeauthoryearDe Buizer et al.2002c] De Buizer J. M., Radomski J. T., Piña R. K., Telesco C. M., 2002c, ApJ, 580, 305
- [\citeauthoryearEislöffel2000] Eislöffel J., 2000, A&A, 354, 236
- [\citeauthoryearEllingsen, Norris & McCullochEllingsen et al.1996] Ellingsen S. P., Norris R. P., McCulloch P. M., 1996, MNRAS, 279, 101
- [\citeauthoryearFeldt et al.1999] Feldt M., Stecklum B., Henning Th., Launhardt R., Hayward T. L., 1999, A&A, 346, 243
- [\citeauthoryearForster & Caswell2000] Forster J. R., Caswell J. L., 2000, ApJ, 530, 371
- [\citeauthoryearFuruya et al.2002] Furuya R. S., Cesaroni R., Codella C., Testi L., Bachiller R., Tafalla M., 2002, A&A, 390, L1
- [\citeauthoryearHofner & Churchwell1996] Hofner P., Churchwell C., 1996, A&AS, 120, 283
- [\citeauthoryearKumar, Bachiller & DavisKumar et al.2002] Kumar M. S. N., Bachiller R., Davis C. J., 2002, ApJ, 576, 313
- [\citeauthoryearLee et al.2001] Lee J.-K., Walsh A. J., Burton M. G., Ashley M. C. B., 2001, MNRAS, 324, 1102
- [\citeauthoryearMcKee & Tan2002] McKee C. F., Tan, J. C., 2002, Nature, 416, 59
- [\citeauthoryearMcKee, Chernoff & HollenbachMcKee et al.1982] McKee C. F., Chernoff D. F., Hollenbach D. J., 1982, in Kessler M. F., Phillips J. P., eds, Proc. of the XVIth ESLAB Symp. 108, Galactic and Extragalactic Infrared Spectroscopy. Reidel, Dordrecht, p. 103
- [\citeauthoryearMinier, Booth & ConwayMinier et al.2000a] Minier V., Booth R., Conway J. E., 2000a, A&A, 362, 1093
- [\citeauthoryearMinier, Booth & ConwayMinier et al.2000b] Minier V., Booth R., Ellingsen S. P., Conway J. E., Pestalozzi M. R., 2000b, in Conway J. E., Polatidis A. G., Booth R. S., Pihlström Y. M., eds, Proc. of the 5th European VLBI Network Symposium, EVN Symposium 2000. Onsala Space Observatory, Onsala, p. 179
- [\citeauthoryearMinier, Conway & BoothMinier et al.2001] Minier V., Conway J. E., Booth R., 2001, A&A 369, 278
- [\citeauthoryearNorris et al.1993] Norris R. P., Whiteoak J. B., Caswell J. L., Wieringa M. H., Gough R. G., 1993, ApJ, 412, 222
- [\citeauthoryearNorris et al.1998] Norris R. P., Byleveld S. E., Diamond P. J., Ellingsen S. P., Ferris R. H., Gough R. G., Kesteven M. J., McCulloch P. M., Phillips C. J., Reynolds J. E., Tzioumis A. K., Takahashi Y., Troup E. R., Wellington K. J., 1998, ApJ, 508, 275
- [\citeauthoryearOliva & Moorwood1986] Oliva E., Moorwood A. F. M., 1986, A&A, 164, 104
- [\citeauthoryearOsterloh, Henning & LaunhardtOsterloh et al.1997] Osterloh M., Henning Th., Launhardt R., 1997, ApJS, 110, 71
- [\citeauthoryearPatel et al.1999] Patel N. A., Greenhill L. J., Herrnstein J. R., Zhang Q., Moran J. M., Ho P. T. P., Goldsmith P. F., 1999, in Nakamoto T., ed, Star Formation 1999. Nobeyama Radio Observatory, Nagoya, p. 300
- [\citeauthoryearPhillips et al.1998] Phillips C. J., Norris R. P., Ellingsen S. P., McCulloch P. M., 1998, MNRAS, 300, 1131
- [\citeauthoryearPineau des Forêts et al.2001] Pineau des Forêts G., Flower D.R., Aguillon F., Sidis V., Sizun M., 2001, MNRAS, 323, L7
- [\citeauthoryearShepherd2003] Shepherd D. S., 2003, in De Buizer, J. M., van der Bliek, N. S., eds, ASP Conf. Ser. 287, Galactic Star Formation Across the Stellar Mass Spectrum. ASP, San Francisco, p. 333
- [\citeauthoryearShepherd and Churchwell1996] Shepherd D. S., Churchwell E., 1996, ApJ, 457, 267
- [\citeauthoryearShu, Adams & LizanoShu et al.1987] Shu F. H., Adams F. C., Lizano S., 1987, ARAA, 25, 23
- [\citeauthoryearSmith1994] Smith M.D., 1994, MNRAS, 266, 238
- [\citeauthoryearStecklum & Kaufl1998] Stecklum B., Kaufl H., 1998, ESO Press Release PR 08/98
- [\citeauthoryearStrelnitski et al.2002] Strelnitski V., Alexander J., Gezari S., Holder, B. P., Moran J. M., Reid M. J., 2002, astro-ph/0210342
- [\citeauthoryearTesti et al.1998] Testi L., Felli M., Persi P., Roth M., 1998, A&A, 329, 233
- [\citeauthoryearVinković et al.2000] Vinković D., Miroshnichenko A., Ivezić Ž., Elitzur M., 2000, in Sitko M. L., Sprague A. L., and Lynch D. K., eds, ASP Conf. Ser. 196, Thermal Emission Spectroscopy and Analysis of Dust, Disks, and Regoliths. ASP, San Francisco, p. 71
- [\citeauthoryearWalsh et al.1998] Walsh A. J., Burton M. G., Hyland A. R., Robinson G., 1998, MNRAS, 301, 640
- [\citeauthoryearWalsh et al.1999] Walsh A. J., Burton M. G., Hyland A. R., Robinson G., 1999, MNRAS, 309, 905
- [\citeauthoryearWalsh et al.2001] Walsh A. J., Bertoldi F., Burton M. G., Nikola T., 2001, MNRAS, 326, 36
- [\citeauthoryearWalsh, Lee & BurtonWalsh et al.2002] Walsh A. J., Lee J.-K., Burton M. G., 2002, MNRAS, 329, 475