The post-outburst photometric behaviour of V838 Mon
Abstract
The unusual eruptive variable discovered in Monoceros in 2002 January underwent dramatic photometric and spectroscopic changes in the months prior to its 2002 June–August conjunction with the Sun. Optical and infrared (IR) photometry obtained at the South African Astronomical Observatory (SAAO) between 2002 January and June (JD ) is presented here in an analysis of the star’s post-outburst behaviour. The light curve indicated 3 eruptions took place in 2002 January, February and March. SAAO échelle spectra obtained in the week prior to the March maximum indicated the ejection of a new shell of material. JHKL photometry obtained during 2002 April showed the development of an IR excess due to the formation of a dust shell. The shell appears to be largely responsible for the rapid fade in the optical flux during 2002 April–May ( mag within 3 weeks). Blueing of the optical colours during the decline is likely due either to the revealing of an emission line region surrounding V838 Mon, or the unveiling of the progenitor or a spatially-close early-type star.
keywords:
stars: individual: V838 Mon — stars: variables: other — stars: winds: outflows1 Introduction
Eruptive stellar events provide rare opportunities to test and refine theoretical models, particularly those involving short-lived evolutionary phases. These brief episodes afford valuable insight into the physical changes that stars undergo when transforming from one state to another. V4334 Sgr (better known as Sakurai’s Object; Duerbeck et al. 2000) is the best recent example of such a variable. The star was ‘caught in the act’ as it underwent a late helium shell flash in 1996 and has shown the evolution of post-AGB stars passing through this phase to be faster than theory predicted (Iben et al. 1983). The wealth of information gathered from this event demonstrated the value of intensive multi-wavelength monitoring of rapidly-evolving variable stars for improving our understanding of the late stages of stellar evolution. With similar motivations, the peculiar nova-like object in Monoceros (now known as V838 Mon) has been observed regularly since it was reported in outburst in 2002 January (Brown 2002) until its conjunction with the Sun in 2002 June.
A possible progenitor for V838 Mon was identified as a star by Munari et al. (2002) from POSS-I plates and the 2MASS IR sky survey. The spectral energy distribution derived from these data suggest the progenitor was possibly an F-type star with moderate interstellar reddening [() mag]. In the months following the outburst, optical and IR light curves were obtained for V838 Mon across a broad ( d) maximum that was complex in nature, suggesting multiple outburst events. Assuming the F-star was the progenitor, the amplitude of the initial outburst was mag and comparison between 1997 2MASS data and 2002 January SAAO IR data shows JHK magnitudes brightened by mag. The amplitude from quiescence to maximum was almost 10 magnitudes in both the optical and IR. Spectroscopically the star appeared to transform from a mid-K type giant into a late-M supergiant between 2002 January and May (Munari et al. 2002). The Balmer series, Na I D lines and various low ionisation species exhibited P-Cygni profiles during the various maxima, while at other times H showed either pure absorption or pure emission. CCD imaging revealed a light-echo beginning to expand around the star about two weeks after the February maximum (Henden, Munari & Schwartz 2002) and subsequent observations have shown the reflection nebula continuing to grow in size and evolve in form.
Early studies of V838 Mon likened it to classical novae, final helium shell flash stars such as Sakurai’s Object, a mysterious eruptive variable in M31 and the ‘unusual luminous red variable’ V4332 Sgr (Munari et al. 2002). While it has certain properties in common with each of these classes or individual objects, departures from their characteristics are significant and the nature of V838 Mon remains unclear. On-going monitoring of this object is a priority given the dramatic changes observed during the six months following the initial outburst.
Optical and IR photometry of V838 Mon was obtained with several SAAO telescopes between 2002 January and June. Multi-filter CCD images of the expanding light-echo were also obtained with the SAAO 1.0-m telescope during this time, as well as post-conjunction. These data will be presented elsewhere (Crause et al. in preparation)111(VRI ) colour images were produced from these data; see the Astronomy Picture of the Day website at http://antwrp.gsfc.nasa.gov/apod/ap021003.html. in a discussion of the star’s distance. In this paper we present the SAAO photometry, merged with visual estimates obtained by one of us (AFJ) and optical/IR photometry reported previously by Munari et al. (2002).
2 Observations and Data Reduction
Cousins UBVRI optical photometry was obtained with the SAAO 0.5-m and 1.0-m telescopes. Aperture photoelectric photometry was performed for all 0.5-m data, while most of the 1.0-m observations were made with the 1k 1k STE4 CCD.
The aperture photometry was reduced with standard SAAO software, with the measurements of V838 Mon calibrated against Cousins E-region standards. The CCD frames were bias-subtracted, overscan-trimmed and flat-fielded using the ccdproc package within IRAF. The clean images were then reduced with the phot package in which one is able to specify the extraction radius to exclude the nebula from the aperture. Although the nebula was not present in CCD frames obtained in 2002 January, these data were reduced in the same way as later images for consistency. A set of comparison stars was measured in each frame and calibrated against Landolt equatorial standards observed on the 3 best nights of the 2002 April-May observing run. A mean magnitude was calculated for each of the comparison stars and these were then used to calibrate the differential magnitudes determined for V838 Mon. Finally the colour equation for the STE4 CCD was applied to produce the magnitudes and colours presented in Table 1, however the extreme post-maximum colours [() and () ] required large extrapolations for the standard transformations.
| JD–2452000 | () | () | () | () | |
|---|---|---|---|---|---|
| 289.388 | 9.72 | 2.01 | – | – | 2.22 |
| 290.436 | 9.94 | 1.71 | 1.82 | 0.93 | 1.85 |
| 293.419 | 10.40 | 1.82 | 2.02 | 0.99 | 1.92 |
| 294.401 | 10.12 | 1.82 | 1.97 | 0.98 | 1.92 |
| 295.417 | 10.12 | 1.79 | 1.96 | 0.97 | 1.91 |
| 311.300 | 6.87 | 1.08 | 0.22 | 0.70 | 1.45 |
| 311.427 | 6.84 | 1.07 | 0.22 | 0.70 | 1.45 |
| 313.285 | 7.00 | 1.13 | 0.45 | 0.70 | 1.46 |
| 314.296 | 7.21 | 1.16 | 0.62 | 0.70 | 1.47 |
| 315.350 | 7.41 | 1.18 | 0.68 | 0.70 | 1.47 |
| 316.284 | 7.58 | 1.22 | 0.74 | 0.72 | 1.49 |
| 316.289 | 7.58 | 1.22 | 0.74 | 0.71 | 1.49 |
| 318.422 | 7.80 | 1.33 | – | 0.79 | 1.60 |
| 319.398 | 7.84 | 1.40 | – | 0.81 | 1.64 |
| 320.458 | 7.87 | 1.47 | – | 0.84 | 1.68 |
| 321.368 | 7.90 | 1.56 | – | 0.84 | 1.70 |
| 326.408 | 8.00 | 1.81 | 1.32 | 0.98 | 1.94 |
| 327.321 | 8.03 | 1.86 | 1.35 | 1.01 | 1.98 |
| 331.304 | 8.16 | 2.04 | 1.56 | 1.08 | 2.09 |
| 335.279 | 7.96 | 1.96 | 1.59 | 1.04 | 2.04 |
| 336.296 | 7.83 | 1.89 | 1.53 | 1.02 | 1.99 |
| 337.376 | 6.26 | 1.85 | 1.50 | 0.99 | 1.92 |
| 389.317 | 11.75 | 2.18 | 1.68 | 2.49 | 6.12 |
| 390.236 | 12.19 | 2.14 | 1.52 | 2.61 | 6.00 |
| 392.226 | 13.04 | 2.02 | 1.16 | 2.90 | 6.49 |
| 393.313 | 13.36 | – | – | 3.05 | 6.70 |
| 395.269 | 13.90 | 1.76 | 0.88 | 3.01 | 6.86 |
| 396.241 | 14.28 | 1.66 | – | 3.16 | 7.12 |
| 397.241 | 14.49 | 1.57 | – | 3.18 | 7.16 |
| 398.231 | 14.65 | 1.46 | – | 3.16 | 7.23 |
| 399.227 | 14.83 | 1.38 | – | 3.18 | – |
| 428.224 | 16.17 | – | – | 2.22 | 6.70 |
JHKL photometry was obtained with the IRP Mark II photometer on the SAAO 0.75-m telescope. These data were reduced with standard SAAO software, placing the magnitudes on the Carter (1995) system. Most of the observations made during 2002 January and February were presented by Munari et al. (2002). Subsequent observations, as well as an additional set of measurements made in January, are listed in Table 2. The typical uncertainty is 0.02 mag for the JHK data and 0.05 mag for the L-band observations.
Visual observations of V838 Mon were obtained from soon after the initial report of the outburst during 2002 January until the star’s conjunction with the Sun. The visual estimates are in agreement at the 0.2 mag level with contemporaneous photoelectric and CCD measurements at times when the colour of the variable was not extreme or rapidly varying. Once the star began to fade and redden during April–May, both the uncertainty of the estimates and the discrepancy with the photoelectric photometry increased; see Section 3.5.
| JD–2452000 | J | H | K | L |
|---|---|---|---|---|
| 287.502 | 6.79 | 6.15 | 5.91 | 5.55 |
| 347.328 | 4.02 | 3.36 | 3.03 | 2.70 |
| 348.306 | 4.03 | 3.36 | 3.02 | 2.66 |
| 395.226 | 4.95 | 3.99 | 3.49 | 2.63 |
| 395.233 | 4.95 | 3.99 | 3.48 | 2.63 |
| 396.242 | 4.99 | 4.02 | 3.51 | 2.65 |
| 425.181 | 6.00 | 4.71 | 3.87 | 2.92 |
| 426.176 | 6.04 | 4.75 | 3.89 | 2.92 |
| 429.179 | 6.14 | 4.79 | 3.92 | 2.92 |
3 Photometric Analysis
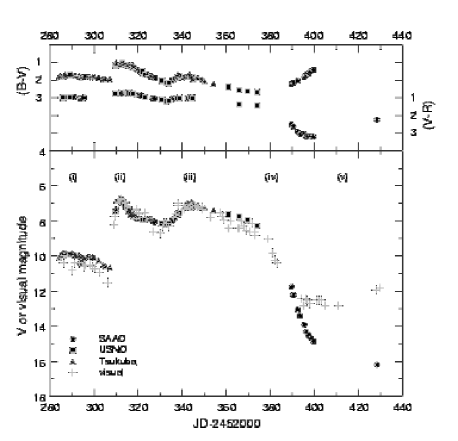
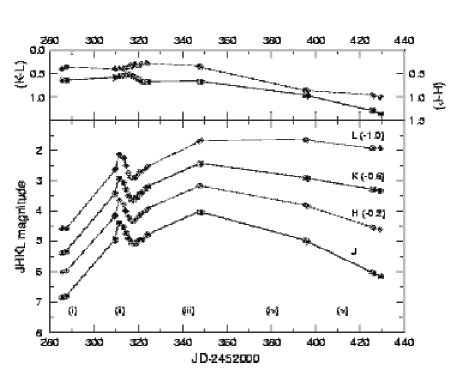
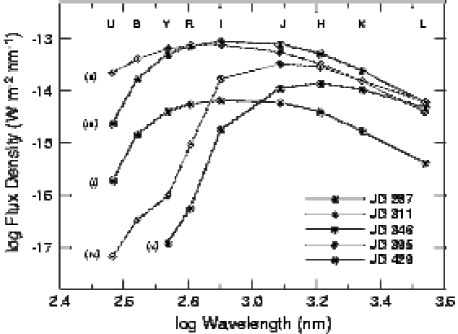
Optical and IR light and colour curves (Figs 1 and 2), as well as colour-magnitude and colour-colour diagrams (Figs ) illustrate the complex photometric behaviour of V838 Mon from 2002 January to June (JD ). The optical data consist of observations from SAAO, as well as those obtained with the 1.0-m telescope at the United States Naval Observatory (USNO), those from a 0.25-m telescope in Tsukuba, Japan (Munari et al. 2002), and AFJ’s visual estimates. The -band Tsukuba observations are shown with a mag offset applied so that these data agree with the SAAO and USNO -band photometry. All IR data are from the SAAO 0.75-m telescope.
The Julian dates of key events in the light curve are given in abbreviated form (JD) throughout the remainder of the text. The principal stages in the light curve are described below and are labelled (i) through (v) in each figure: (i) is centred near JD 290 (mid-January) when the brightness peaked for the first time; (ii) covers the interval JD , including the February maximum that occurred on JD 311; (iii) covers JD including the March peak on JD 345; (iv) spans JD to include the April fade and (v) is from JD 400 (early-May) until V838 Mon’s conjunc tion with the Sun in June when the star was at its faintest.
3.1 (i) Initial Peak
The progenitor of V838 Mon is believed to have had a V magnitude of (Munari et al. 2002). Applying the reddening of given by Kimeswenger et al. (2002) and using a distance of 2.3–2.5 kpc determined from the expansion of the light echo (Bond et al. 2002, Crause et al. in preparation) rather than the 790 pc derived by Munari et al., we find M. This brighter progenitor absolute magnitude is inconsistent with the ‘under-luminous F main sequence star’ proposed by Munari et al. The nova-like 2002 January eruption that led to the star’s discovery (Brown 2002) reached (M) by JD 285.
It soon became apparent that the star was not a typical classical nova; spectra showed unusually weak Balmer lines (Wagner, Halpern & Jackson 2002), ejection velocities were of the order of 350 km s-1 and the post-outburst decay was uncharacteristically slow. Such low velocities are usually associated with slow novae (Allen 1980) and are expected in post asymptotic-branch giant branch stars undergoing a late thermal pulse (Iben et al. 1983), leading to early speculation (Della Valle & Iijima 2002; Henden et al. 2002; Rauch, Kerber & van Wyk 2002) that the star may be similar to ‘born again’ stars such as Sakurai’s Object and V605 Aql.
3.2 (ii) Maximum Outburst
Instead of continuing to decrease in brightness after the January maximum, V838 Mon suddenly began a second outburst on 2002 February 3 (JD 309). Brightening by mag hr-1 for 2 days (AAVSO and VSNET observations), the star peaked at on February 5, corresponding to M. The now hotter star ( K according to Kimeswenger et al. 2002) produced the blue maximum seen in the optical and IR colour curves; however we note a lag of 4 days between the optical maximum and the peak in the () colour. The latter may be related to the appearance of the second overtone 12CO () absorptions in the H-band (Banerjee & Ashok 2002). Over the 3 weeks following the maximum the star faded to while the () colour reddened by magnitudes.
A spectrum obtained just before the February outburst was classified by Zwitter & Munari (2002) as that of a ‘heavily reddened cool K-type star’. At maximum, spectra were dominated by narrow P-Cygni profiles and the Balmer lines, particularly H, had increased in strength (Iijima & Della Valle 2002). This eruption also resulted in a light-echo that was first observed on 2002 February 17 (JD 323; Henden et al. 2002).
3.3 (iii) March Peak
In early March, V838 Mon brightened for a third time, peaking at on 2002 March 11 (JD 345) and producing another blue maximum in the () colour curve. Comparison between curve-(iii) and curve-(ii) in Fig. 6 shows the star fading in the optical but remaining bright at IR wavelengths, the lag noted in Section 3.2. Throughout the remainder of March and early-April the star again faded, more gently than after the previous two outbursts, and the optical colours reddened again (see Fig. 1).
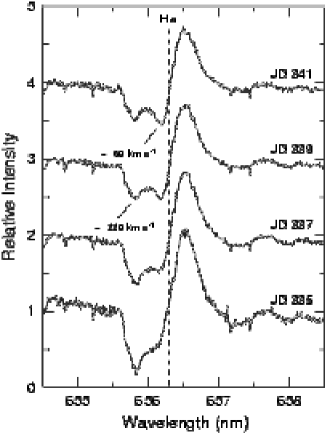
Sample high-resolution spectra obtained with the SAAO fibre-fed échelle spectrograph on the 1.9-m telescope (resolution ; Crause et al. in preparation) during the week prior to this maximum are shown in Fig. 7. As the spectra are yet to be corrected for the star’s radial velocity, features are described relative to the rest wavelength of H. The original P-Cygni profile that appeared during the February outburst steadily weakened and is seen to distort as a second lower-velocity absorption feature developed km s-1 blueward of the rest wavelength of H. This profile appears to indicate the ejection of a new shell of material, despite the relatively low amplitude ( ) of this eruption. Part of the February absorption component can still be seen km s-1 blueward of this new feature. JHK spectra obtained just prior to the March maximum were reported by Geballe et al. (2002) to show a combination of CO absorption and emission, indicating both photospheric and circumstellar components.
3.4 (iv) IR Excess Development and Reddening
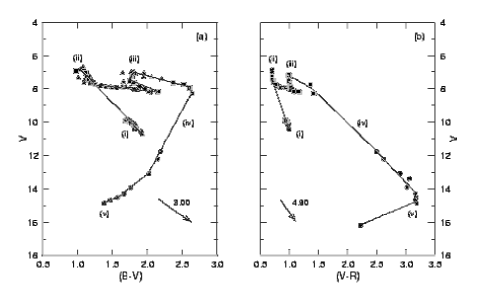
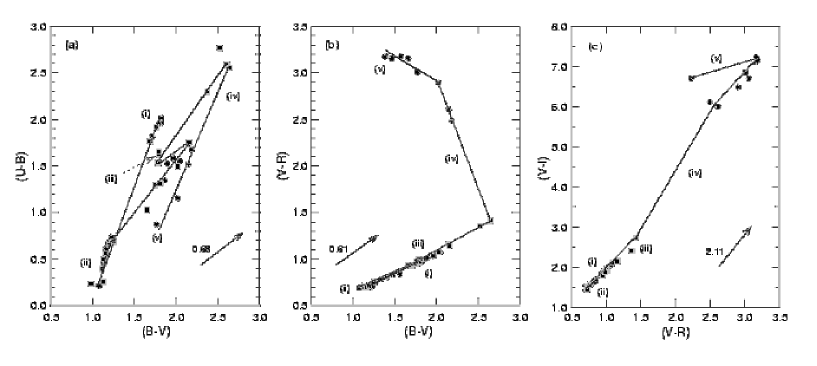
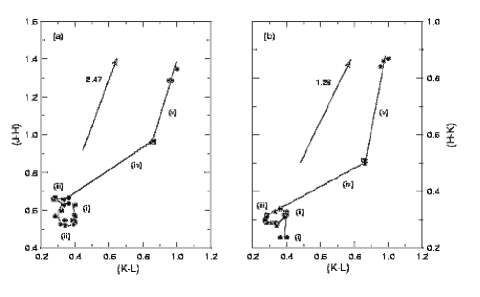
From mid-April (JD ) V838 Mon began a sharp decrease in brightness, fading mag within 3 weeks. The () and () colours reddened significantly (by and 4.0 mag, respectively) while the () colour showed a strong blueward trend [() mag; also see Section 4.2 for a discussion of the origin of the blue excess]. The latter is best seen in the ()/ colour-mag diagram (Fig. 3a) where the movement in the () colour was nearly perpendicular to the reddening vector, as well as in in Fig. 4(a) which shows the evolution in the ()/() colour-colour plane. Curve-(iv) in Fig. 6 also clearly shows the development of a blue excess. The ()/() plane (Fig. 4b) shows the combination of a blueing () and a redward-moving () while in the ()/ and ()/() diagrams (Figs 3b and 4c, respectively) the trend in the colours during the decline is similar to pure reddening. The change in the spectral type of the star from mid- to late-M (Henden et al. 2002) during this time must also be in part responsible for the colour variations. Using the reddening relations of Bessell & Brett (1988) we conclude that reddening accounts for most of the decline phase of the light curve. If we assume the entire change in colour [() mag; see Fig. 4] is due to the effects of reddening then we obtain an upper limit for mag, which is similar to the observed -band amplitude. This value for overestimates the effects of reddening since the star continued to evolve towards later spectral types during the decline. However, as the star was spectral type M5 near the mid-point of the decline (JD 385; Rauch et al. 2002), the intrinsic colour of the star could not have greatly exceeded () at this time (Schmidt-Kaler 1982).
The reddening and dust formation scenario is supported by the IR light and colour curves and colour-colour diagrams. The IR colours shifted redward as the contribution from the star at shorter wavelengths fell away (the - and -band photometry will largely follow the stellar flux) while the magnitude (sensitive to warm circumstellar dust) remained essentially constant. In Fig. 5 we see that, following the loops in the colour-colour diagrams due to lags in the IR colour changes during the three outbursts at maximum, the star reddened rapidly [() = 0.6 mag within 50 days] as it faded. During the decline (stage iv and v), we find the ratio ()/() , which we compare to a ratio of 3.4 given by Bessell & Brett (1988) for the case of reddening alone producing the decline. As we discuss above, reddening appears to be the significant (though not the only) contributor to the light and colour curve behaviour of V838 Mon during the decline from outburst. A lack of IR observations during the fade from maximum prevents us from accurately determining the IR behaviour at this time and so we simply connect the points from JD 347 (the last SAAO IR data obtained at maximum) with those near JD 395 (when the star was ) in Figs 5a and 5b. These lines have slopes of and 0.3, respectively, or only the slope of the reddening vector in these colour-colour planes. This colour behaviour strongly indicates the development of an IR excess during the fade that most affects the - and -band photometry. After accounting for underlying reddening, the additional IR excess due to the dust gives rise to a slope of in Fig. 5b.
Banerjee & Ashok (2002) report complex multicomponent structure in the CO bands during this time and confirm the persistence of both the absorption and emission components noted previously by Geballe et al. (2002). They also identify a number of Ti I emission lines that first appeared in April 9 K-band spectra and use these highly unusual features, produced in the circumstellar ejecta, to estimate the mass of the shell ( to ).
3.5 (v) Deep Decline
Shortly before its June-August conjunction, V838 Mon had faded to . With only VRI photometry available due to the faintness of the star in the and bands, we could not follow the evolution of the blue optical colours, but we note that by this time the () and () colours had also developed a blueward trend [see stage (v) in Figs 1, 3b, 4c and 6].
The star faded slightly in the IR during stage (v), more so at than at . In Fig. 5(a) we see that the star appeared to undergo reddening during this stage, while in Fig. 5(b) the slope was steeper than the reddening vector, implying that the () excess was increasing relative to the () excess. The strong water vapour absorption bands seen at 1.4 and 1.9 m during May (Banerjee & Ashok 2002) may be responsible for these changes. Banerjee & Ashok also note that the Ti I emission lines that appeared in the K-band in early-April peaked in strength during early-May and had decreased by mid-May. While these lines would have influenced the IR colours, without L-band spectra we are unable to assess the effect they had on the colour-colour diagrams in Fig. 5.
The influence of the changing nature of the star on the visual photometry can clearly be seen in stage (v). Visual estimates were substantially brighter than nearby CCD observations, by 4 mag when the star was at its faintest. Since the human eye retains sensitivity beyond the red cutoff of V-band filters, the star’s extreme () colour () resulted in a substantial increase in the perceived visual magnitude above the observed V-band measurements. This effect was likely compounded by the increasing contribution from the light-echo to the integrated flux of the star and nebula, as well as the higher airmass of these observations.
4 Discussion
4.1 The dust
Kimeswenger et al. (2002) reported the presence of a weak 10 m excess that originated prior to the second maximum. This excess increased over the next several month and is consistent with our interpretation of new dust having formed and subsequently cooled. Kimeswenger et al. assume a condensation temperature of 750 K and calculate that dust could form at a distance of km during February when the star was at its hottest. If we assume a velocity of 350 km s-1, material ejected during the February outburst would have reached this distance about 45 days later, suggesting that dust formation could have begun in late March. For a short-lived dust-formation episode with the material being driven away from the cooling star, we expect the dust temperature to decrease rapidly. 2002 September (JD ) data from Watson & Costero (2002) show the mid-IR excess peaking at about 8 m, indicating a dust temperature of about 360 K. To estimate the time it would take for the material to cool to this extent, we make the simple assumption of constant shell luminosity and find that the shell’s radius would have to increase by a factor of . At a velocity of 350 km s-1 this would take about 200 days, leading to JD 555. Since the star’s evolution towards later spectral types would promote cooling, we consider the 200 days to be an upper limit and so JD 555 is in good agreement with the date of the mid-IR observations (JD 535).
4.2 The blue excess
The development of a blue excess when the star rapidly faded resembles the ‘blue decline’ behaviour often seen when R Coronae Borealis (RCB) variables (Clayton 1996) enter an obscuration minimum. In RCB stars this is thought to be the result of a condensing dust cloud eclipsing the photosphere, temporarily revealing a rich ‘chromospheric’ emission line region (Cottrell, Lawson & Buchhorn 1990). A similar mechanism may be responsible for the colour behaviour seen in V838 Mon, although post-conjunction spectroscopy suggests this excess is due to an early-type star (Wagner & Starrfield 2002) which may the ‘progenitor’ reported by Munari et al. (2002) or a spatially-close field star.
4.3 Similar stars
Munari et al. (2002) and Kimeswenger et al. (2002) have discussed the classes or objects that V838 Mon may or may not be related to. Early indications that the star may be a classical nova or a final helium shell flash object now appear to have been ruled out by a number of factors. The current impression is that V838 Mon may belong to a new class of eruptive variables, along with two other poorly-understood, rapidly-evolving red objects known as M31 RV (Rich et al. 1989) and V4332 Sgr (Martini et al. 1999).
V4332 Sgr appears to be the closest analogue of V838 Mon in terms of its general photometric behaviour and rapid redward spectral evolution. This object cooled from 4400 K to 2300 K in three months and the spectral type changed from K3 III-I to M6 III-I in only a week. While the light curve was not multi-peaked, V4332 Sgr was only discovered to be in outburst when it emerged from conjunction with the Sun and so it may too have undergone earlier eruptions. Martini et al. (1999) suggest that a nuclear event in a single star, in which a slow shock drove the photosphere outwards, could have powered the luminosity evolution and the emission spectrum of V4332 Sgr. Such a slow shock could also account for the principal difference between V838 Mon and V4332 Sgr, namely that post-outburst spectra of V4332 Sgr showed inverse P-Cygni profiles, perhaps indicating the infall of previously ejected material.
Kimeswenger et al. (2002) exclude M31 RV from the proposed new class of variables because of the extremely high luminosity (M) this star achieved at maximum, compared to their MV for V838 Mon. If, however, the larger distance estimates for V838 Mon [2.5 and 2.3 kpc respectively by Bond et al. (2002) and Crause et al. in preparation] prove correct, the resulting MV would significantly reduce this difference between M31 RV and V838 Mon. M31 RV was discovered in outburst in 1988 and archival plates show that the red variable exhibited a similar maximum in 1968 (Sharov 1990). This object should thus be monitored towards the end of the decade in the event that it erupts again as periodic outbursts would strongly support a binary scenario. The rapid radial velocity variations (a change of km s-1 in just 8 hr) noted by Rich et al. (1989) should also be anticipated if the star erupts again.
5 Summary
We have presented optical and IR photometry for V838 Mon following the 2002 January outburst until its conjunction with the Sun in June. Optical data show multiple maxima followed by a reddening phase and then a rapid fade which was accompanied by blueing of the () and () colours. The IR colours progressed redward during the decline and indicate a combination of reddening and the development of a () excess during this time. Spectra obtained shortly before the final maximum in March show the ejection of an additional shell of material. The nature of V838 Mon remains unclear, although it appears to be closely related to the unusual V4332 Sgr which showed comparably dramatic evolution in 1994, and may be similar to M31 RV if larger distance estimates prove correct.
Acknowledgements
We thank Nye Evans for his constructive referee’s report, Michael Feast (University of Cape Town) for valuable discussions about these data, Chris Koen (SAAO) for his useful comments on the manuscript, Wolfgang Zima (University of Vienna) for obtaining the échelle data in March, Luis Balona (SAAO) for assistance in reducing the spectra and John Menzies (SAAO) for obtaining the JD 429 photometry. LAC acknowledges support from the National Research Foundation (NRF) through the grant-holder bursary scheme (grant-holder Tony Fairall) and the University of Cape Town. WAL acknowledges research support from UNSW@ADFA Faculty Research Grants and Special Research Grants.
References
- [] Allen D. A., 1980, MNRAS, 192, 521
- [] Banerjee D. P. K., Ashok N. M., 2002, A&A, 395, 161
- [] Bessell M. S., Brett J. M., 1988, PASP, 100, 1134
- [] Bond H. E., Panagia N., Sparks W. B., Starrfield S. G., Wagner R. M., Henden A., 2002, IAU Circ 7943
- [] Brown N. J., 2002, IAU Circ 7785, 1
- [] Carter B. S., 1995, Ap&SS, 230, 163
- [] Clayton G. C., 1996, PASP, 108, 225
- [] Cottrell P. L., Lawson W. A., Buchhorn M., 1990, MNRAS, 244, 149
- [] Della Valle M., Iijima T., 2002, IAU Circ 7786, 1
- [] Desidera S., Munari U., 2002, IAU Circ 7982
- [] Duerbeck H. W., et al., 2000, AJ, 119, 2360
- [] Geballe T. R., Evans A., Smalley B., Tyne V. H., Eyres S. P. S., 2002, IAU Circ 7855
- [] Henden A., Munari U., Schwartz M., 2002, IAU Circ 7859
- [] Henden A., Munari U., Marrese P., Boschi F., Corradi R., 2002, IAU Circ 7889, 1
- [] Iben I. Jr, Kaler J. B., Truran J. W., Renzini A., 1983, ApJ, 264, 605
- [] Iijima T., Della Valle M., 2002, IAU Circ 7822, 1
- [] Kimeswenger S., Lederle C., Schmeja S., Armsdorfer B., 2002, MNRAS, 336, 43
- [] Martini P., Wagner R. M., Tomaney A., Rich R. M., Della Valle M., Hauschildt P. H., 1999, AJ, 118, 1034
- [] Munari U., et al., 2002, A&A, 389, 51
- [] Rauch T., Kerber F., van Wyk F., 2002, IAU Circ 7886
- [] Rich R. M., Mould J., Picard A., Frogel J. A., Davies R., 1989, ApJ, 341, L51
- [] Sharov A. S., 1990, Soviet Astr. Lett., 16, 85
- [] Schmidt-Kaler Th., 1982, Landolt-Börnstein: Numerical Data and Functional Relationships in Science and Technology, eds. K. Schaifers and H. H. Voigt (Springer-Verlag, Berlin), VI/2b
- [] Wagner R. M., Starrfield S. G., 2002, IAU Circ 7992
- [] Watson A. M., Costero R., 2002, IAU Circ 7976
- [] Zwitter T., Munari U., 2002, IAU Circ 7812, 2