The Broadband Afterglow of GRB 980703
Abstract
We present radio observations of the afterglow of the bright -ray burst GRB 980703 made between one day and one year after the burst. These data are combined with published late-time radio measurements and existing optical, near-infrared (NIR) and X-ray observations to create a comprehensive broadband dataset for modeling the physical parameters of the outflow. While a wind-stratified medium cannot be ruled out statistically, it requires a high fraction of the shock energy in the electrons, and so is not favored on theoretical grounds. Instead, the data are consistent with a fireball model in which the ejecta are collimated and expanding into a constant density medium. The radio data cannot be fit with an isotropic shock but instead require a jet break at 3.5 days, not seen at optical wavelengths due to the presence of a a bright host galaxy. The addition of the full radio dataset constrains the self-absorption frequency, giving an estimate of the circumburst density of cm-3, a value which differs substantially from previous estimates. This result is consistent with the growing number of GRB afterglows for which broadband modeling yields cm-3, with a typical value 10 cm-3.
1 Introduction
Astronomers have monitored the afterglows of GRBs with considerable enthusiasm across the electromagnetic spectrum. The primary motivation in using these measurements is to infer the fundamental parameters of the explosion: the total energy release, the geometry of the explosion and the density distribution of ambient gas Wijers & Galama (1999); Chevalier & Li (1999); Harrison et al. (2001); Panaitescu & Kumar 2001b .
The gamma-ray burst (GRB) of 1998 July 3.18 UT triggered the BATSE detectors on board the Compton Gamma-Ray Observatory Kippen et al. (1998) and its afterglow was detected by the All Sky Monitor on the the Rossi X-ray Timing Explorer (Levine Morgan & Muno 1998). Followup observations of the X-ray afterglow were obtained with the Narrow Field Instruments (NFI) on the BeppoSAX satellite (see Vreeswijk et al. 1999 for a summary of NFI observations). Radio observations of this field with the Very Large Array (VLA) began 1.2 days after the burst and identified a radio source within the BeppoSAX NFI error circle. Coincident with this we discovered a fading optical source and suggested that the source was the radio and optical afterglow of GRB 980703 (Frail et al. 1998). Zapatero-Osorio et al. (1998) also reported the same fading optical source, while Djorgovski et al. (1998) discovered the host galaxy and measured its redshift . See Bloom et al. (1998) for a summary of the early radio, optical and NIR measurements.
Unfortunately, the host galaxy of GRB 980703 is very bright – magnitude Djorgovski et al. (1998) and so while this has led to a number of interesting results regarding the physical properties of GRB host galaxies (i.e., Holland et al. 2001; Sokolov et al. 2001; Berger, Kulkarni & Frail 2001; Chary, Becklin & Armus 2002), it has also meant that the optical and NIR afterglow could be tracked for only a few days before it faded below the light from the host galaxy. For this reason, the temporal decay of the optical/NIR afterglow is poorly constrained with ranging from to (Bloom et al. 1998; Castro-Tirado et al. 1999; Vreeswijk et al. 1999; Holland et al. 2001); here flux at time , . Furthermore, the host galaxy appears to be undergoing vigorous star formation and consequently has a large amount of dust and gas Djorgovski et al. (1998); Sokolov et al. (2001). Not surprisingly, the optical/NIR spectrum of the afterglow (usually characterized by a power law, , appears to be significantly affected by extinction within the host galaxy. The low precision with which and were measured preclude constraining the fundamental explosion parameters with any reasonably precision (Bloom et al. 1998; Vreeswijk et al. 1999).
Fortunately, the radio afterglow of GRB 980703 was quite bright and as a result we were able to mount an ambitious monitoring program at the Very Large Array (VLA). Here we present our final results on the centimeter radio light curves of GRB 980703 and then proceed to interpret the observations in the framework of afterglow models. The primary advantage of the radio measurements is the immunity of the radio emission from the two effects discussed above (bright host and extinction). As a result, by combining the X-ray, optical/NIR and radio data together in a single broadband dataset, we are able to infer the physical parameters for the afterglow from GRB 980703 with moderate precision.
2 Observations and Data Reduction
The details on the initial discovery of the radio afterglow from GRB 980703 are given in Bloom et al. (1998). The late-time data ( days) for this burst have been published by Berger, Kulkarni & Frail (2001). Below we describe the VLA monitoring program and observations at other radio facilities.
Very Large Array (VLA). VLA111The NRAO is a facility of the National Science Foundation operated under cooperative agreement by Associated Universities, Inc. NRAO operates the VLA and the VLBA. observations and data reduction were carried out following standard practice. To maximize sensitivity the full VLA continuum bandwidth (100 MHz) was recorded in two 50 MHz bands, each with both hands of circular polarization. The flux density scale was tied to 3C 48 (J0137+331) and frequent observations (every 2-5 minutes) were made of the phase calibrators J2346+095 (at 4.86 and 8.46 GHz) and J2330+110 (at 1.43 GHz). A log of the observations, giving the measured fluxes at 1.43, 4.86 and 8.46 GHz, can be found in Table 1.
One VLA observation was made at 15 GHz on 1998 July 17.56 UT employing the same methodology. No source was detected at 15 GHz above a 3 limit of 1.0 mJy.
James Clerk Maxwell Telescope (JCMT). An observation was made on 1998 July 10.53 UT using the SCUBA array on JCMT222The James Clerk Maxwell Telescope is operated by The Joint Astronomy Centre on behalf of the Particle Physics and Astronomy Research Council of the United Kingdom, the Netherlands Organization for Scientific Research, and the National Research Council of Canada. at 220 GHz. The planet Uranus was used as a primary flux calibrator. The data were reduced in the standard method (i.e., corrected for atmospheric opacity which is estimated by extrapolating from a skydip made at 225 GHz by a radiometer operated by the Caltech Submillimeter Observatory) and converted to mJy based on the primary flux calibrator. The pointing was checked immediately before and after the observations on a nearby blazar and was found to vary by less than 2′′. Despite excellent photometric conditions, no 220 GHz source was visible at the position of GRB 980703 above a 2 limit of 5.2 mJy. Similar upper limits from JCMT are reported by Smith et al. (1999).
Very Long Baseline Array (VLBA). Very Long Baseline Interferometry (VLBI) observations were performed on 1998 August 2 at 8.42 GHz, using the 10 element VLBA for 5.6 hours. Both right and left circular polarizations were recorded using 2 bit sampling across a bandwidth of 32 MHz. The VLBA correlator produced 16 frequency channels across each 8 MHz IF during every 2 second integration. Amplitude calibration for each antenna was derived from measurements of the antenna gain and system temperatures. Global fringe fitting was performed on the strong nearby calibrator J2346+0930 and the resulting delays, rates and phases were transfered to GRB 980703 before averaging in frequency or time. The time for a complete cycle on the phase calibrator and target source was 3 minutes.
The data for all sources were edited, averaged over 30 second intervals, and then imaged using DIFMAP Shepherd (1997). We detected GRB 980703 with the VLBA at a level of 0.58 0.06 mJy, consistent with VLA measurements at this same time. At the time of the VLBA observation, we place a limit on the angular size of the radio afterglow of GRB 980703 of 0.3 mas. We also derive a position of (J2000) = 23h59m06.s6661, (J2000) = 8∘35′07.′′0939 with an uncertainty of 0.0007 arcsec in each coordinate.
3 Broadband Data
Before undertaking any detailed model fits it is worthwhile to review the general characteristics of the entire broadband dataset for this afterglow. In addition to the radio data summarized in §2 and Table 1, there exists a large amount of published data in the X-ray Vreeswijk et al. (1999), optical/NIR Bloom et al. (1998); Castro-Tirado et al. (1999); Vreeswijk et al. (1999); Holland et al. (2001); Sokolov et al. (2001) and radio (Berger et al. 2001) bands. Light curves of these data are plotted in Figs. 1-3. The X-ray measurements were converted to flux density with the spectrally-weighted factor (using the observed photon index) that 1 Jy = 2.4 erg cm-2 s-1. We corrected the optical data for absorption in our Galaxy (Schlegel, Finkbeiner & Davis 1998) before converting to flux densities using the factors in Bessell (1979) for the optical and Bessell & Brett (1988) for the near-IR bands. An additional 1% error was added in quadrature to all the measured flux densities to account for any cross-calibration systematic uncertainties.
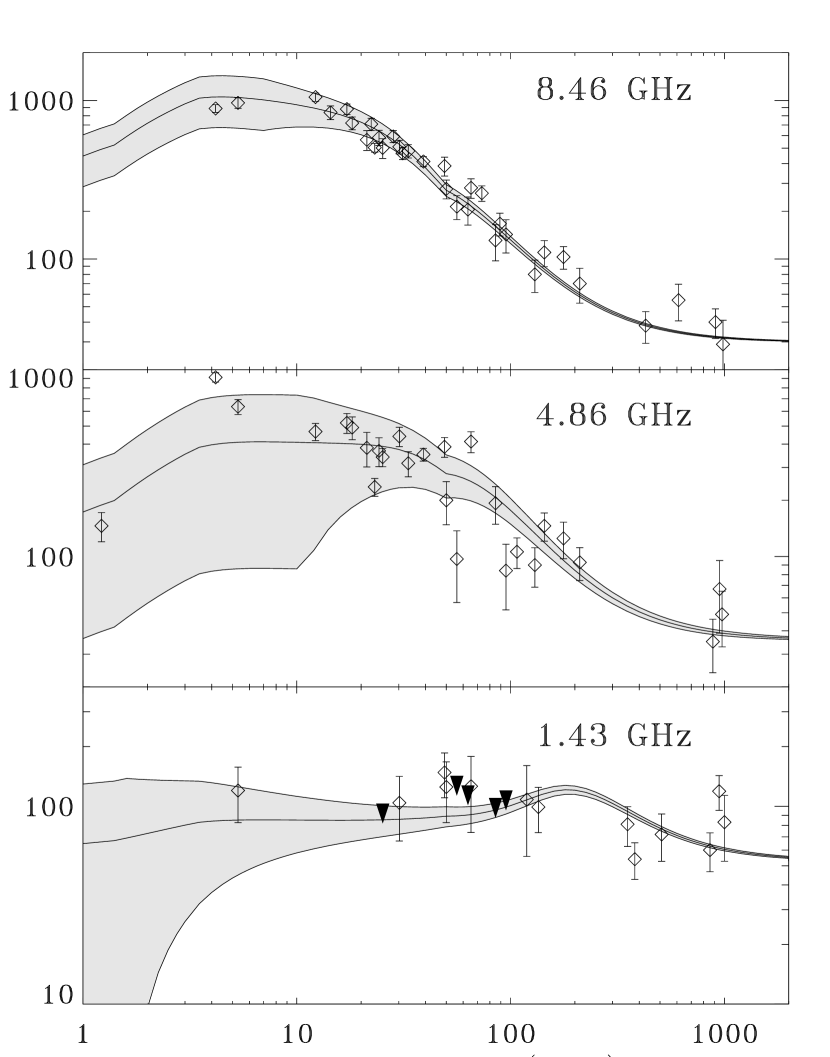
In Fig. 1 we display the radio light curves at the frequencies of 1.43, 4.86 and 8.46 GHz. The 8.46 GHz light curve has a well-defined peak above 1 mJy between 5 and 12 days after the burst, followed by a power-law decay. As noted previously by Berger et al. (2001), the flux density at centimeter wavelengths undergoes a flattening about 1 year after the burst which is attributed to synchrotron emission from an underlying host galaxy. After subtracting this component (Fhost=39 Jy) from the 8.46 GHz light curve we derive a temporal decay index (where F) between 12 and 1000 days after the burst.
The 4.86-GHz light curve shows a similar rise and a decay as that at 8.46 GHz. However, superimposed on this long-term secular behavior there are significant changes in the flux density from one point to the next. These erratic fluctuations are not confined to day-to-day variations but there is also evidence for short-term variability (50%) on timescales of a few hours. Narrow-band, short-timescale flux variations are a hallmark of interstellar scattering (ISS) (Goodman, 1997; Frail et al., 1997). Although we make rough approximations for the ISS-induced fluctuations in §4, a more detailed treatment of ISS for GRB 980703 is postponed for a later paper.
In contrast to the flux variations seen at 8.46 GHz and 4.86-GHz, the 1.43 GHz light curve is notable for its relative constancy. Most of the emission at this frequency is dominated by the host galaxy with F68 Jy (Berger et al. 2001). After allowing for some variation due to ISS, the peak flux of 0.15 mJy reached 50 days after the burst is well below the peak at 8.46 GHz (1 mJy) and at 4.86 GHz (0.3 mJy). This apparent drop in the peak flux density with decreasing frequency (i.e., “peak flux cascade”) has been noted for other well-studied bursts (Frail, Waxman & Kulkarni 2000, Yost et al. 2002) and poses an important constraint on possible models (see §4).
The optical/NIR data shown in Fig. 2 exhibits the familiar power-law decay of the afterglow. GRB 980703 occurred in a bright GRB host galaxy (Djorgovski et al., 1998) and so the optical/NIR afterglow could only be followed for a few days before the host dominated the light curve. The B, V, R, I, J, H, and K band light curves can be characterized by a power-law afterglow component (in time and frequency) plus a frequency-dependent host component. There is also a small excess in the flux density between the R and K bands near day 20. As noted by Holland et al. 2001, this could be due to a supernova component in the late-time light curve but its significance is not strong enough to warrant its inclusion in the fitting.
A noise-weighted least squares fit of the form F= F + F was carried out on the entire optical/NIR data and yielded333The fitted F are not given here since more accurate values are discussed in §4 and listed in Table 2 and with =64.7/66. The steep spectral slope relative to the X-ray () has been noted before and attributed to dust extinction from the host galaxy (Vreeswijk et al., 1999). Our more accurate value of is consistent with earlier derivations Bloom et al. (1998); Castro-Tirado et al. (1999); Vreeswijk et al. (1999), but it is considerably steeper than the radio () and X-ray () light curves in Figs. 1 and 3.
4 Broadband Modeling
We interpret the observations summarized in §2 and §3 within the framework of the standard relativistic blast wave model (see Mészáros 2002 for a review). In this model an impulsive release of energy from the GRB event drives an ultra-relativistic outflow into the surrounding medium. Particle acceleration occurring within this forward-propagating shock produces the afterglow emission via synchrotron and/or the inverse Compton processes. Since the evolution of the blast wave is sensitive to the energy and geometry of the explosion, as well as the density structure of the circumburst medium, the modeling of the afterglow emission can be used, in principle, to extract valuable information on GRB progenitors and their environments, as well as details on the microphysics of the shock (e.g. Panaitescu & Kumar 2001a).
The particular approach we have taken to model broadband afterglow emission has been described in some detail in two recent papers Harrison et al. (2001); Yost et al. (2002). In brief, we characterize the broadband spectrum by several break frequencies, including both synchrotron and inverse Compton components, one of which usually dominates depending on the circumstances. The microphysics of the shock, such as the electron energy index, , the fraction of shock energy in electrons , and the fraction of shock energy in magnetic field are taken to be invariant with time. The temporal evolution of the break frequencies is governed by the energy of the shock (which can be radiative), the geometry of the shock (which can be isotropic or jet-like), and the density structure of the surrounding medium (which can be constant or vary as the inverse square of the radius). In addition to the basic physics, the model also accounts for several complicating effects such as ISS at radio wavelengths, dust extinction in the optical/NIR bands, and a possible pan-chromatic contribution to the emission from a host galaxy.
The solution which best describes all the afterglow data for GRB 980703 is a collimated outflow expanding into a constant density medium. Under the heading “ISM” Table 2 summarizes the best-fit parameters which were derived using a least-squares approach. In addition to the shock parameters , , and , the model solves for the jet opening angle , the circumburst density , the isotropic-equivalent fireball energy at the time when the fireball evolution becomes largely adiabatic , the restframe extinction A(V), and the host flux density at several wavelengths. Perhaps the most striking feature of this model is that it requires a jet break at days after the burst. The expected steepening of the optical/NIR lightcurves at is not obvious because of the brightness of the host galaxy. Although the steep value of relative to and is suggestive (see §3 and Holland et al. 2001), the case for a jet in GRB 980703 is based primarily on the peak flux cascade observed at radio wavelengths (see §3 and Fig. 1). It is this same behavior that makes it impossible to model the afterglow of GRB 980703 as an adiabatic expansion of an isotropic shock. In general, since radio afterglows exhibit a different observational signature than either that of optical or X-ray afterglows, they have proven useful in revealing other cases of “hidden jets” Berger et al. (2001).
Now that the true geometry is known (i.e., ), the energy released in the GRB phase and the afterglow phase can be determined and compared. For a two-sided jet, these isotropic values are reduced by the factor /2. Thus, the geometry-corrected gamma-ray energy erg and the kinetic energy in the blastwave erg. The value of differs from the compilation of Frail et al. (2001) because here we have used the circumburst density derived from the broadband modeling rather than some assumed value. Note also that is only a lower limit on the true initial energy of the blastwave since ) is derived at a time =1.4 days. After this time the blast-wave evolution is predominantly adiabatic and the energy dissipation is less than a factor of two up to 100 days after the burst. We estimate that prior to this time (when radiative losses decrease the blastwave energy) the energy drops by about a factor of three. Another important quantity that can be estimated is , the efficiency of the fireball in converting the energy in the ejecta into rays. A number of recent papers (Beloborodov 2000; Guetta, Spada & Waxman 2001, Kobayashi & Sari 2001) have argued that internal shocks under certain conditions are very efficient at producing gamma-rays (i.e., ). From and we derive /(+) between 15% and 35%, comparable to previous estimates of this and other well-studied events (e.g., Panaitescu & Kumar 2001a).
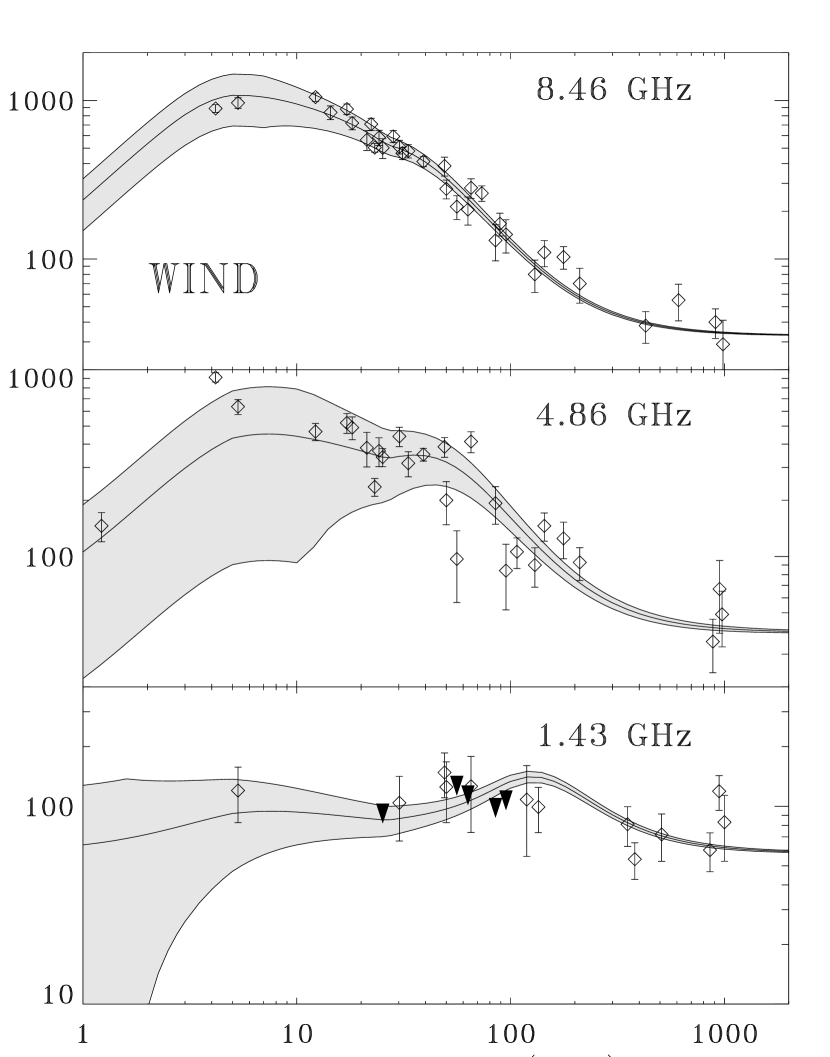
While this ISM model provides satisfactory agreement with the broadband dataset (§3), it is not a unique solution. An explosion into a wind-blown circumburst medium Chevalier & Li (1999) also yields an equally good fit (see Table 2 and Figs. 4-6). The ejecta are also collimated in this model with . The density is parameterized by which characterizes the wind density, with g cm-3, with the wind radius in cm. The most troubling feature of this model is that it requires about 70% of the shock energy going into the electrons. Likewise, the geometry-corrected gamma-ray energy of erg is a factor of 10 larger than the kinetic energy in the blastwave . This suggests an unusually high , which, as noted above, is contrary to theoretical expectations since little of the initial shock energy in the fireball is left to power the afterglow. Thus, while a wind-blown solution formally fits the data and cannot be ruled out, we prefer the ISM model since it does not require such extreme physical conditions.
Regardless of which afterglow model is preferred, the host magnitudes are comparable to those derived by Sokolov et al. (2001) and Berger et al. (2002) at optical and radio wavelengths, respectively. Likewise, the steep spectral slope (see §3) requires modest rest frame V-band extinction A(V)1, in accordance with earlier estimates Bloom et al. (1998); Castro-Tirado et al. (1999); Vreeswijk et al. (1999).
5 Comparison to Other Models
There have been several attempts to derive the fireball parameters for GRB 980703 by constructing single-epoch spectra from the early afterglow data (Bloom et al. 1998; Castro-Tirado et al. 1999; Vreeswijk et al. 1999). The estimates for these parameters have varied widely among these papers, due to slightly different data sets and a high degree of correlation between the parameters. For example, there is a degeneracy between the electron energy index , the extinction A(V), and the host brightness that makes it difficult to extract the underlying spectral slope of the afterglow and therefore the location of two important break frequencies and . This leads to large uncertainties in the parameters Eiso, n, , and .
The limitations of this spectral snapshot method can be overcome by globally fitting all the afterglow data using a hydrodynamical model of the blast wave. This is the approach that we have adopted in this paper but the first application of this method to GRB 980703 was made by Panaitescu & Kumar (2001b). Their basic model is similar to our own. They find that a collimated outflow in a constant density medium provides a good description of the data, and they also find acceptable fits to stellar wind model. However, the differences between our models show up most clearly in the derived fireball parameters with E erg, n cm-3, , , , and rad. Radiative losses are small in their model and inverse Compton (IC) emission is negligible, while =0.27 in our model and IC is important for flattening the X-ray light curve around day 1. The most severe difference, however, is that the density derived by Panaitescu & Kumar (2001b) is 3.5 times smaller than our estimate in Table 2.
The origin of this discrepancy is not likely the result of differences in the implementation of the relativistic blast wave model. Although our specific methodology does differ somewhat, in at least one case when fits were made using the same data for GRB 000926, the results were in good agreement Harrison et al. (2001); Panaitescu & Kumar (2002). The most serious limitation of the Panaitescu & Kumar (2001b) analysis of this burst is that it relies on data taken over a limited frequency range and a limited temporal range. The optical data were restricted effectively to 1 to 5 days due to host galaxy contamination, and the early radio data (especially at 5 GHz) were of limited use due to ISS. With the addition of a complete set of centimeter radio light curves for GRB 980703 much of this difficulty can be resolved. The most significant area of improvement is in the determination of the synchrotron self-absorption frequency . This important break frequency is largely unconstrained in the Panaitescu & Kumar (2001b) model and is likely the origin of our discrepant density estimates.
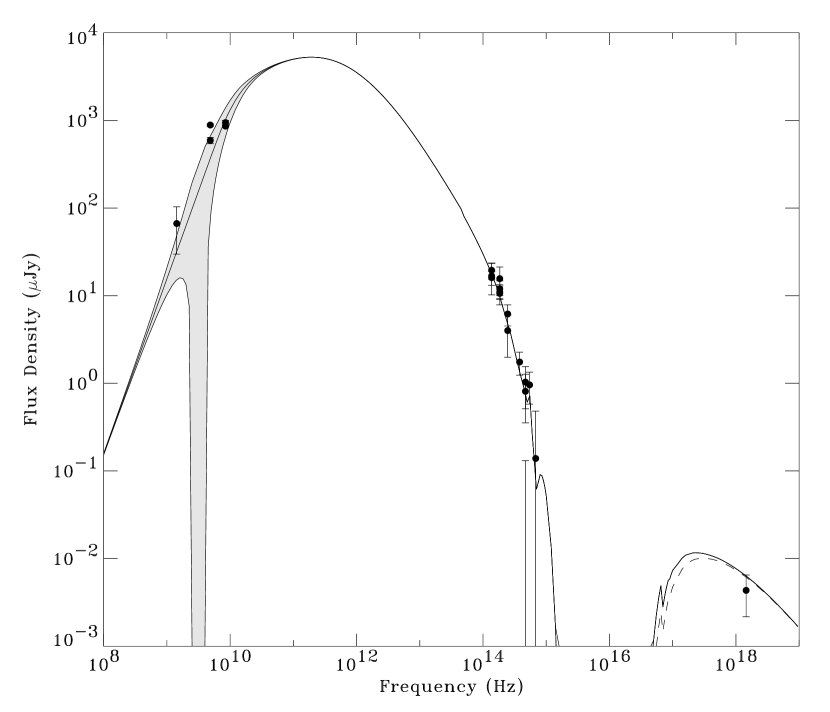
An alternate way to view the difficulties in the afterglow model of Panaitescu & Kumar (2001b) is to use the “C parameter”, introduced by Sari & Esin (2001), which places a constraint on the combination of synchrotron break frequencies and the peak flux density. From Fig. 1 of Panaitescu & Kumar (2001b) we find the following values for the synchrotron parameters: Hz, Hz, and mJy. In order not to violate the theoretial limit of it requires a self-absorption break GHz. It is this upper limit on which leads to the low value of n cm-3. A broadband spectrum of the GRB 980703 afterglow on day 4.5 (see Fig. 7) shows this to be a significant underestimate of . If we use a more appropriate value of =14 GHz at this time than the additional synchrotron parameters of Panaitescu & Kumar (2001b) give an unphysical solution with C1 unless the cooling frequency is significantly reduced and an IC component is added. This has the effect of increasing the density of the circumburst medium.
6 Discussion and Conclusions
A high-quality panchromatic dataset, resulting from a multi-wavelength observing campaign of GRB 980703, has enabled us to apply the relativistic blast wave model in order to determine the geometry and energetics of the explosion, the density of the medium immediately surrounding the progenitor, as well as the properties of the interstellar medium within the host galaxy. All of the afterglow data for GRB 980703 are consistent with a model in which the ejecta are collimated and expanding into a constant density medium. Although it is not a unique solution, it yields reasonable estimates for the physical parameters which are in agreement with other well-studied events.
Perhaps the most interesting result from this work is what has been learned about the properties of GRB environment. A proper understanding of the density structure of the circumburst medium remains an important goal, since it is invariably tied to the GRB progenitor question. To the degree that the underlying assumptions behind the fireball model of GRB afterglows are correct, broadband modeling gives us the only direct determination of this density. Optical extinction, host galaxy properties, X-ray lines, late-time optical bumps, or the attenuation of low energy X-ray photons are all indirect or line-of-sight measures of the GRB environment. In a recent compilation of 10 well-studied afterglows, Panaitescu & Kumar (2002) showed that broadband modeling yielded densities in the range of 0.1-100 cm-3. Their result is in good accord with our own extensive modeling of afterglows (e.g., Frail, Waxman & Kulkarni 2000, Berger et al. 2000, Berger et al. 2001, Harrison et al. 2001, Yost et al. 2002).
For two events, GRB 990123 and GRB 980703, Panaitescu & Kumar (2001b) the derived densities (i.e., n cm-3) are much lower than the values given above. These low estimates prompted the suggestion that some GRBs are massive stars which explode in the pre-existing cavities of superbubbles created by a previous generation of supernovae (Scalo & Wheeler, 2001). The circumburst density for GRB 980703 derived from our model, n28 cm-3, is much higher because the synchrotron self-absorption frequency was not well constrained by the early observations. On the timescale of interest, lies within the radio band and is a sensitive indicator of the ambient density, i.e., . A similar problem likely explains results from GRB 990123 but it is further complicated by the evidence that the early radio emission was dominated by a reverse shock component (Kulkarni et al. (1999). Likewise, it can be shown that the claims of high circumburst densities (i.e., n cm-3) based solely on X-ray and optical observations (Piro et al. 2001; in’t Zand et al. 2001) cannot be supported once radio data is included (Harrison et al. 2001). Thus radio observations, which help to constrain the low energy part of the synchrotron spectrum, are essential for deriving accurate physical parameters of the blast wave.
In summary, for all well-studied GRB afterglows to date there is little evidence for either extreme of high n cm-3 or low n cm-3 circumburst densities. Instead, GRB 980703 is the latest of a growing number of events whose density lies within a narrow range of 0.1-100 cm-3 with a canonical value of order n10 cm-3. Such densities are found in diffuse interstellar clouds of our Galaxy, commonly associated with star-forming regions. A density of order 5-30 cm-3 is also characteristic of the interclump medium of molecular clouds, as inferred from observations of supernova remnants in our Galaxy (e.g., Chevalier 1999 and references therein).
References
- Beloborodov (2000) Beloborodov, A. M. 2000, ApJ, 539, L25.
- Berger et al. (2001) Berger, E. et al. 2001, ApJ, 556, 556.
- Berger, Kulkarni & Frail (2001) Berger, E., Kulkarni, S., and Frail, D. A. 2001, ApJ, 560, 652.
- Berger et al. (2000) Berger, E. et al. 2000, ApJ, 545, 56.
- Bessell (1979) Bessell, M. S. 1979, PASP, 91, 589.
- Bessell & Brett (1988) Bessell, M. S. and Brett, J. M. 1988, PASP, 100, 1134.
- Bloom et al. (1998) Bloom, J. S. et al. 1998, ApJ, 508, L21.
- Bloom, Frail & Sari (2001) Bloom, J. S., Frail, D. A., and Sari, R. 2001, AJ, 121, 2879.
- Castro-Tirado et al. (1999) Castro-Tirado, A. J. et al. 1999, ApJ, 511, L85.
- Chary, Becklin & Armus (2002) Chary, R., Becklin, E. E., and Armus, L. 2002, ApJ, 566, 229.
- Chevalier (1999) Chevalier, R. A. 1999, ApJ, 511, 798.
- Chevalier & Li (1999) Chevalier, R. A. and Li, Z.-Y. 1999, ApJ, 520, L29.
- Djorgovski et al. (1998) Djorgovski, S. G., Kulkarni, S. R., Bloom, J. S., Goodrich, R., Frail, D. A., Piro, L., and Palazzi, E. 1998, ApJ, 508, L17.
- Djorgovski et al. (1998) Djorgovski, S. G. et al. 1998, GCN notice 139.
- Frail et al. (1998) Frail, D. A., Halpern, J. P., Bloom, J. S., Kulkarni, S. R., and Djorgovski, S. G. 1998, GCN notice 128.
- Frail et al. (1997) Frail, D. A., Kulkarni, S. R., Nicastro, S. R., Feroci, M., and Taylor, G. B. 1997, Nature, 389, 261.
- Frail et al. (2001) Frail, D. A. et al. 2001, ApJ, 562, L55.
- Frail, Waxman & Kulkarni (2000) Frail, D. A., Waxman, E., and Kulkarni, S. R. 2000, ApJ, 537, 191.
- Goodman (1997) Goodman, J. 1997, New Astr., 2(5), 449.
- Guetta, Spada & Waxman (2001) Guetta, D., Spada, M., and Waxman, E. 2001, ApJ, 557, 399.
- Harrison et al. (2001) Harrison, F. A. et al. 2001, ApJ, 559, 123.
- Holland et al. (2001) Holland, S. et al. 2001, A&A, 371, 52.
- in’ t Zand et al. (2001) in’ t Zand, J. . J. M. et al. 2001, ApJ, 559, 710.
- Kippen et al. (1998) Kippen, R. M. et al. 1998, GCN notice 143.
- Kobayashi & Sari (2001) Kobayashi, S. and Sari, R. 2001, ApJ, 551, 934.
- Kulkarni et al. (1999) Kulkarni, S. R. et al. 1999, ApJ, 522, L97.
- Levine, Morgan & Muno (1998) Levine, A., Morgan, E., and Muno, M. 1998. IAU circular 6966.
- Meszaros (2002) Meszaros, P. 2002, To appear in Annu.Rev.Astron.Astrophys; astro-ph/0111170.
- (29) Panaitescu, A. and Kumar, P. 2001a, ApJ, 560, L49.
- (30) Panaitescu, A. and Kumar, P. 2001b, ApJ, 554, 667.
- Panaitescu & Kumar (2002) Panaitescu, A. and Kumar, P. 2002, ApJ, 571, 779.
- Piro et al. (2001) Piro, L. et al. 2001, ApJ, 558, 442.
- Sari & Esin (2001) Sari, R. and Esin, A. A. 2001, ApJ, 548, 787.
- Scalo & Wheeler (2001) Scalo, J. and Wheeler, J. C. 2001, ApJ, 562, 664.
- Schlegel, Finkbeiner & Davis (1998) Schlegel, D. J., Finkbeiner, D. P., and Davis, M. 1998, ApJ, 500, 525.
- Shepherd (1997) Shepherd, M. C. 1997, in ASP Conf. Ser. 125: Astronomical Data Analysis Software and Systems VI, volume 6, 77.
- Smith et al. (1999) Smith, I. A. et al. 1999, A&A, 347, 92.
- Sokolov et al. (2001) Sokolov, V. V. et al. 2001, A&A, 372, 438.
- Vreeswijk et al. (1999) Vreeswijk, P. M. et al. 1999, ApJ, 523, 171.
- Wijers & Galama (1999) Wijers, R. A. M. J. and Galama, T. J. 1999, ApJ, 523, 177.
- Yost et al. (2002) Yost, S. A. et al. 2002, ApJ, 577, 155.
- Zapatero Osorio et al. (1998) Zapatero Osorio, M. R., Castro-Tirado, A., Gorosabel, J., Oscoz, A., Kemp, S., Frontera, F., and Nicastro, L. 1998, GCN notice 130.


| Date | F8.46 | F4.86 | F1.43 | ||||
|---|---|---|---|---|---|---|---|
| (UT) | (days) | (Jy) | (Jy) | (Jy) | (Jy) | (Jy) | (Jy) |
| 1998 Jul. 04.40 | 1.22 | 146 | 25 | ||||
| 1998 Jul. 07.35bbOn 1998 July 7 we searched for polarized signal from the radio, obtaining 3-sigma limits on the linear and circular polarization at 4.86 GHz and 8.46 GHz of 8%. | 4.17 | 890 | 21 | 912 | 26 | ||
| 1998 Jul. 08.49 | 5.31 | 965 | 55 | 635 | 49 | 120 | 37 |
| 1998 Jul. 15.41 | 12.23 | 1050 | 35 | 467 | 43 | ||
| 1998 Jul. 17.56 | 14.38 | 840 | 72 | 1200 | 48 | ||
| 1998 Jul. 20.33 | 17.15 | 882 | 51 | 520 | 58 | ||
| 1998 Jul. 21.34 | 18.16 | 720 | 56 | 491 | 64 | ||
| 1998 Jul. 24.44 | 21.26 | 564 | 75 | 382 | 78 | ||
| 1998 Jul. 25.46 | 22.28 | 709 | 52 | ||||
| 1998 Jul. 26.33 | 23.15 | 504 | 20 | 236 | 23 | ||
| 1998 Jul. 27.42 | 24.24 | 584 | 57 | 368 | 62 | ||
| 1998 Jul. 28.41 | 25.23 | 502 | 67 | 341 | 34 | 25 | 39 |
| 1998 Jul. 31.45 | 28.27 | 593 | 42 | ||||
| 1998 Aug. 02.30ccVLBA measurement. All other measurements made with the VLA. See §2 for details. | 30.12 | 580 | 60 | ||||
| 1998 Aug. 02.36 | 30.18 | 510 | 43 | 440 | 47 | 104 | 37 |
| 1998 Aug. 03.44 | 31.26 | 465 | 34 | ||||
| 1998 Aug. 05.41 | 33.23 | 480 | 40 | 316 | 46 | ||
| 1998 Aug. 11.29 | 39.11 | 412 | 22 | 352 | 21 | ||
| 1998 Aug. 21.28 | 49.10 | 386 | 49 | 387 | 43 | 148 | 37 |
| 1998 Aug. 24.22 | 50.04 | 277 | 35 | 200 | 51 | 125 | 42 |
| 1998 Aug. 28.22 | 56.04 | 214 | 35 | 97 | 40 | 68 | 37 |
| 1998 Sep. 04.35 | 63.17 | 205 | 40 | 63 | 32 | ||
| 1998 Sep. 06.49 | 65.31 | 281 | 37 | 413 | 49 | 126 | 52 |
| 1998 Sep. 14.57 | 73.39 | 260 | 26 | ||||
| 1998 Sep. 26.22 | 85.04 | 131 | 33 | 193 | 43 | 18 | 46 |
| 1998 Sep. 30.32 | 89.14 | 167 | 26 | ||||
| 1998 Oct. 06.32 | 95.14 | 143 | 33 | 84 | 32 | 36 | 42 |
| 1998 Oct. 18.31 | 107.13 | 106 | 19 | ||||
| 1998 Oct. 30.24 | 119.06 | 108 | 52 | ||||
| 1998 Nov. 10.08 | 129.90 | 80 | 18 | 90 | 21 | ||
| 1998 Nov. 15.03 | 134.85 | 99 | 25 | ||||
| 1998 Nov. 23.97 | 143.79 | 110 | 20 | 146 | 24 | ||
| 1998 Dec. 27.04 | 176.86 | 103 | 16 | 125 | 27 | ||
| 1999 Jan. 29.89 | 210.71 | 70 | 17 | 93 | 18 |
| Parameter | ISM | Wind |
|---|---|---|
| for 162 data pts | 170.4 | 171.4 |
| (days) | 3.43 | 5.11 |
| (days) | 49.6 | 26.4 |
| (days) | 1.41 | 5.17 |
| erg)aaIsotropic equivalent blastwave energy (not corrected for collimation) | 11.8 | 0.66 |
| n/A∗ | 27.6 | 1.42 |
| 2.54 | 2.11 | |
| (fraction of E) | 0.27 | 0.69 |
| (fraction of E) | 1.8 | 2.8 |
| 0.234 | 0.310 | |
| host A(V) | 1.15 | 1.33 |
| host B (Jy) | 2.93 | 2.94 |
| host V (Jy) | 3.07 | 3.07 |
| host R (Jy) | 3.61 | 3.64 |
| host I (Jy) | 4.84 | 4.81 |
| host J (Jy) | 8.77 | 8.67 |
| host H (Jy) | 9.15 | 9.00 |
| host K (Jy) | 10.1 | 10.0 |
| host 1.4 GHz (Jy) | 53 | 58 |
| bbIsotropic-equivalent energy emitted in the gamma-rays taken from Bloom, Sari & Frail (2001). (1052 erg) | 6.01 | 6.01 |
| (1050 erg) | 16.5 | 28.9 |