The Circumstellar Disk of the Butterfly Star in Taurus
Abstract
We present a model of the circumstellar environment of the so-called “Butterfly Star” in Taurus (IRAS 04302+2247). The appearance of this young stellar object is dominated by a large circumstellar disk seen edge-on and the light scattering lobes above the disk. Our model is based on multi-wavelength continuum observations: (1) Millimeter maps, and (2) High-resolution near-infrared obtained with HST/NICMOS. The advantage of the combination of both observations is that they trace (a) different regions of the system and (b) different physical processes. On the one hand, the millimeter-observations are sensitive to the long-wavelength radiation being re-emitted from the dust in the central parts close to the midplane of the circumstellar disk. Thus, the geometry and small-scale density distribution of the disk has been studied. Furthermore, in contrast to the pure flux measurement, the resolved 1.3 mm image allows to discriminate between different disk models with a similar far-infrared/millimeter spectral energy distribution and therefore to disentangle the disk geometry much more precisely. On the other hand, the near-infrared observations trace the envelope structure and dust properties in the envelope and the disk surface.
We find disk and envelope parameters which are comparable with those of the circumstellar environment of other young stellar objects. A main result is that the dust properties must be different in the circumstellar disk and in the envelope: While a grain size distribution with grain radii up to 100 m is required to reproduce the millimeter observations of the disk, the envelope is dominated by smaller grains similar to those of the interstellar medium. Alternatives to this grain growth scenario in the circumstellar disk are discussed in brief as well.
1 Introduction
The “Butterfly Star” in Taurus, IRAS 04302+2247, is a Class I source located in the vicinity of Lynds 1536b dark cloud. Its near-infrared appearance is dominated by a totally opaque band that bisects the scattered light nebulosity. As pointed out by Padgett et al. 1999, the apparent thickness of the extinction band decreases by about 30% from 1.1 m to 2.05 m, accounting for the reddening seen alonge its edges. A further strong evidence on the interpretation of the dark lane as a circumstellar disk seen precisely edge-on comes from 13CO(1-0) mapping obtained at the Owens Valley Millimeter Array (Padgett et al. 2001). These observations indicate that the dark lane coincides with a dense rotating disk of molecular gas.
Former attempts to model the circumstellar environment of IRAS 04302+2247 have been undertaken by Lucas & Roche (1997, 1998a; see also Lucas & Roche 1998b). The slight quadrupolar morphology of the object (therefore the alias “Butterfly star” - Lucas & Roche 1997) was assumed to be resulting from a circumstellar shell representing the late stage of contraction of an initially spherical non-magnetic cloud combined with a cavity and an embedded opaque jet parallel to the axis of the angular momentum of the cloud. Based on the (later) findings of a circumstellar disk mentioned above, we model the source as a combination of a disk plus a circumstellar envelope. The slight (mirror) symmetry, found also in the high-resolution HST/NICMOS images of the source, is modeled under the assumption of an optically thin outflow cone.
We base our modelling on the following observations: (1) Resolved 1.3 mm and 2.7 mm maps of the disk obtained with the Owens Valley Radio Observatory (OVRO), and (2) High-resolution near-infrared images obtained with HST/NICMOS at 1.10 m, 1.60 m, 1.87 m, and 2.05 m. While the millimeter observations are sensitive only to radiation being emitted from dust in the dense region within the disk, the near-infrared images are dominated by scattering of the stellar light on the dust in the circumstellar envelope and the disk “surface”. These observations trace different physical processes in different regions of the circumstellar environment, but are both strongly related to the dust properties in the system. Thus, we are in the position not only to model both components separately and to find the best model on the basis of common (geometrical) parameters, but may also investigate whether the dust can be the same in the two components or not. The latter possibility has been suggested by investigations on the dust grain evolution in circumstellar disk where dust grain growth alters the dust grain properties in the circumstellar disk significantly while it is of less importance in the low-density envelope (see, e.g., Weidenschilling 1997a, 1997b). We concentrate on modelling the circumstellar disk, and compare and verify our results with simple models for the rather complex and highly-structured envelope.
Our millimeter and near-infrared observations and data reduction are described in brief in §2. In §3 we discuss the chosen models of both the circumstellar disk and envelope (§3.1), define the main heating sources of the dust (§3.2), compile the properties of the considered dust model (§3.3), and give a short overview about the radiative transfer model (§3.4). Based on the millimeter maps the parameters of the circumstellar disk are derived in §4 and compared with the results of the subsequent near-infrared light-scattering simulations in §5. Concluding remarks concerning the interpretation of our findings are given in §6.
2 Observations
2.1 Millimeter observations
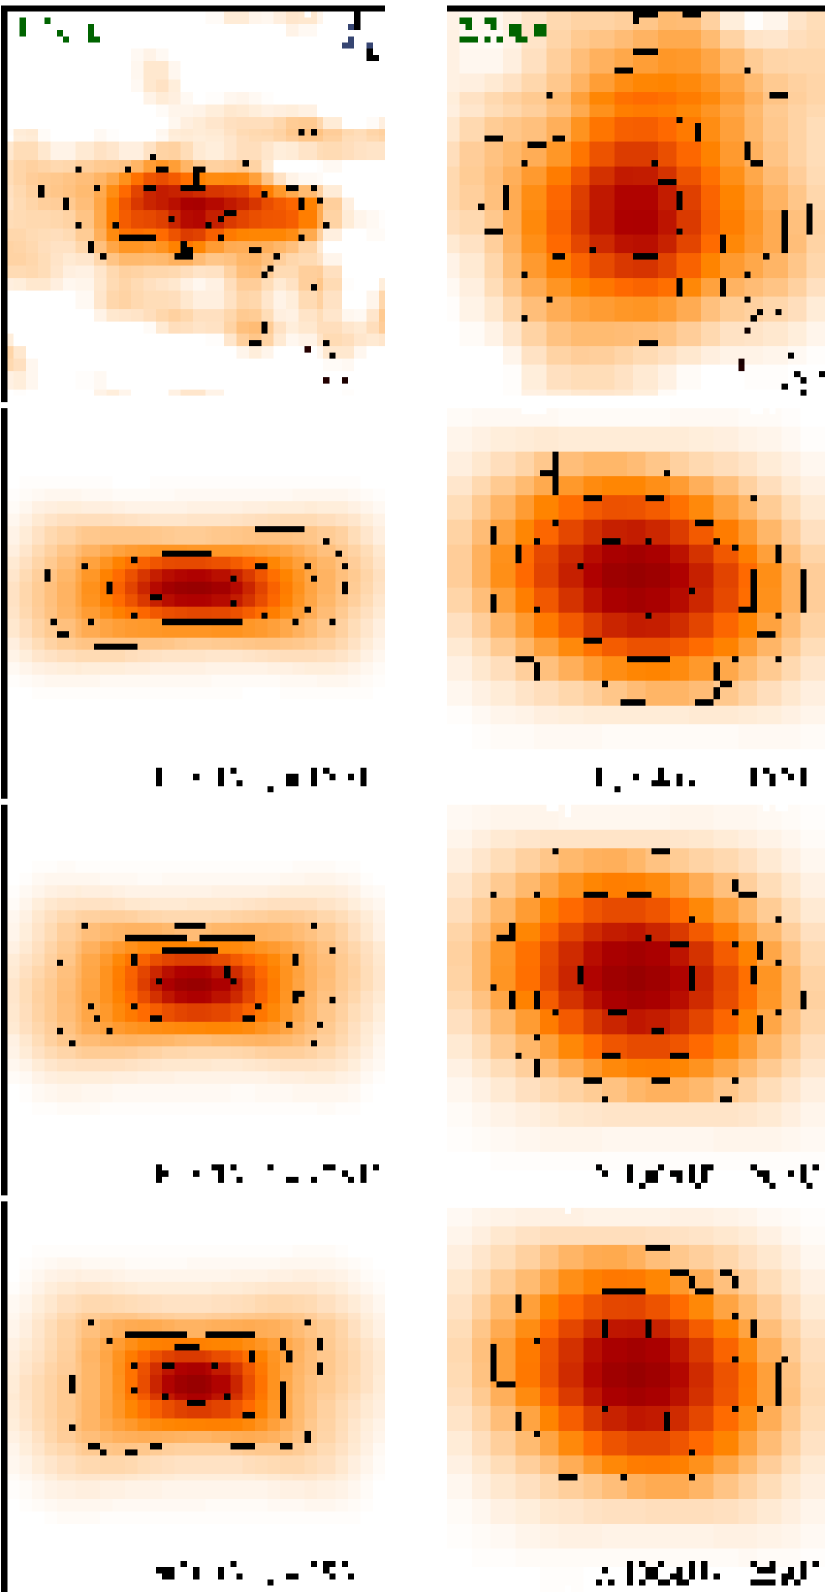
IRAS 04302+2247 was mapped in the 2.7 mm and 1.3 mm continua using the OVRO Millimeter Array. The obtained maps are shown in Fig. 2 (top row). Observations were made in four different configurations of the six 10.4m telescopes over the period from 1998 - 2001. The baselines span the range 30-480 meters, and yield a beamsize of at 2.7 mm and at 1.3 mm using robust weighting in the AIPS IMAGR routine. The deconvolved source size at the two observed wavelengths is by at PA = at 2.7 mm, and by at PA = at 1.3 mm. The measured flux densities are 22 2 mJy at 109.988 GHz and 83 9 mJy at 220.399 GHz. The results are compiled in Tab. 1.
At the same time, we mapped IRAS 04302+2247 in 13CO 1-0 and 2-1 lines and in the C18O 2-1 line also at the OVRO Millimeter Array. Strong 13CO 1-0 emission was found in a bar-like structure, which is centered on the position of the dust continuum source, and is extended precisely along the position angle of the dust lane visible in the near-infrared scattered light images (see § 2.2, Fig. 1) and millimeter continuum maps (see § 4, Fig. 2). The gas kinematics suggest that the molecular bar is a rotating disk. The integrated line profile is double-peaked. A velocity gradient along the major axis of the bar with a velocity extent of 6 km s-1 has been derived. Furthermore, in the velocity channel maps differential rotation is indicated by the shift of the 13CO emission back toward the central position at the velocity extrema (Padgett, Stapelfeldt, & Sargent 2001). We want to remark, that the continuum maps in combination with near-infrared images (Sect. 2.2) are the basis for the model of IRAS 04302+2247 presented in this paper, while the molecular line data will be discussed in detail in a future, separate publication (Padgett, in prep.).
| Wavelength | Net Flux | Peak Flux | Beam width | Beam P.A. |
|---|---|---|---|---|
| [mm] | [mJy] | [mJy/beam] | ||
| 1.36 | 14.7 | -70.73 | ||
| 2.74 | 8.7 | -77.81 |
2.2 Near-infrared observations
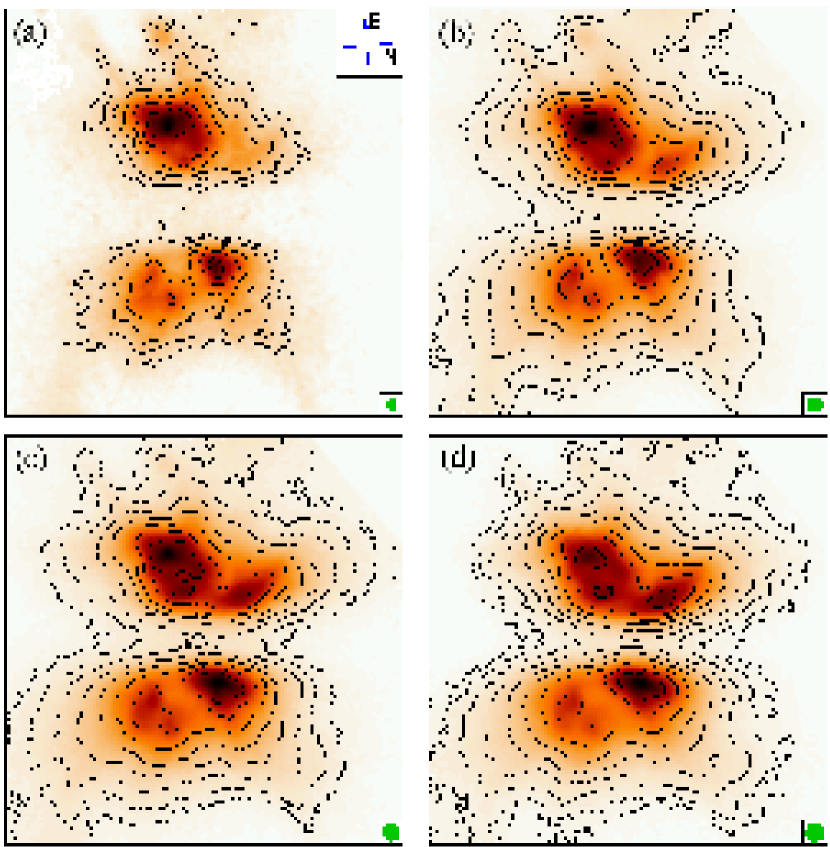
Near-infrared observations have been obtained with HST/NICMOS (see Thompson et al. 1998 for a description of the NICMOS instrument) on August 19, 1997. NIC2 and the filters F110W, F160W, F187W, and F205W have been used. The data reduction and flux calibration have been described in detail by Padgett et al. 1999. The resulting scattered light images are shown in Fig. 1. In order not to introduce further uncertainties of the brightness distribution we did not deconvolve the images but convolved the results of our light-scattering simulations (§5) with the corresponding point-spread functions obtained with the program TINYTIM v.4.4 (Krist 1997).
3 Modelling - General overview
In the following sections we give an overview about the simulation techniques and models which will be applied in §4 and §5 to model the millimeter emission and near-infrared scattered light images.
3.1 Disk and envelope structure
Our model of IRAS 04302+2247 consists of a circumstellar disk and an infalling envelope. While the circumstellar disk is assumed to be responsible both for the dark lane in the optical/infrared wavelength range and the millimeter structure of the object, an additional envelope is required to explain the extended scattered light structure. Although an infalling envelope, seen perpendicular to their axis of rotation symmetry, may also create a dark lane which hides the central star at optical/infrared wavelengths (see, e.g., Lucas & Roche 1997), the observed sharp transition of the dark lane towards the scattered light regions, which could be resolved for the first time in our NICMOS/HST images, points to the presence of a disk.
For the disk we assume a density profile as described by Shakura & Sunyaev (1973):
| (1) |
where is the radial distance from the star in the disk midplane, is the stellar radius, and is the disk scale height:
| (2) |
The quantities and will be used to scale the disk mass () and the scale height at a given radial distance from the star, respectively. This density profile profile has been successfully applied to model the circumstellar disks of HH 30 IRS (Burrows et al. 1996, Wood et al. 1998, Cotera et al. 2001) and HV Tau C (Stapelfeldt et al. 1998).
For the envelope we assume a density profile resulting from mass infall under consideration of envelope rotation (Ulrich 1976):
| (3) |
Here, is the mass of the central star, is the infall rate, is the centrifugal radius, is the polar angle between the radial vector of the particle and the z axis, and defines the direction of the initial streamline of the infalling material. For , the density shows a steep decrease which is in agreement with the spectral energy distributions (SED) of Class I sources (see, e.g., Butner et al. 1991) and the flux distribution of Class 0 sources in the radio wavelength range (see, e.g., Ward-Thompson et al. 1994). The density varies more slowly towards smaller radii, achieving for .
3.2 Heating sources
The main heating source for the circumstellar environment is the embedded star. Since it is completely obscured by the circumstellar disk, its effective temperature () and luminosity () cannot be derived directly. The bolometric luminosity of the object (, Padgett et al. 1999) may be used as a lower limit for the stellar luminosity. However, this is only a weak constraint since it could be derived from the scattered light only, the amount of which is also determined by the – rather complex – structure of the circumstellar envelope (see Yorke & Bodenheimer 1999 for the “flashlight” effect). For a similar reason, namely the unknown amount and optical properties of the light-scattering dust in the circumstellar envelope, it is too vague to derive the effective temperature of the star from the SED of the scattered light. For these reasons we assume typical parameters of a T Tauri star: , (Gullbring 1998) which correspond to a luminosity of under the assumption of a blackbody. As it finally turned out, the particular choice of a combination within the range of typical values for T Tauri stars is of much less importance than (a) the geometry and mass of the disk and (b) the dust grain properties.
Further heating of the disk is provided by accretion, whereby we assume the source of radiation being located in the midplane of the disk. Applying the viscous disk model by Lynden-Bell & Pringle (1974), the accretion luminosity of a circular ring with the surface and a radius is given by
| (4) |
The mass accretion rate results from
| (5) |
where characterizes the efficiency of the mechanism of angular momentum transport (“-disk” theory, Shakura & Sunyaev 1973) and
| (6) |
is the critical velocity (circular orbit). We assume a stellar mass of , corresponding to the other stellar parameters given above (Gullbring et al. 1998). Furthermore, we follow Hartmann et al. (1998), assuming an accretion parameter . In a very few cases of the most massive disks in our disk parameter space this would result in accretion luminosities larger than observed in classical T Tauri stars (see, e.g., Hartmann et al. 1998). Thus we restrict the total accretion luminosity to by adjusting the parameter .
3.3 Dust properties
Grain shape: We consider the dust grains to be homogeneous spheres. Although dust grains are expected to have a fractal structure, the scattering behaviour is similar to that of spheres (see Lumme & Rahola 1994 for porous dust particle light scattering). Furthermore, dust grains are expected to have a non-spherical shape (see, e.g., Elvius & Hall 1967, Scarrott et al. 1989, Hajjar & Bastien 1996, Kastner & Weintraub 1996, Dollfus & Suchail 1987, Johnson & Jones 1991, Chrysostomou et al. 2000). However, since we do not expect the grains to be aligned on a large scale by magnetic fields and thus, the assumption of spherical grains is a valid approximation (Wolf et al. 2003).
Grain chemistry: The strong absorption observed at 9.7 and 18 m, corresponding to stretching and bending modes in silicates on the one hand, and the strong extinction feature at 0.2175 m which can be approximately be reproduced by small graphite particles on the other hand (Stecher & Donn 1965; Wickramasinghe & Guillaume 1965), are the basis of a widely applied grain model: It incorporates both silicate and graphite material, represented in two separate grain populations. We use the optical data, i.e., the complex refractive index, of “smoothed astronomical silicate” and graphite published by Weingartner & Draine 2001111See also http://www.astro.princeton.edu/ draine.. Since the longest wavelength considered in our self-consistent radiative transfer (RT) simulations is 2 mm and the longest wavelength to be considered for image modelling is 2.74 mm, we extrapolate the refractive indexes on the basis of the astronomical silicate and graphite data published by Draine & Lee (1984), ensuring a smooth transition between both data sets. For graphite we adopt the usual “” approximation: , where and are the components of the graphite dielectric tensor for the electric field parallel and perpendicular to the crystallographic -axis, respectively ( is the extinction efficiency factor). As Draine & Malhotra (1993) have shown, this graphite model is sufficiently accurate for extinction curve modelling. Applying a silicate-to-graphite abundance ratio of (=3.1; Weingartner & Draine 2001), we derive relative abundances of 62.5 % astronomical silicate, 25 % graphite (), and 12.5 % graphite ().
Grain size distribution: We assume a grain size power-law of the form
| (7) |
where represents the particle radius, and and are the minimum and the maximum grain radii, respectively. For nm and nm, this grain size distribution is identical to the widely applied size distribution found for the interstellar medium by Mathis et al. (1977). Kim et al. (1994) showed, that the interstellar grain size distribution has to depart from a simple power law in order to achieve a good fit to the U, B, and V extinction data where the extinction curve changes slope and in the ultraviolet. As a solution these authors propose an additional parameter for the size distribution to provide an exponential cutoff beyond . However, in the circumstellar environment of a T Tauri star, such as IRAS 04302+2247, the grain evolution is expected to depend on the particular considered region: Dust grain evolution processes, such as grain growth (see, e.g., Beckwith et al. 2000), are expected to occur on much shorter timescales in the inner, dense region of the circumstellar disk than in the less dense outer regions or even the circumstellar envelope (Weidenschilling 1997a) - thus, a radial and vertical dependence of the grain size distribution is expected. Furthermore, dust settling and the resulting increase of the grain–grain interaction probability will result in a further vertical dependence of the grain size distribution (see, e.g., Weidenschilling 1997b). Beside the grain evolution, mixing processes, such as convection within the circumstellar disk have to be considered (see, e.g., Klahr et al. 1999). Since the separate processes, and, even more, their mutual influence during the evolution of the circumstellar environment is still rather poorly understood, we assume the simple power-law given in Eq. 7 to be valid both throughout the disk and the circumstellar envelope, but discuss possible corrections if necessary. We fix the lower grain size ( nm), but leave the upper grain size as a free parameter, allowing us to change the dust properties, such as the opacity and scattering behaviour.
Based on the dust grain size distribution given in Eq. 7, the total mass of the circumstellar disk and envelope can be estimated from
| (8) |
where we assume a gas-to-dust mass ratio and a grain mass density The quantity is the exponent of the grain size distribution. Since both, the gas-to-dust mass ratio and the grain mass density have no impact on the RT, the total mass derived, e.g., for the circumstellar disk in §4 may be corrected accordingly if future observations reveal other values for these quantities. For example, a more porous, fractal structure of the grains may result in a significantly smaller grain mass density but would also have implications on the light scattering and absorption behaviour of the grains (see, e.g., Wright 1987, Lumme & Rahola 1994).
At this point, we would like to remind the reader, that only the resulting extinction and scattering behaviour of the dust grain ensemble is of importance for the temperature structure and reemission properties of the disk and the scattering in the circumstellar envelope (beside the disk geometry and density distribution and the heating sources). Since these properties of the grain ensemble are a fairly complex function of the grain size distribution and dust grain chemistry, each of which is based on assumptions, it is not possible to derive a unique solution in the fitting procedure for the observed millimeter and near-infrared images. However, restricting ourselves to a minimum set of model parameters and choosing reasonable parameters for each of those will allow to derive at least qualitative results, while the particular quantitative result derived from the best fit to the observed data always has to be considered in context of the restrictions of the applied model, i.e., compact spherical homogeneous grains with a power-law grain size distribution and the discussed silicate/graphite mixture.
The interaction between the radiation field and the dust grains is described by Mie theory. In order to do this two problems had to be investigated first: (1) the radiative transfer in dust grain mixtures and (2) the numerical description of Mie scattering in case of large size parameters.
1. Dust grain mixtures: For the most accurate solution of the RT problem in a dust grain mixture one had to consider an arbitrary number of separate dust grain sizes within a given interval and different chemical populations in order to derive the temperature distribution and therefore the contribution to the (re)emitted radiation of each grain species. Those observables, based on the RT considering each grain species separately are close to the observables resulting from RT simulations based on weighted mean dust grain parameters of the dust grain ensemble (Wolf 2003). Thus, we use weighted mean values for the efficiencies factors, cross sections, the albedo, and scattering matrix elements. For each dust grain ensemble, logarithmically equidistantly distributed grain sizes within the interval have been taken into account for each chemical component in the averaging process.
2. Large size parameters x: The size parameter is defined as the ratio of the grain radius to the wavelength of the incident electromagnetic radiation
| (9) |
(surrounding medium: vacuum). Since previously widely applied Mie scattering codes, such as the code by Bohren & Huffman (1983) fail for large size parameters (), we calculate the Mie scattering function using the numerical solution for the estimation of the Mie scattering coefficients published by Voshchinnikov 2002, which achieves accurate results both in the small as well as in the – arbitrarily – large size parameter regime222The code for calculation of the Mie scattering coefficients is available at http://spider.ipac.caltech.edu/staff/swolf/miex-web/miex.htm.. This was necessary since we consider particle sizes up to 10 cm in the following whereby the shortest considered wavelength was 50 nm, resulting in a size parameter of . An alternative solution would have been the combination of existing Mie scattering codes and geometric optic solutions for the small and large size parameter range, respectively.
Although we applied the Mie scattering function for the description of the scattering behaviour of the dust grain ensemble in the following, we also compared the results of our simulations with those based on the much more simple approach by Heyney & Greenstein (1941), where the scattering parameter was derived from the scattering matrix element
| (10) |
and the (one-parameter) phase function can be written as
| (11) |
where is the scattering angle. We found the difference between both results to be negligible compared to the influence of the other model parameters.
3.4 Continuum Radiative Transfer
For our continuum radiative transfer (RT) simulations we use the program MC3D.
It is based on the Monte-Carlo method and solves the continuum RT problem self-consistently, i.e.,
it estimates the dust temperature distribution taking into account any heating sources.
It makes use of the temperature correction technique as described by Bjorkman & Wood (2001),
the absorption concept as introduced by Lucy (1999), and the enforced scattering scheme as
proposed by Cashwell & Everett (1959). The radiation field is described by Stokes parameters, i.e.,
in interaction processes of the radiation with the circumstellar matter (absorption, scattering)
its polarization state is taken into account. Multiple (anisotropic) scattering is considered.
The numerical details of MC3D have been described in previous publications
(Wolf et al. 1999, Wolf & Henning 2000,
Wolf 2002333Selected parts of the MC3D documentation, results of previous applications, and
executables of the code, prepared for particular models, are available at
http://www.mpia-hd.mpg.de/FRINGE/SOFTWARE/mc3d/
(current US mirror page:
http://spider.ipac.caltech.edu/staff/swolf/mc3d/).).
Thus, we restrict the following description on its particular adaption to the models considered
in the subsequent sections.
In order to derive a spatially resolved dust temperature distribution, the model space has to be subdivided into volume elements inside which a constant temperature is assumed. Both the symmetry of the density distribution and the density gradient distribution have to be taken into account. We use a spherical model space, centered on the illuminating star and use a equidistant subdivision of the model in -direction, while a logarithmic radial subdivision in order to resolve the temperature gradient at the very dense inner region of the disk is applied. The required spatial resolution at the disk inner radius is in the order of in case of the models discussed in the subsequent chapters.
The RT is simulated at 100 wavelengths, logarithmically equidistantly distributed in the wavelength range . The complex refractive index of the dust grain species (based on which the efficiency factors, etc., are calculated) has been derived by interpolation of the data sets discussed in §3.3.
4 Modelling: Millimeter wavelength range
Although the 1.36 mm and 2.74 mm images are simply structured (see Fig. 2), both images provide three decisive parameters:
-
1.
The net flux,
-
2.
The peak flux, and
-
3.
The spatial brightness distribution, whereby in case of =1.36 mm the spatial brightness distribution would even have to be described by more than one parameter.
These parameters are found to be almost independent, i.e., within the considered parameter space, models can be found which match one or two of these parameters but do not agree with the observations considering the other parameter(s). Another advantage is the fact that both the fluxes (peak, net) as well as the spatial brightness distribution change dramatically between the =1.36 mm and 2.74 mm, i.e., we have 6 (almost) independent parameters to be fitted.
Based on the model described in general in §3, we have the following adjustable model parameters:
-
1.
The inner and outer disk radius (, ). The inner disk radius is set to , corresponding to an assumed dust sublimation temperature of 1600 K, taking into account not only the direct stellar heating but also the reemission of the dust at the very dense, optically thick inner region of the disk. A first guess for the outer radius we derive from both the 1.36 mm map and the near-infrared scattered light images. We assume a value of =300 AU, but also consider models with outer radii of 200 AU and 450 AU.
-
2.
The exponents and which describe the radial density profile and disk flaring, respectively (Eq. 1). For the flaring parameter we consider three different cases discussed in the literature: (Kenyon & Hartmann 1987), (D’Alessio et al. 1999), and (Chiang & Goldreich 1997). We use the relation
(12) which results from viscous accretion theory (Shakura & Sunyaev 1973), to calculate a reasonable corresponding value of . These values are also in agreement with the results of former disk modelling efforts444The cited authors have not derived best-fit values for the parameters and but have shown that the theoretically predicted values allow appropriate modelling of particular circumstellar disks in the T-Tauri phase. (see, e.g., Burrows et al. 1996, Stapelfeldt et al. 1998, Cotera et al. 2001, Wood et al. 2002).
-
3.
The scale height of the disk at a given radius. In the following we fix the scale height at a radial distance from the star of =100 AU and consider four different cases: (100 AU) = 5 AU, 10 AU, 20 AU, and 40 AU. This very wide parameter range does not only cover scale heights found for other circumstellar disks but also ensures us to contain the value for IRAS 04302+2247 with a very high likelihood. However, a more narrow parameter range, also for the other model parameters, will be considered subsequently.
-
4.
We consider disks with masses of , , and , corresponding to the typical masses of dust expected and found in case of T Tauri disks (Shu et al. 1987; Beckwith et al. 1990; see also the publications by McCaughrean et al. 2000, Mundy et al. 2000, Natta et al. 2000, Wilner & Lay 2000 and references therein).
-
5.
For the upper radius of the grain size distribution we used the following trial values: , , , , , . The lowest value is justified by extinction curve modelling of the interstellar medium (Mathis et al. 1972). However, the slopes of the submillimeter/millimeter SEDs of circumstellar disks were found to be shallower than predicted from grain population of the interstellar medium (see, e.g., Beckwith et al. 1990, Beckwith & Sargent 1991), indicating larger mean grain sizes: Calvet et al. 2002 suggest particle sizes up to 50 cm in the presumed inner disk and 1 cm in the outer disk of the 10 Myr old protoplanetary disk of TW Hya, and Wood et al. 2002 propose millimeter sized grains in the disk around the T Tauri star HH 30.
The inclination of the disk was fixed at 90o (edge-on orientation) since a simulation the near-infrared scattered light images revealed an inclination of (see §5). Based on the scattered light images and the 1.3 mm map, we assume a position angle of the dust lane of 175o.
For comparison with the observational results, images of the disk with the same resolution as the observed maps have been computed and convolved with the measured beam profile. Since the beam profiles are affected by statistical noise, only those structures of the beam profile for which the intensity was larger than were taken into account, where is the half width of the full maximum of the intensity distribution (assuming the intensity statistics of the observed map being dominated by white background noise). For the same reason and in order to consider only the most significant features, the net intensity measurements in case of both the observations and the simulated images take into account values larger than 30% of the maximum intensity.
For grain size distributions with upper radii of , , and the simulated net and peak fluxes are smaller than the observed fluxes. For maximum grain sizes of and , on the other hand, the amount of the measured fluxes has been achieved but no model was found for which all simulated fluxes agree with the observed ones at the same time. One has to take into account, that the models for which at least separate fluxes agree with the observations are those with masses at the upper end of the considered mass parameter range. For those, the midplane of the disk is optically very thick which adds another complexity to the relation between the model parameters and the resulting fluxes, i.e., the disk-mass to millimeter-reemission relation is far from being linear: The higher optical depth (with increasing disk mass) results (a) in a less efficient heating of the disk and (b) in a higher absorption of the reemitted radiation (as illustrated in Fig. 4, the best-fit model discussed below is optically thick in the midplane as seen from the star even at submillimeter/millimeter wavelengths).
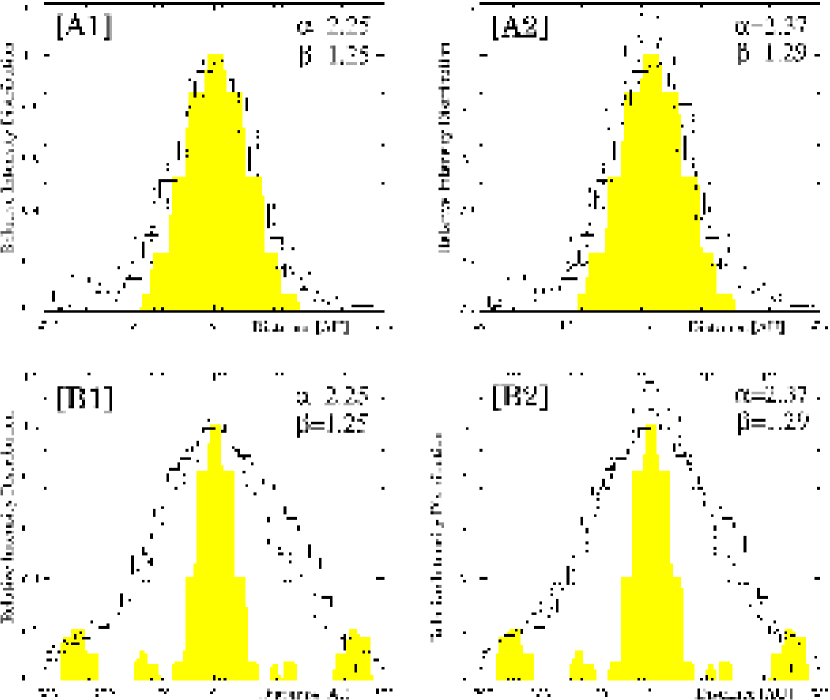
The only grain size distribution for which an agreement between all measured and simulated fluxes has been found is the one with . The best agreement was then found for =300 AU, and , (100 AU)=20 AU, and . In particular, the extent of the disk assuming =200 AU / =450 AU was found to be too small / too large compared with the observed image. Furthermore, all fluxes have been found to be too small in case of , while their difference between models with and is negligible compared to the uncertainty of the measurements (see Fig. 3 - an simultaneous increase of the and results in a slightly more peaked intensity distribution). Based on a more narrow parameter range around the values compiled above we found the following disk parameters: =300 AU, (), (100 AU)=15 AU, and . The optical depth in the disk midplane as seen from the star amounts to (550 nm). Thus, the disk is mainly heated by stellar radiation emitted into directions far above the midplane and scattered in less dense regions of the disk (; see Chiang & Goldreich 1997).
The difference of the observed and simulated peak/net fluxes is smaller than 16% and therefore within the error interval of the observed values. For illustration of the results, in Fig. 2 the resulting images for three different scale heights are shown in comparison with the 1.36 mm and 2.74 mm map. As Fig. 2 and Fig. 4 make clear, the disk is much less resolved at 2.74 mm (see §2.1 for the corresponding beam sizes). Furthermore, Fig. 3 shows the intensity in the midplane and perpendicular to it as it has been found for (100 AU)=15 AU, 20 AU, and 25 AU for and , respectively.
A preprint of this article with high-quality figures can be downloaded from: http://spider.ipac.caltech.edu/staff/swolf/homepage/public/preprints/i04302.ps.gz
A preprint of this article with high-quality figures can be downloaded from: http://spider.ipac.caltech.edu/staff/swolf/homepage/public/preprints/i04302.ps.gz
We found further solutions for grain size distributions with maximum grain sizes larger than investigated above (for cm). However, since those models require much larger disk masses (which is in contradiction to T Tauri disk models), we consider the described model as the most reasonable.
A preprint of this article with high-quality figures can be downloaded from: http://spider.ipac.caltech.edu/staff/swolf/homepage/public/preprints/i04302.ps.gz
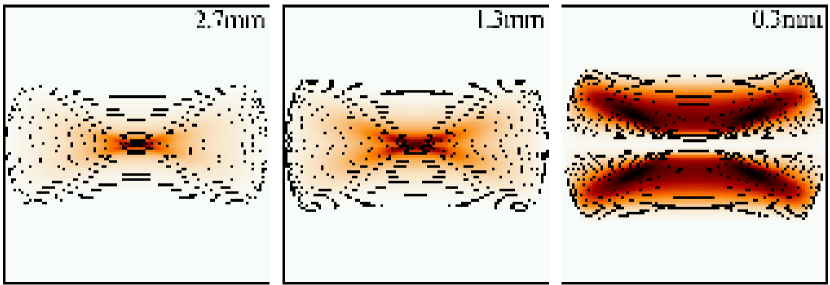
In Fig. 4 corresponding high-resolution intensity maps at the considered wavelengths are compared with an image at 0.3 mm - a wavelength at which high-resolution of circumstellar disks could be obtained with the planned Atacama Large Millimeter Array (ALMA). While the 1.3 mm and 2.7 mm images trace the region close to the midplane best, high-resolution sub-millimeter maps would give even stronger constraints on the radial disk scale height distribution than we are able to derive from the resolved, low-resolution 1.3 mm map.
5 Constraints from near-infrared scattered light images
We now combine the disk and envelope by
| (13) |
where is the coordinate of any point inside the model space and and are the density distribution of the disk (Eq. 1) and the density distribution in the envelope (Eq. 3), respectively. This way, a smooth transition of the disk to the envelope density is provided without modifying the density structure of the optically thick, millimeter-bright part of the disk555It is in principle possible to chose envelope parameters in Eq. 3 which result in a density in the midplane higher than that of the disk. However, in the considered models this is not the case..
Since the scattered light images reveal a highly irregularly structured envelope, it is the aim of the following simulations to reproduce its main parameters (but not particular details):
-
1.
The wavelength-dependent width of the dust lane,
-
2.
The relative change of the brightness distribution from 1.1 m to 2.05 m, and
-
3.
The slight symmetry of the location of the brightest spots of the 1.60 m to 2.05 m images perpendicular to the midplane.
The model is restricted to a sphere with a radius of 300 AU around the illuminating star in order to consider the main scattering region. We want to remark that the images in Fig. 1 show a slight scattering also outside this range, but no further, valuable information is expected from modelling these weak extended structures.
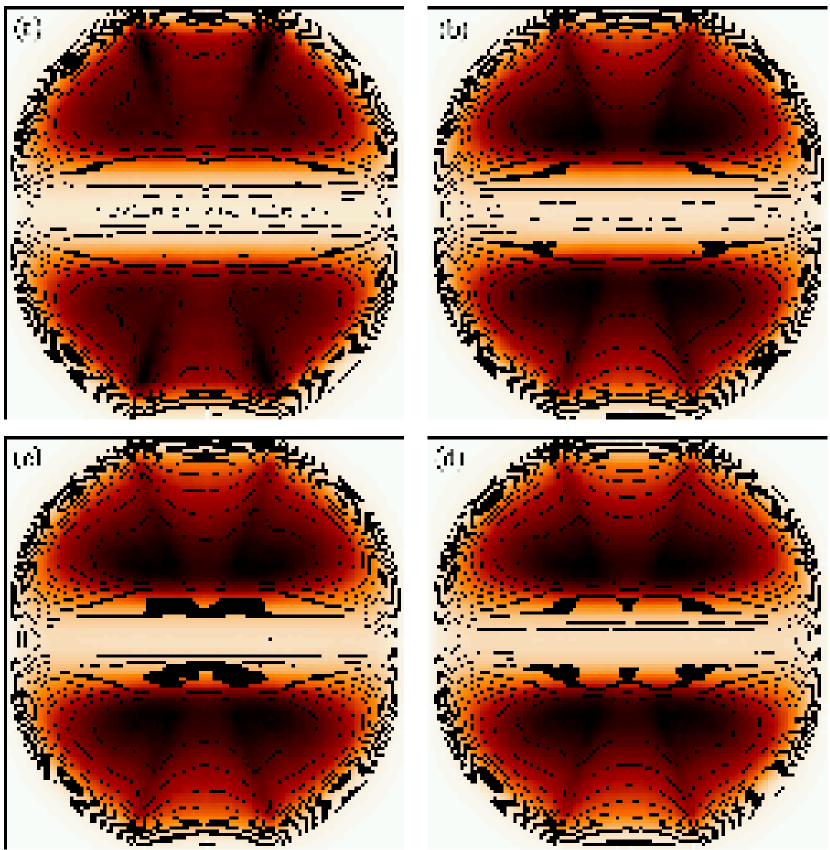
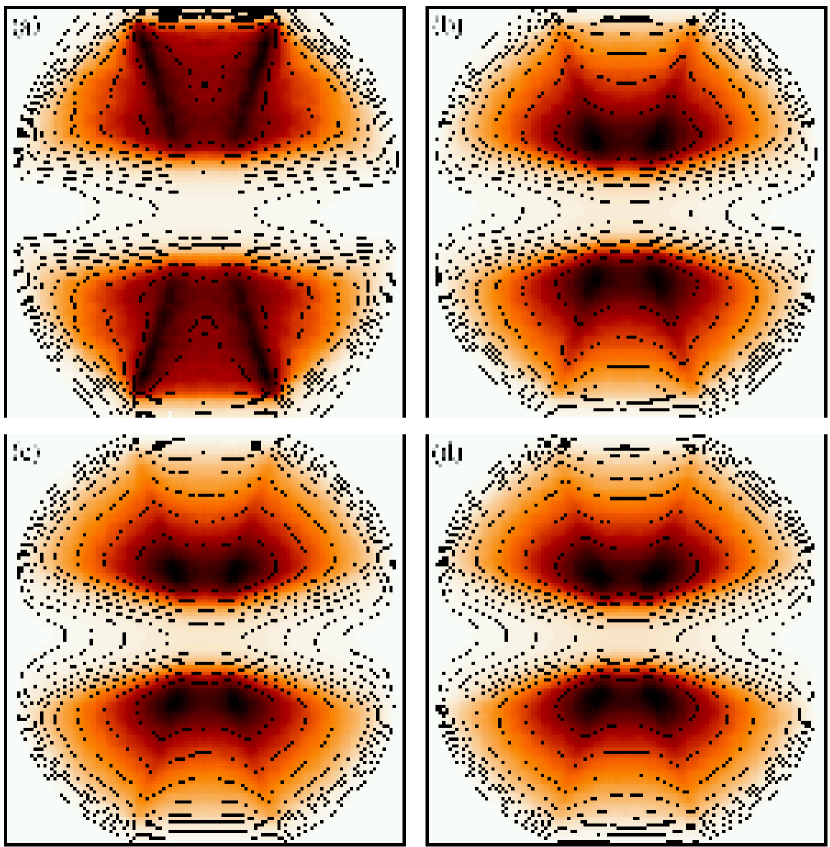
The apparent (slight) mirror symmetry of the 1.60 m to 2.05 m images perpendicular to the midplane can be explained and achieved in the simulations under the assumption of optically thin outflow cones, centered on the illuminating star. Beside geometrical arguments, the assumption of the existence of an outflow cone is supported by a small, low-velocity CO outflow that is associated with IRAS 04302+2247 (Bontemps et al. 1996). Furthermore, Gomez et al. (1997) have found two Herbig-Haro objects several arcminutes northwest overlying the blue-shifted lobe of the outflow. We found the best agreement with the observations for a cone of the form
| (14) |
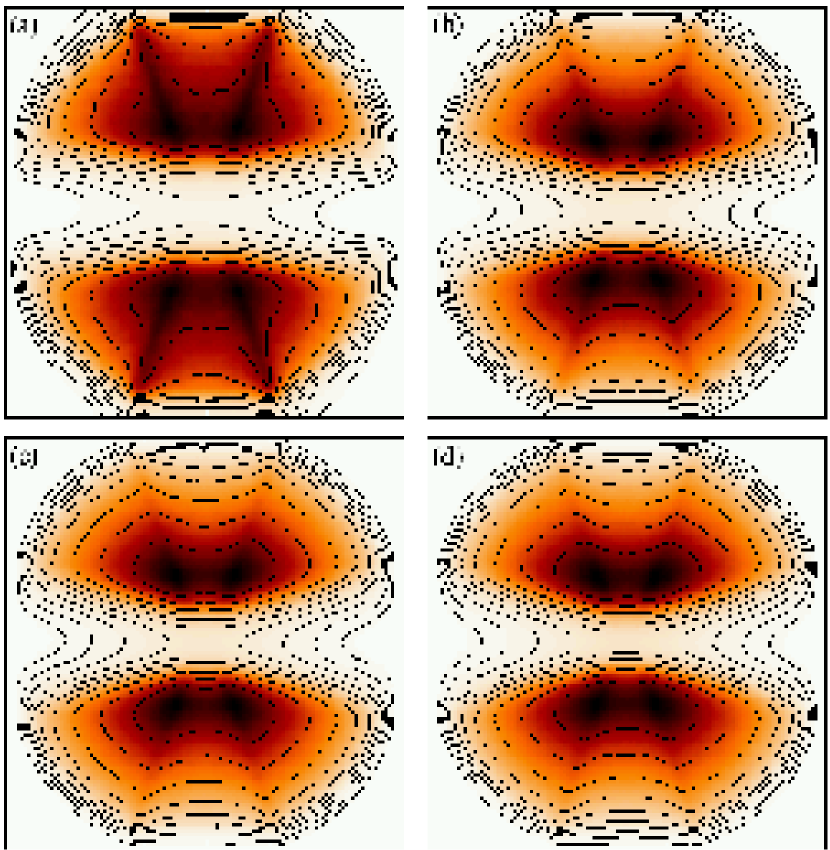
where describes the boundary of the cone, AU, , and =1.21 ( and are given in units of AU). Introducing the cone one achieves (a) the two intensity peaks close to the apparent upper boundary of the disk, (b) the increase of the intensity towards larger wavelengths, and (c) a “V”-shaped increase of the intensity far above the midplane in case of the shorter wavelengths. While the features (a) and (b) are obviously “real”, the high intensity at shorter wavelengths high above the midplane (c) was found only in the upper left quadrant of the observed images. Either, the optical depth towards to other (three) intensity peaks resulting from light scattering on the inner boundary of the outflow cone is higher than towards the visible one, or the only visible one is not “real” but results from a local density enhancement, i.e., the “V”-shaped intensity profile far above the midplane is negligibly weak. The transition from the first to the second scenario can be mainly achieved by a decrease of the mass infall rate and is illustrated in Fig. 6 and Fig. 7.
The width of the dust lane is mainly determined by the disk properties. Applying the disk parameters found on the basis of the millimeter continuum measurements (§4), the width of the dust lane is well reproduced for m, but its decrease towards longer wavelengths is much weaker than observed. An agreement with the observations can be achieved under the assumption of a higher scale height (100 AU), in particular (100 AU)=25 AU instead of 15 AU. In this model, the mass of the disk had to be decreased by a factor of 3.5. The resulting scattered light images are shown in Fig. 5.
However, this result is not satisfying since the simulated 1.36 mm maps in Fig. 2 clearly support a smaller scale height and a higher mass. Therefore, another parameter to be considered is the grain size distribution in the regions being traced by the near-infrared measurements, i.e., the envelope and the disk surface. Fig. 4 clearly shows that the millimeter observations trace a region which is slim compared with the width of the dust-lane in the near-infrared wavelength range and is located below the near-infrared scattering surface of the disk. Thus, the assumption of another dust species in the disk surface and envelope does not contradict the 1.36 mm/2.74 mm model. Applying a grain size distribution as for the interstellar medium, i.e., a minimum grain size =0.05 m and a maximum grain size =0.25 m (Mathis et al. 1977), the near-infrared scattered light images are well reproduced under the assumption of the geometrical disk parameters as found in §4. If these grains are assumed in both the envelope and the whole disk, the mass of the system amounts to which is in agreement with findings of Moriaty-Schieven et al. (1994) and Lucas & Roche (1997) who estimated a mass of the system of 12 per cent based on a pure envelope model without a separate disk component (by comparison with ground-based, and therefore much less resolved near-infrared observations), and from 800 m photometry of the thermal dust continuum, respectively. This mass is by a factor of 10 smaller than that resulting from our millimeter continuum model. This huge discrepancy strongly supports the hypotheses that two distinct dust grain species are required to fit the millimeter and near-infrared observations simultaneously is verified. The mass of the envelope alone amounts to about (see Fig.6 and 7). Another property of the images which can be better reproduced by the small grain size distribution is the overall brightness distribution: In agreement with the observations, the intensity is much more concentrated in the light-scattering centers on the disk surface and inner boundaries of the outflow cones in case of the small grain size distribution.
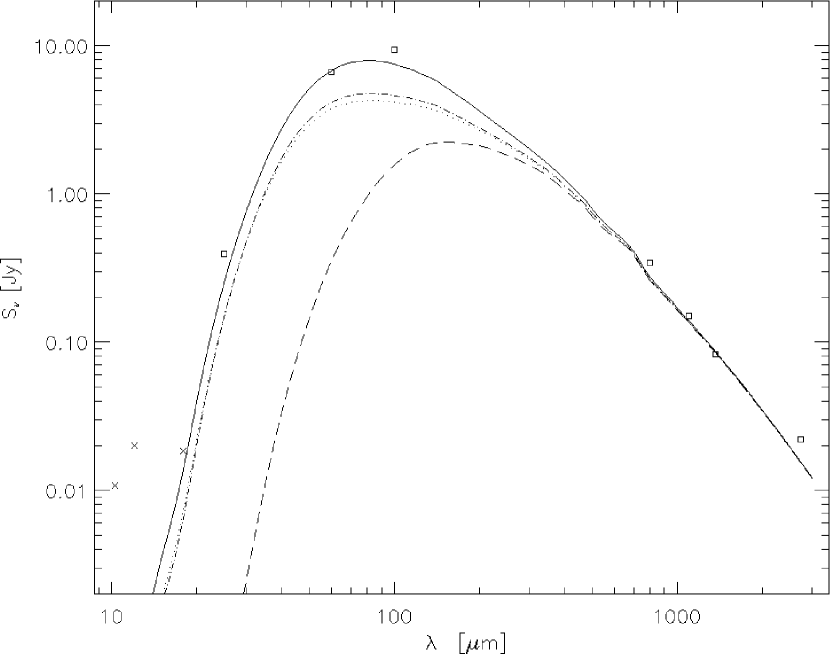
A further, independent test of the combined envelope plus disk model can be achieved by comparing the resulting SED with observed fluxes over a large wavelength range. We consider the wavelength interval m - 3 mm where most of the dust reemission occurs. Scattered radiation in the optical to near-infrared wavelength range is not consider here, since the observed images show that large-scale irregular structures determine the appearance and therefore the short-wavelength fluxes of IRAS 04302+2247. In contrast to the scattered light images modelled above, we now also have to consider dust outside the radius of 300 AU. According to the images shown in Fig. 1, we assume a maximum extension of the envelope of 450 AU (radial distance to the star) above the disk. In Fig. 8 the solid line as the result of our simulations shows a very good agreement with the observed SED. Comparing the SED of the disk alone (dashed line in Fig. 8) with the reemission of the whole system (disk+envelope), we find that the SED is dominated by the reemission from the envelope up to a wavelength of about 174m (see also Fig. 9).

A preprint of this article with high-quality figures can be downloaded from: http://spider.ipac.caltech.edu/staff/swolf/homepage/public/preprints/i04302.ps.gz
| Wavelength | Flux |
|---|---|
| [m] | [mJy] |
| 0.90(e)(e)L. Hillenbrand (priv. comm.). | 0.05 |
| 1.10(a)(a)This work; see § 2.2 for details. | 1.60 |
| 1.60(a)(a)This work; see § 2.2 for details. | 10.4 |
| 1.87(a)(a)This work; see § 2.2 for details. | 18.1 |
| 2.05(a)(a)This work; see § 2.2 for details. | 18.3 |
| 10.3(e)(e)L. Hillenbrand (priv. comm.). | 10.8 |
| 12(c)(c)IRAS flux measurements (Clark 1991). | 20 |
| 17.9(e)(e)L. Hillenbrand (priv. comm.). | 18.5 |
| 25(c)(c)IRAS flux measurements (Clark 1991). | 391 |
| 60(c)(c)IRAS flux measurements (Clark 1991). | 6640 |
| 100(c)(c)IRAS flux measurements (Clark 1991). | 9430 |
| 800 (d)(d)Moriarty-Schieven et al. (1994). | 342 |
| 1.1(d)(d)Moriarty-Schieven et al. (1994). | 149 |
| 1.36(b)(b)This work; see § 2.1 for details. | 83 |
| 2.73(b)(b)This work; see § 2.1 for details. | 22 |
6 Discussion and Conclusions
Based on near-infrared scattered light images and resolved millimeter maps we have modeled the circumstellar environment of the “Butterfly Star” IRAS 04302+2247 in Taurus. Our main intention was to model the properties of its large edge-on circumstellar disk for which we found the following parameters:
-
•
Outer disk radius =300 AU,
-
•
Parameters describing the disk flaring and (relative) radial density profile: and (whereby pre-defined combinations have been considered), and
-
•
Scale height (100 AU)=15 AU.
The resulting mass of the disk amounts to . Based on a grain size distribution of an interstellar-like mixture of grain chemistries containing astronomical silicate and graphite grains we find a minimum upper grain size of about m. While for upper grain sizes above this value up to about 2 cm no agreement with the millimeter observations was found, grain size distributions with maximum grain sizes above 2 cm do reproduce these observations as well. Nevertheless, we suggest the m solution to be the most reasonable since larger upper grain sizes result in larger masses of the disk which is in contradiction to theoretical models of low-mass young stellar object disks (Shu et al. 1987; Beckwith et al. 1990; see also the publications by McCaughrean et al. 2000, Mundy et al. 2000, Natta et al. 2000, Wilner & Lay 2000 and references therein). In agreement with the results from modelling the circumstellar disks of HH 30 IRS (Cotera et al. 2001, Wood et al. 2002) and TW Hya (Calvet et al. 2002) this finding can be interpreted as grain growth in the dense regions of the disk. However, there are two approaches which might prevent the introduction of such large grains in these kind of models: (1) A flatter radial density profile, i.e., a smaller exponent in Eq. 1, and (2) A more efficient heating or a higher initial temperature of the dust in addition to heating by the embedded star. The first approach would require modifications to already well-established circumstellar disk models, allowing the embedded star to heat the disk midplane much more efficiently than it is possible in the models considered in our investigations. We found that =1.2-1.5 would be required which is not met by any of these models. The second suggestion, however, would need a detailed re-examination of the viscous and other (also external) heating processes leading to a higher temperature of the dust close to the very dense regions close to the midplane of the disk. In agreement with the modelling efforts for, e.g., the HH 30 circumstellar disk mentioned above, we considered the stellar and viscous heating as the main heating sources. But, we also found that the assumption of an initial dust temperature of about 10 K in the dense parts of the disk would result in the observed millimeter fluxes (and the resolved 1.3 mm image) under the assumption of a smaller (e.g., the interstellar) grain size distribution as well. Interestingly, this is the temperature regime which is assumed to be maintained in the innermost regions of Bok globules even under the neglection of external heating sources (see, e.g., Clemens et al. 1991).
The near-infrared scattered light images in the wavelength range between 1.10 m and 2.05 m have been used to verify the disk and dust parameters found on the basis of the millimeter observations. It turned out that much smaller grains are required in the upper layer of the disk and the circumstellar envelope in order to achieve an agreement between the obtained disk geometry and the wavelength-dependent width of the dust lane between the scattering lobes. Furthermore, the smaller grains do better reproduce the contrast between the scattering centers and the weaker structures in the observed images.
We conclude that, based on the example of the Class I source IRAS 04302+2247, we found a first observational hint for different dust evolutionary scenarios in the dense circumstellar disk and the circumstellar envelope of young stellar objects: While dust grain growth results in m sized grains in the disk midplane, the grain size in the circumstellar envelope is much more similar to interstellar medium grains.
We want to point out that further modelling of the presented observations is required in order to verify the quantitative results: Instead of a fixed density distribution, the vertical structure of the circumstellar disk should be derived simultaneously with the temperature structure in an iterative procedure, based on the condition of hydrostatic equilibrium. Since the accretion luminosity amounts to only 0.74% of the stellar luminosity in the best-fit disk model, the initial coupling between the radial and vertical density structure as stated by Eq. 12 will have to be given up in order to find out if the theoretically predicted values for and do really provide a unique description of the disk structure of IRAS 04302+2247. Furthermore, the density and temperature profile at the very inner region of the massive circumstellar disk (within a radius of 1 AU) has significant influence on the heating of the outer region of the disk through dust reemission, since here the stellar radiation – which is the dominant energy source – is reprocessed. While the approximation of mean dust grain parameters describing the optical properties of dust grain ensembles holds in the optically thick disk regime, the sublimation radii and dust grain temperature distribution in the inner region, which is directly heated by the star, strongly depend on the particular grain size and chemical composition. However, these questions are beyond the scope of the recent study and will be considered in a future publication.
References
- (1) Beckwith, S.V.W., Henning, Th., Nakagawa, Y. 2000, in Protostars and Planets IV, eds. Mannings, V., Boss, A.P., Russell, p. 533
- (2) Beckwith, S.V.W., Sargent, A. 1991, ApJ, 381, 250
- (3) Beckwith, S.V.W., Sargent, A. Chini, R.S., Güsten, R. 1990, AJ, 99, 3
- bjorman (2001) Bjorkman, J.E., Wood, K. 2001, ApJ, 554, 615
- (5) Bohren C.F., Huffman D.R., Absorption and scattering of light by small particles. John Wiley & Sons, New York (1983)
- (6) Bontemps, S., Andr, P., Terebey, S., Cabrit, S. 1996, A&A, 311, 858
- (7) Burrows, C.J., Stapelfeldt, K.R., Watson, A.M., Krist, J.E., Ballester, G.E., et al. 1996, ApJ, 473, 437
- (8) Butner, H.M., Evans, H.J., Lester, D.F., Levreault, R.M., Strom, S. 1991, ApJ, 376, 636
- (9) Calvet, N., D’Alessio, P., Hartmann, L., Wilner, D., Walsh, A., Sitko, M. 2002, ApJ, 568, 1008
- (10) Cashwell, E.D., Everett, C.J., A practical manual on the Monte Carlo Method for random walk problems. Pergamon, New York, (1959)
- (11) Chiang, E.I., Goldreich, P. 1997, ApJ, 490, 368
- (12) Chrysostomou, A., Gledhill, T., Mnard, F., et al. 2000, MNRAS, 312, 103
- cl (91) Clark, F.O. 1991, ApJSS, 75, 611
- (14) Clemens, D.P., Yun, J.L., Heyer, M.H. 1991, ApJSS, 75, 877
- (15) Cotera, A.S., Whitney, B.A., Young, E., Wolf, M.J, Wood, K., et al. 2001, ApJ, 556, 958
- (16) Dollfus, A., & Suchail, J.-L. 1987, A&A, 187, 669
- draine (1984) Draine, B.T., Lee, H.M. 1984, ApJ, 285, 89
- (18) Draine, B.T., Malhotra, S. 1993, ApJ, 414, 632
- (19) Elvius, A., & Hall, J.S. 1967, Lowell Obs. Bull. 7, 17
- (20) Gullbring E., Hartmann L., Briceo C., Calvet N. 1998, ApJ492, 323
- (21) Gomez, N., Whitney, B.A., Kenyon, S.J. 1997, AJ, 114, 1138
- (22) Hartmann, L., Calvet, N., Gullbring, E., D’Alessio, P. 1998, ApJ, 495, 385
- (23) Hajjar, R., & Bastien, P. 1996, in ASP Conf. Ser. 97, Polarimetry of the Interstellar Medium, eds. W.G. Roberge, & D.C.B. Whittet, 355
- (24) Heyney, L.C., Greenstein, J.L. 1941, ApJ, 93, 70
- (25) Johnson, J.J., & Jones, T.J. 1991, AJ 101, 1735
- (26) Kastner, J.H., & Weintraub, D.A. 1996, in ASP Conf. Ser. 97, Polarimetry of the Interstellar Medium, eds. W.G. Roberge, & D.C.B. Whittet, 212
- (27) Klahr, H.H., Henning, Th., Kley, W. 1999, A&A, 514, 325
- (28) Krist, J. 1997, “The Tiny Tim User’s Guide v.4.4”
- (29) Lucas, P.W., Roche, P.F. 1997, MNRAS, 286, 895
- (30) Lucas, P.W., Roche, P.F. 1998a, MNRAS, 299, 699
- (31) Lucas, P.W., Roche, P.F. 1998b, MNRAS, 299, 723
- lucy (1999) Lucy, L.B. 1999, A&A, 344, 282
- (33) Lumme, K., Rahola, J. 1994, ApJ, 425, 653
- (34) Lynden-Bell, D., Pringle, J.E. 1974, MNRAS, 168, 603
- mathis (1977) Mathis, J.S., Rumpl, W., Nordsieck, K.H. 1977, ApJ, 217, 425
- (36) McCaughrean, M.J., Stapelfeldt, K.R., Close, L.M. 2000, in Protostars and Planets IV, eds. Mannings, V., Boss, A.P., Russell, p. 485
- (37) Moriaty-Schieven, G.H., Wannier, P.G., Keene, J., Tamura, M., 1994, ApJ, 436, 800
- (38) Motte, F., Andr, P. 2001, A&A, 365, 440
- (39) Mundy, L.G., Looney, L.W., Welch, W.J. 2000, in Protostars and Planets IV, eds. Mannings, V., Boss, A.P., Russell, p. 355
- (40) Natta, A., Grinin, V.P., Manning, V. 2000 in Protostars and Planets IV, eds. Mannings, V., Boss, A.P., Russell, p. 559
- padgett (1999) Padgett, D.L., Brandner, W., Stapelfeldt, K.R., Strom, S.E., Terebey, S., Koerner, D. 1999, ApJ, 117, 1490
- (42) Padgett, D., Stapelfeldt, K., Sargent, A. 2001 ”Millimeter Interferometry of HST Circumstellar Disks”, Tetons 4: Galactic Structure, Stars and the Interstellar Medium, ASP Conference Series, Vol. 231. Edited by Charles E. Woodward, Michael D. Bicay, and J. Michael Shull. San Francisco: Astronomical Society of the Pacific. ISBN: 1-58381-064-1, p.586
- (43) Scarrott, S., Draper, P.W., Warren Smith, R.F. 1989, MNRAS 237, 621
- shakura (1973) Shakura, N.I., & Sunyaev, R.A. 1973, ApJ, 24, 337
- (45) Shu, F.H., Adams, F.C., Lizano, S. 1987, ARA&A, 25, 23
- (46) Stapelfeldt, K.R., Krist, J.E., Menard, F., Bouvier, J., Padgett, D.L., Burrows, C.J. 1998, ApJ, 502, L65
- (47) Stecher, T.P., Donn, B. 1965, ApJ, 142, 1683
- (48) Thompson, R.I., Rieke, M., Schneider, G., Hines, D.C., Corbin, M.R. 1998, ApJ, 492, L95
- (49) Ulrich, R.K. 1976, ApJ, 210, 377
- (50) Voshchinnikov, N.V., Astroph. Sp. Phys. Rev. 2002, in press
- (51) Ward-Thompson, D., Scott, P.F., Hills, R.E., Andr, P. 1994, MNRAS, 268, 276
- (52) Weidenschilling, S.J. 1997a, Icarus, 127, 290
- (53) Weidenschilling, S.J. 1997b, in 28th Annual Lunar and Planetary Science Conference, p. 517
- (54) Wickramasinghe, N.C., Guillame, C. 1965, Nature, 207, 366
- (55) Wilner, D.J., Lay, O.P. 2000, in Protostars and Planets IV, eds. Mannings, V., Boss, A.P., Russell, p. 509
- wolf (2002) Wolf, S. 2002, Comp. Phys. Comm., 150, 99
- wolf (2003) Wolf, S. 2003, ApJ, in press
- wolf (2000) Wolf, S., Henning, Th. 2000, Comp. Phys. Comm., 132, 166
- wolf (1999) Wolf, S., Henning, Th., Stecklum B. 1999, A&A, 349, 839
- wolf (2001) Wolf, S., Voshchinnikov, N.V., Henning, Th. 2002, A&A, 385, 365
- (61) Wood, K., Kenyon, S.J., Whitney, B., Turnbull, M. 1998, ApJ, 497, 404
- (62) Wood, K., Wolff, M. J., Bjorkman, J.E., Whitney, B. 2002, ApJ, 564, 887
- (63) Wright, E.L. 1987, ApJ, 320, 818
- yobo (1999) Yorke, H.W., Bodenheimer, P. 1999, ApJ, 525, 342