Models for Type Ia Supernovae
and Cosmology
11institutetext: Dept. of Astronomy, University of Texas, Austin, TX 78681, USA
22institutetext: Lawrence Berkeley Laboratory, Berkeley, CA 94720, USA
Models for Type Ia Supernovae and Cosmology
Abstract
We give an overview of the current understanding of Type Ia supernovae relevant for their use as cosmological distance indicators. We present the physical basis to understand their homogeneity of the observed light curves and spectra and the observed correlations. This provides a robust method to determine the Hubble constant, , independently from primary distance indicators. We discuss the uncertainties and tests which include SNe Ia based distance determinations prior to -Ceph measurements for the host galaxies. Based on detailed models, we study the small variations from homogeneities and their observable consequences. In combination with future data, this underlines the suitability and promises the refinements needed to determine accurate relative distances within 2 to 3 % and to use SNe Ia for high precision cosmology.
1 Overview
Type Ia Supernovae (SNe Ia) are the result of a thermonuclear explosion of a white dwarf star. What we observe is not the explosion itself but light emitted from the material of the disrupted white dwarf (WD) for weeks to months afterward. After the first few seconds, this rapidly moving gas expands freely. As a consequence, the matter density decreases with time and the expanding material becomes increasingly transparent, allowing us to see progressively deeper layers. Thus, a detailed analysis of the observed light curves (the time series of emitted flux) and spectra reveals the density and chemical structure of the entire star.
The structure of a WD is determined by degenerate electrons and thus largely independent of details such as the temperature or chemical composition. The explosion energy is determined by the binding energy released during the nuclear burning, and the burning products can be observed. The tight relation between the explosion and the observables and their insensitivity to details are the building blocks on which our understanding of the homogeneity in the observable relations for SNe Ia is based. Indeed, both the peak fluxes and light curve shapes of SNe Ia show an impressive level of homogeneity, making them the astronomical objects closest to a standard candle distance estimator. This allows their use for precision estimation of cosmological parameters.
The thumbnail sketch of our understanding is as follows:
-
•
Type Ia supernovae are nearly homogeneous because nuclear physics determines the structure of white dwarfs, and the explosion.
-
•
The total production of nuclear energy is almost constant since very little of the WD remains unburned. The final explosion energy depends on the binding energy of the WD, which is given by its structure.
-
•
The light curves are powered by the radioactive decay of produced during the explosion, independently from details of the explosion physics and progenitors. The amount of determines the absolute brightness.
-
•
The energy released from the nickel decay ties together the luminosity and the temperature dependent opacity, i.e. how much flux is emitted and how quickly. Explicitly, less Ni means a lower luminosity, but at the same time lower temperature in the gas and so lower opacity. Thus, energy escape is more rapid. So dimmer SN are quicker, i.e. have narrower light curves. This is variously called the brightness decline, peak magnitude - light curve width, or stretch relation.
-
•
To be in agreement with the narrowness of the brightness decline relation phillips87 , the mass of the progenitors and the explosion energies must be similar. This is automatically satisfied in the currently most successful model: a Chandrasekhar mass C/O-WD in which the burning starts off as a deflagration front (propagating at well below the speed of sound) and subsequently turns into a detonation (with the speed of sound).
-
•
To agree with observations of intermediate mass elements at the outer layers, the WD must be pre-expanded. Most likely, an initial deflagration phase causes the pre-expansion. This depends mainly on the amount of energy release but not on the details of the deflagration front. Within this paradigm, 1) the entire WD is burned, and 2) the production of is dominated by a single parameter characterizing the transition between deflagration and detonation, determining the amount of burning during the deflagration.
The deflagration-detonation model thus gives a natural and well motivated origin for a narrow brightness decline relation. In addition, the resulting chemical layering is shell like as observed.
-
•
Homogeneity can be established down to a level of 0.2 magnitudes. Beyond this, secondary parameters are expected to become important, namely the progenitor mass on the main sequence, its metallicity, and stellar rotation. In particular, the pre-conditioning of the WD prior to the thermonuclear runaway may hold the key to understanding the variety of SNe Ia.
With more detailed observations, these characteristics will help to improve the current accuracy of SNe Ia as distance indicators.
In the following sections, we address the current status of our understanding of SNe in more detail and elaborate on how future observations by ground based telescopes and dedicated space missions, in combination with detailed modeling, will help to bring us to a new level of understanding. These include new insights into the nature of SNe including the progenitors, the thermonuclear runaway that leads to the explosion, the propagation of nuclear burning fronts and their 3-dimensional nature. These studies will help to discover and understand new relations between observables to get a handle on the relation of SNe Ia with their environment, including evolutionary effects with redshift, and to improve the accuracy of SNe Ia as cosmological distance indicators.
2 A Simplified Explosion Model
The following scenario summarizes one possibility for the creation and characteristics of a SNe Ia. This is designed solely to give the reader a simple example to relate a variety of concepts.
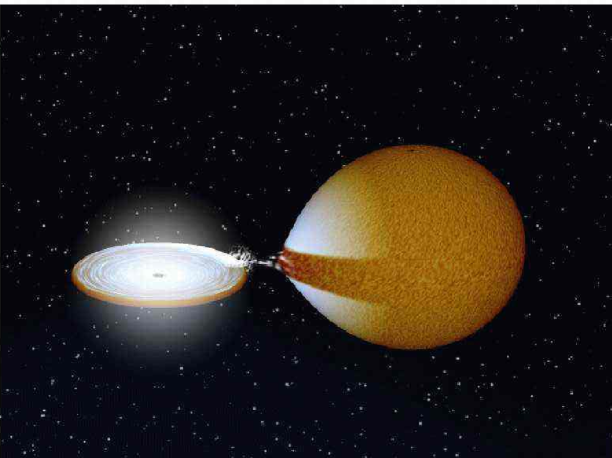
Consider a white dwarf (WD) in a binary system, accreting mass from its companion (1). This initial phase ends when the total mass approaches the Chandrasekhar mass (beyond which the star would collapse to a neutron star or black hole) and causes compressional heating of the core and the thermonuclear runaway. Likely, the burning front starts as a deflagration (velocity well below the sound speed). The energy release lifts the WD in its potential and causes pre-expansion of the star needed to reduce the density under which burning occurs. After a few seconds, the burning fronts makes a transition to a detonation (or very fast deflagration). All material in the high density regions is burned to while outer shells of Si, S, etc. and a small fraction of the original C and O remain. The specific energy released by these reactions unbinds the material and causes a rapid acceleration of the matter. As the radioactive decays, the resulting gamma ray energy is thermalized and produces the optical luminosity, or light curve (LC), over tens of days to months. The rise time and decay time are given by the decay rate and the opacity and expansion. Spectral time series map out the SN structure as the photosphere recedes through the material.
The simplified physics picture is as follows: The rate of the free expansion is determined by the specific nuclear energy production which, for a C/O-WD, is rather insensitive to the burning process and the final burning products. The complete burning of the white dwarf in the explosion fixes the total nuclear energy release and hence kinetics; the transition density determines the nickel mass produced; the nickel decay fixes the energy input to the supernova material, determining its luminosity and opacity. The opacity and explosion energy together give the shape of the light curve, namely the brightness decline relation.
Alternate model pathways, in fact, converge to the same major points after each stage, driven by the physics and constrained by the observations. Several examples of such “stellar amnesia” indemnify the observables against details of how the final state is reached. For example what is predominantly important for the energy production is that the overwhelming majority of the star burns, not how it does because the release of energy by the fusion of C/O up to Si/S dominates over the relatively little binding energy in the last stage to iron.
On the other hand, the tight relation between the observables evinced by the homogeneity of the brightness-width relation only occurs in certain classes of models. This constrains the possibilities, as do such data as infrared spectra showing little unburned original C-O material. Together, amnesia from the physics and empirical data from observations weave a tight net around the possible ingredients that can be important in determining the absolute brightness.
3 Physics of the Explosion, Light Curves, and Spectra
As stated in the overview, nuclear physics determines the structure of the progenitor and is responsible for the homogeneity of SNe Ia. As the SN Ia expands, we see deeper layers with time due to the geometrical dilution. The unveiling of the layers reveals the structure of the WD. The observable data provide a rich resource for testing and refining models. E.g., the light curves provide critical information about integrated quantities such as the total energy generation and mass and energetics of the expanding material. The spectra are mostly sensitive to the composition and velocity at the photosphere (the deepest unveiled layer).
The spectra of SNe Ia are dominated by elements (C,O,Si,S,Ca,Fe/Co/Ni) that are the characteristic products of explosive nuclear burning at densities between . These densities are typical only for a C/O-WD, i.e. a star stabilized by a degenerate electron gas. For such a degenerate equation of state, the initial structure of the exploding WD depends only weakly on the temperature and the C/O ratio as a function of depth. WD radii are between 1500 to 2000 km/sec, mainly depending on density at the time of the accretion which is mainly given by the accretion rate (see hwt98 and above). Typical binding energies are to . If the entire WD is burned, about are released over time scales of seconds. The energy released is given by the difference between the binding energy per nuclear of unburned compared to burned matter. Because the nuclear binding energy of both the of the fuel, i.e. carbon and oxygen, and the final burning product, i.e. Si and Ni, are rather similar, variations in the specific energy release per mass of burned matter is limited to . Neutrino losses are less than 1 to 2 % and, thus, little energy is lost in contrast to core collapse SNe where more of the release energy is lost by neutrinos. In the explosion, a WD with a radius of about 1500 km expands with observed velocities of the order of 10,000 km/sec, consistent with the specific nuclear energy release in such an environment. Because this rapid increase in volume and the adiabatic cooling, the nuclear energy is used to overcome the binding energy and to accelerate the WD matter. Based on this evidence, there is general agreement that SNe Ia result from some process of combustion of a degenerate WD. The amount and products of the nuclear reactions – “burning” – depend mainly on the time scale of reactions compared to the hydrodynamical time scale of expansion, which is . The reaction rate depends sensitively on the temperature and the energy release per volume element. The specific energy release is a function of the density and, to a smaller extent, the initial chemical composition, namely the C/O ratio of the progenitor (which depends on the initial stellar mass). At densities , , and , the main burning products are Fe/Co/Ni, S/Si and Mg/O, respectively. We will see, however, that the details of the burning process have little impact. These quantities we discussed – the explosion energy, mass, and the burning product – are directly linked in SNe Ia, and accessible to observations.
As just mentioned, virtually none of the initial stored energy from the WD will contribute to the luminosity of the supernova but it goes to expansion. Instead, the energy input is entirely caused by the radioactive decay of freshly synthesized that decays via with life times of 8.8 and days, respectively. This slow nuclear energy release is due to a gain of nuclear binding energy between isotopes rather than change of elements. The total energy released by radioactive decays is about 3 % of the initial energy release, namely, for a production of 0.5 vs. released during the early explosive burning and any changes in the expansion velocities are less than . The energy release in the form of luminosity is dominated by the location of the photosphere within the expanding material, a function of the expansion and the opacity. As we will see below, small differences in the expansion rate caused by the central density of the WD, chemistry and expansion rate will produce small deviations from the homogeneity in the light curves on a 10 to 20 % level.
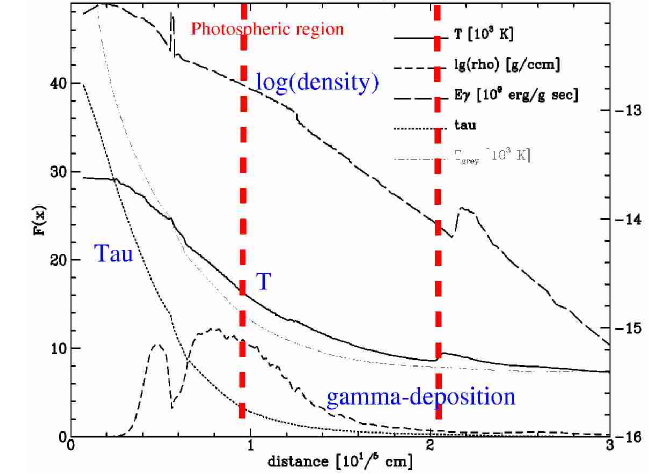
In the case of a Type Ia SN, acceleration of the material takes place during the first few seconds to minutes, followed by the phase of free expansion. In lack of further acceleration, the radius of a gas element from the center is simply proportional to the velocity . This means that gas further out moves faster and hence stays further out; each shell expands without crossing another, maintaining the original structure. As in cosmology it is useful to think in comoving coordinates, moving with the expansion. In these coordinates each shell, and hence slice of the original stellar structure, is preserved. So while material expands out through a fixed radial distance from the center, the mass within a comoving radius is constant with time. Therefore we often discuss the structure in terms of mass or velocity coordinates. Due to the expansion, the material cools almost adiabatically as the volume increases rapidly: . The increase in volume causes a corresponding decrease in density and hence optical depth. So the photosphere slips deeper within the material, simultaneously allowing us to see further in. Note though that it still expands in physical radius, at least up to the time of peak magnitude.
The well determined energy source for the luminosity and the tight relation between the explosion and the observables, with their simultaneous insensitivity to details, are the building blocks on which our understanding of the homogeneity in the observable relations for SNe Ia is based.
To go beyond the homogeneity and take full advantage of the intrinsic properties of SNe Ia and to test for the influence of the metallicities, progenitors etc., we can perform detailed calculations which are consistent with respect to the progenitors, explosion, light curves and spectra. These calculations include detailed nuclear networks, gamma-ray transport, non-LTE level populations, and multidimensionality for parts of the problem. The numerical methods are briefly described in the Appendix. For more details, see hoeflich93 ; hoeflich95 ; hgfs02 ; h02 , and references therein. The only remaining free parameters to address are the initial structure of the WD and the description of the nuclear burning front, which we discuss in the next section.
4 Detailed Models, Observations and Cosmology
In examining possible scenarios, from the progenitor state to the explosion, we will see that the most important properties are those that change the overall energetics, such as the total energy content of the fuel and the amount of matter of the WD that undergoes burning. As we have alluded to in the previous discussions of ”stellar amnesia”, many of the results are quite stable, i.e. model independent. In fact, we find 1) insensitivity of the WD structure to the progenitor star and system. This is caused by the electron degeneracy enforcing the mentioned weak dependence on the temperature and composition. 2) The time of the explosion (and therefore the WD density) is governed by the accretion rate shortly before the thermonuclear runaway causing the explosion. 3) Moreover, the final outcome of the explosion is rather insensitive to details of the nuclear burning. While this is beneficial for the tightness of the observed luminosity relation, it makes it difficult to investigate the pre-supernova physics, e.g. the explosion scenario.

However, new, high quality data and advances in supernovae simulations have opened up new opportunities to constrain the physics of supernovae and to improve the accuracy of their use as standardized candles below the level. For the first time, a direct relation with the progenitors seems to be within reach. In particular, there is mounting evidence that the properties of the progenitor are directly responsible for the variety in SNe Ia. These properties include the chemical structure, rotation, and central density (hwt98 , wang98 , hgfs02 ).
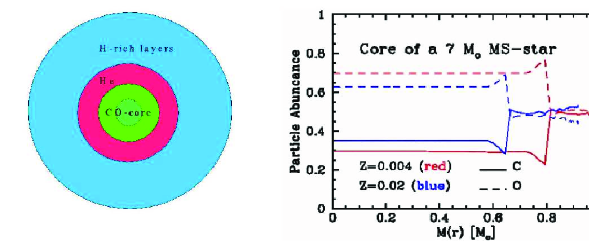
There is general agreement that SNe Ia result from some process of combustion of a degenerate WD hoyle60 . WDs are the final stages of stellar evolution for all stars with less than 7-8 (see Fig. 2). During the stellar evolution on the main sequence, stars gain their energy from central burning of hydrogen to helium until H is exhausted in the central region. Subsequently, the star burns He to C and O in the center, surrounded by a hydrogen burning shell. When He becomes more depleted, the triple- process becomes less efficient and takes over, resulting in an inner region of low C abundance (see Fig. 2, right panel). The size of the He burning core depends on the mass of the star and on the metallicity/opacity because it is convective, i.e. material from different radii mixes (e.g. dominguez01 ). At these final stages, the star loses most of its mass but with the C/O core remaining: a WD is born. If the star is a member of a close binary system it may gain mass at a sufficient rate to become a SNe Ia nomoto82 . Because about 0.2 to 0.7 are accreted from an accretion disk, the resulting WD may be strongly differential rotating langer02 .
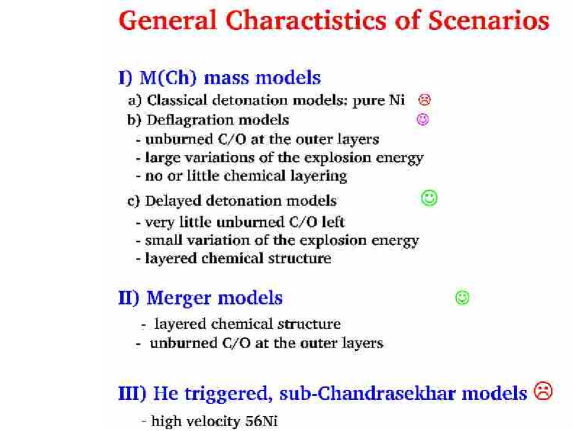
The exact method of gaining mass sufficient to cause a supernova defines three classes of models: (1) An explosion of a CO-WD, with mass close to the Chandrasekhar mass , having accreted mass through gravitational stripping of the outer layers (called Roche-lobe overflow) from an evolved companion star whelan73 . The explosion is mainly triggered by compressional heating near the WD center. (2) An explosion of a rotating configuration formed from the merging of two low-mass WDs, caused by the loss of angular momentum due to gravitational radiation from the binary system webbink84 ; iben84 ; paczynski85 . (3) An explosion of a low mass CO-WD triggered by the detonation of a helium layer accreted from a close companion nomoto80 ; woosley80 ; woosley86 . This third class, the so-called edge-lit sub-Chandrasekhar WD model, has been ruled out on the basis of predicted light curves and spectra hoeflich96b ; nugent97 . The first model, accretion to , is the most successful when compared to observations.
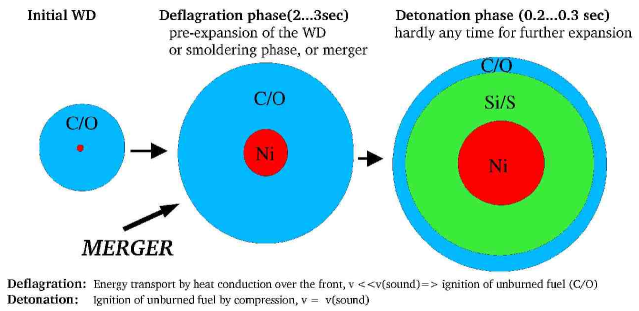
Within the scenario (see Fig. 1), the free model parameters are: 1) The chemical structure of the exploding WD – given by the evolution of the progenitor star and the central He-burning; 2) Its central density at the time of the explosion – dependent mainly on the accretion rate onto the WD; 3) The description of the initial, subsonic burning front (deflagration); and 4) The amount of burning prior to the transition from deflagration to detonation (see Fig. 3). From these, the light curves and evolution of spectra follow directly. Comparison with observations allow to constrain the parameters for a particular SNe Ia, its distance and the interstellar reddening (see below and Fig. 8).
The first two parameters set the stage. For the merging scenario, the front will start as a detonation making parameters 3 and 4 dependent but adding the mass of the orbiting envelope as a free parameter. The scenario requires parameters 3 and 4 because if the WD exploded purely from a thermonuclear runaway reaction then almost all of the material would burn to , in contradiction to observations that show only about 0.6 is produced. Instead, a pre-expansion is needed to lower the density (see Fig. 3). This likely occurs during an initial phase of a slow deflagration that preserves the structure but decreases the binding energy. The lift in potential energy depends mainly on the amount of burning, i.e. total energy produced, and almost not at all on the actual rate dominguez00 . Thus, fortunately, details of nuclear burning in the non-linear regime of deflagration, about which our understanding is currently limited, will hardly affect the final LCs and spectra.
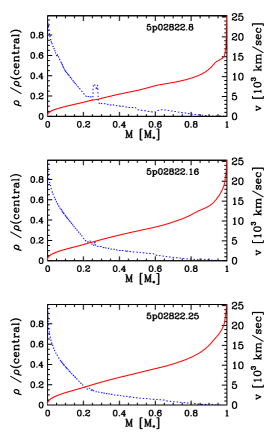
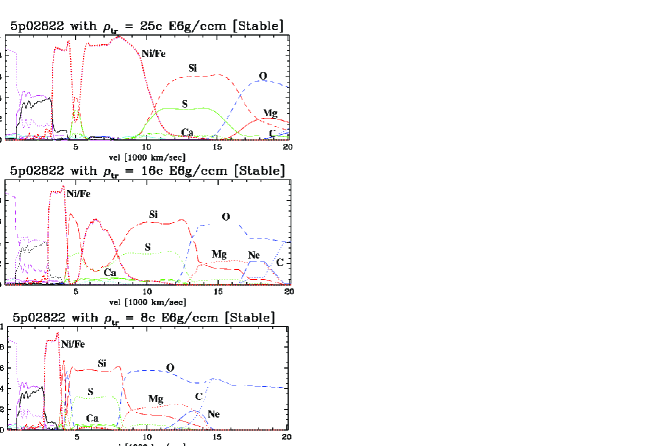
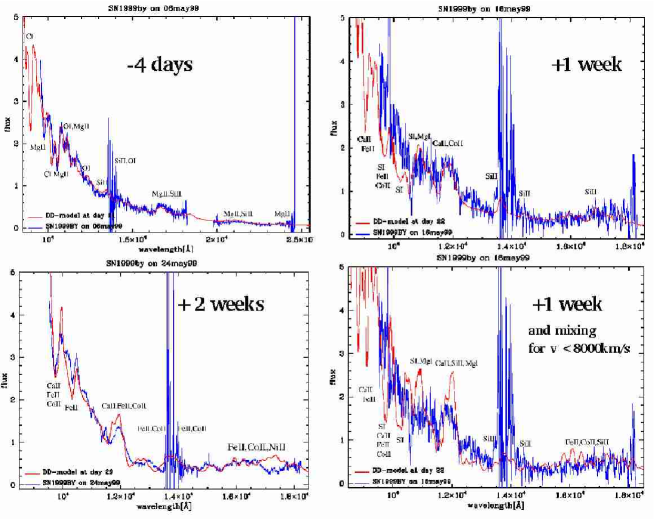
Successful models need either a rapidly increasing deflagration speed and no radial mixing (e.g. W7 nomoto84 – see footnote 111The pure deflagration model W7 is a spherical model and, consequently, shows a layered structure which is typical for detonations. Realistic 3-D deflagration models do not show a radial layering of the abundances.), or a deflagration-detonation transition (DDT) (see Fig. 3). The detonation or a very rapid deflagration is required to match observations that almost the entire WD is burned (see Fig. 6). Current infrared observations place tight upper limits on the amount of unburned material. Depending on the specific SN Ia and the quality of the data, the constraints imposed lie between to wheeler98 ; hgfs02 ; marion02 ; rudy02 . For general comparison of models, see Fig. 5. Delayed detonation (DD) models khokhlov91 ; woosley94 ; yamaoka92 , those possessing a DDT, have been found to reproduce the optical and infrared light curves and spectra of “typical” SNe Ia reasonably well hoeflich95 ; hkw95 ; hk96 ; fisher98 ; nugent97 ; wheeler98 ; lentz01 . Here the burning starts as a well subsonic deflagration and then turns to a nearly sonic, detonative mode of burning. Due to the one-dimensional nature of the model, the speed of the subsonic deflagration and the moment of the transition to a detonation are free parameters hence numbers 3 and 4 mentioned above. The moment of deflagration-to-detonation transition is conveniently parameterized by introducing the transition density, , at which it occurs. The amount of 56Ni, , depends primarily on hoeflich95 ; hkw95 ; umeda99 , and to a much lesser extent on the assumed value of the deflagration speed, initial central density of the WD, and initial chemical composition (ratio of C to O). In essence this fixes the power source for the supernova light: models with a smaller transition density give less nickel and hence both lower peak luminosity and lower temperatures hoeflich95 ; hkw95 ; umeda99 (Figs. 6, 7). This is the first element in explaining the homogeneity of SNe Ia.
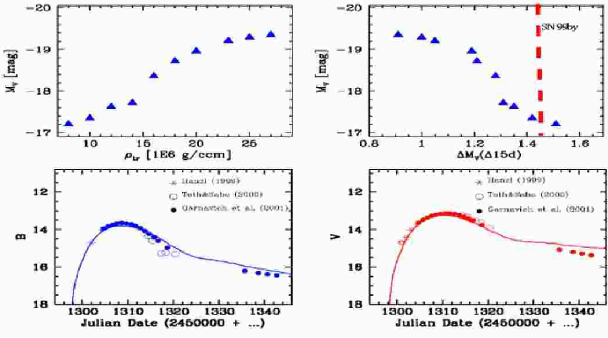
The second element is that, in DDs, almost the entire WD is burned, i.e. the total production of nuclear energy is almost constant, and the density and velocity structures hardly vary with the production (Fig. 6). Together these form the basis of why, to first approximation, the SNe Ia relation between peak magnitude and light curve width forms a one-parameter family. This can be well understood as an opacity effect hoeflich96a , i.e. as a consequence of the rapidly dropping opacity at low temperatures hoeflich93 ; khokhlov93 . Less Ni means lower temperature so the emitted flux is shifted from the UV towards longer wavelengths where there is less line blocking; as a consequence, the mean opacities are reduced. Less opacity means the photosphere retreats more rapidly to deeper layers, causing a faster release of the stored energy and, as a consequence, steeper declining LCs together with the decreasing brightness. DD models thus give a natural and physically well-motivated origin for the magnitude-light curve width relation of SNe Ia within the paradigm of thermonuclear combustion of Chandrasekhar-mass C/O-WDs. These models are able to reproduce light curves and spectra, and to determine the Hubble constant independently from primary distance indicators (see Fig. 8). Furthermore, they can explain both normal bright and very subluminous SNe Ia within the same model (Figs. 7 and 9).
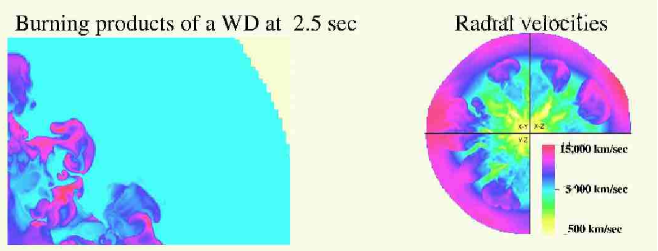
One of the uncertainties within SN modeling is the description of the nuclear burning fronts. While the propagation of a detonation front is well understood the description of the deflagration front and the deflagration to detonation transition pose problems. On a microscopic scale, a deflagration propagates due to heat conduction by electrons. Though the laminar flame speed in SNe Ia is well known, the front has been found to be Rayleigh-Taylor (R-T) unstable (see Fig. 4) increasing the effective speed of the burning front nomoto76 . More recently, significant progress has been made toward a better understanding of the physics of flames. Starting from static WDs, hydrodynamic calculations of the deflagration fronts have been performed in 2-D rein99 ; lisewski00 and 3-D livne93 ; khokhlov95 ; khokhlov01 . It has been demonstrated that R-T instabilities govern the morphology of the burning front in the regime of linear instabilities, i.e. as long as perturbations remain small. During the first second after the thermonuclear runaway, the increase of the flame surface due to R-T instability remains small and the effective burning speed is close to the laminar speed () if the ignition occurs close to the center. Khokhlov khokhlov01 also shows that the effective burning speed is very sensitive to the energy release by the fuel, i.e. the local C/O ratio. Therefore, the actual flame propagation may depend on the detailed chemical structure of the progenitor. Moreover, all current experiments are based on static WDs and assumed off-center points of ignition. Recent simulations of the final phases before the explosion put the validity of these assumptions into question hs02 . Despite advances, the mechanism is not well understood which leads to a DDT or, alternatively, to a fast deflagration in the non-linear regime of instabilities. Possible candidates for the mechanism are, among others, the Zel’dovich mechanism, i.e. mixing of burned and unburned material khokhlov97 , crossing shock waves produced in the highly turbulent medium, or shear flows of rising bubbles at low densities livne98 ; livne98b . An additional way is related shear instabilities present in rapidly, differentially rotating WDs. Then, as soon as rising plumes enter this region of instability, they will be disrupted and strong mixed will occur. As a consequence, the burning rate will strongly increase which may cause a DDT. As discussed above, we must expect differential rotation in progenitors because a significant fraction of the progenitor mass has been accreted from a Kepler-disk. Currently, none of the proposed mechanisms have been worked out in detail and shown to work in the environment of SNe Ia. However, as a common factor, all these mechanisms will depend on the physical conditions prior to the DDT. In the current state of the art we cannot predict a priori the distribution of brightness in a SNe sample because, within the most favored model, determines the brightness. Rather we take this as an input parameter and can investigate the small deviations from the brightness decline relation.
Although pure deflagration models are possible, current 3-D models show properties inconsistent with the observations (Fig. 5). Namely, pure deflagration models predict a significant fraction of the C/O WD remains unburned and a mixture of burned and unburned material at all radii/velocities (e.g. barbon90 ; fisher95 and see Fig. 9). Constraints from infrared observations provide good evidence that the WD is almost fully incinerated in normal bright SNe Ia wheeler98 ; rudy02 ; marion02 . And in contrast to pure deflagration models, in DD-models the detonation front erases the chemical structure left behind by the deflagration (Fig. 4). Note that the “classical” deflagration model W7 nomoto84 shows a layered structure similar to DD-models because it has been calculated in spherical geometry rather than the unlayered structure to be expected from 3-D deflagration models.
In conclusion, the transition to a detonation or (less likely) to a very fast deflagration determines the production and causes the one-parameter relation between peak magnitude and LC width. To a much lesser extent variations of the other parameters lead to some deviation from perfect homogeneity on the level. For example, an increase in the central density increases the electron capture close to the center, shifting the nuclear statistical equilibrium away from hoeflich96a . Empirically, the magnitude-light curve width relation has been well established with a rather small statistical error ( hamuy96 , riess96 , schmidt98 , phillips99 , perl99a ). These correspond to 5-8% in distance. Note the predicted dispersion for DD models is somewhat larger than observed but significantly smaller than generic models which show a dispersion of hoeflich96a .
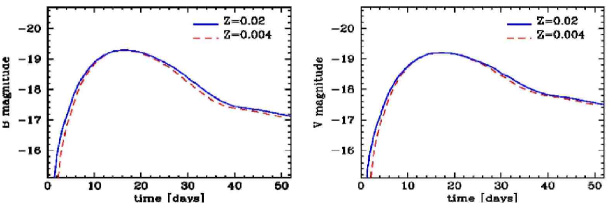
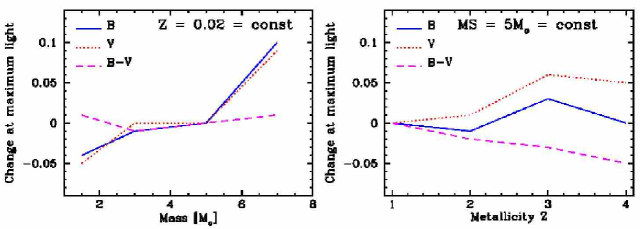
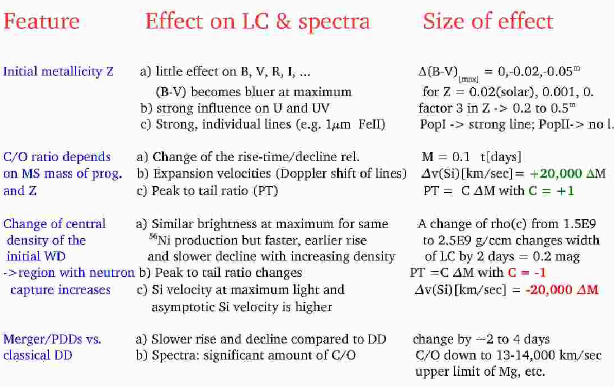
This may imply a correlation between free model parameters, namely the properties of the burning front, and the main sequence mass of the progenitor , metallicity Z, and the central density of the WD at the time of the explosion. As we have discussed above, there is growing evidence that the final outcome of the explosion is determined by the pre-conditioning of the WD, namely the properties of the WD, its rotation and the final evolution which leads to the thermonuclear runaway hwt98 ; hoeflich00 ; dominguez01 ; hs02 . Thus, we must expect that correlations between observables exist and can be used to further tighten the dispersion caused by second order parameters (Figs. 10 & 11; see the summary table in Fig. 12). From this very argument, we must also expect a shift with redshift in the mean properties of the order of due to the population drift in the progenitor characteristics and environments. Nevertheless, the spread around the brightness decline relation may show little change. As one possible example, the mean metallicity and typical progenitor mass at the main sequence will decrease with redshift and cause systematic changes in the brightness decline relation (Figs. 10 & 11). These effects can be recognized and compensated for if well observed light curves and spectra are obtained. Fig. 12 summarizes many of the relevant features, their expected size, and their effect on the observables based on advanced models. Note that detailed analyzes of observed spectra and light curves indicate that mergers and deflagration models such as W7 may contribute to the SN population hk96 ; hatano00 . To determine the nature of the dark energy through the use of SNe Ia as precision distance indicators, we need to reduce the residual systematic uncertainties well below the statistical dispersions perl99a ; perl99b ; albrect00 . This is the reason why we need comprehensive observational programs producing well characterized samples, from ground based supernovae surveys such as the Nearby SN Factory snf , the ESSENCE project essence , and the CFH Legacy Survey cfh for low redshifts, and the w-project and space-based missions such as the Supernova/Acceleration Probe snap for high redshifts.
5 Conclusions
Supernovae studies have greatly progressed over the last several years due to advances in both observations and modeling. We are now able to analyze the explosion and resulting SNe properties in some detail, and can obtain answers to a number of long standing, interesting questions. While we cannot predict a priori the peak magnitude, we have seen that we can understand the origin of both the near homogeneity and those tight observable relations describing the first order deviations. Stability of the SNe Ia observables – stellar amnesia – arise because the nuclear physics determines the structure of the white dwarfs, and the explosion. Although pathways to SNe Ia span a variety, the information about the specific history is largely lost along the way to the progenitor and during the explosion. Thus, convergence due to physics leads to a generic accuracy of SNe Ia as distance indicators on the level. However, these details are needed for the next level of precision. In particular, pre-conditioning of the explosion seems to be a key element. These secondary parameters can be revealed through detailed models in combination with comprehensive observations which include both spectra extending to the near infrared and light curves from early times to well after maximum light (see table in Fig. 12). This approach is supported by current observations (e.g. phillips99 ). Future surveys will provide the rich resource of data to constrain and refine our understanding of SN progenitors and explosion physics. Using all the empirical data the supernovae provide, together with the tight relation between the observables and models enables us to significantly deduce their absolute magnitude with confidence. Thus, SNe Ia are simple, and will be well understood, standardizable candles for cosmological distance tests.
Acknowledgements: It is pleasure to thank A. Khokhlov for the permission to show in Fig. 4 some of the results of his 3-D calculations, and for many helpful discussions. This research is supported by the NASA grant NAG5-7937.
References
- (1) Albrecht A., Weller J. 2000, BAAS, 197, 6106
- (2) Arbour R., Papenkova M., Li, W. D., Filippenko A. V., Armstrong M. 1999, IAU Circular 7156
- (3) Barbon R., Benetti S., Cappellaro E., Rosino L., Turatto M. 1990, A&A 237, 79
- (4) Bonanos A., Garnavich P., Schlegel E., Jha S., Challis P., Kirshner R., Hatano K., Branch D. 1999, BAAS 195, 3806
- (5) Bowers E. J. C., Meikle W. P. S., Geballe T. R., Walton, N. A., Pinto, P. A., Dhillon, V. S., Howell, S. B., Harrop-Allin, M. K. 1997, MNRAS, 290, 663
-
(6)
Canada-France-Hawaii Telescope Legacy Survey,
http://www.cfht.hawaii.edu/Science/CFHLS - (7) Collela P., Woodward P.R. 1984, J. Comp. Phys., 54, 174
- (8) Domínguez I., Höflich P. 2000, ApJ, 528, 854
- (9) Domínguez I., Höflich P., Straniero O. 2001, ApJ, 557, 279
-
(10)
ESSENCE Project,
http://www.ctio.noao.edu/wproject - (11) Fisher A., Branch D., Höflich P., Khokhlov A. 1995, ApJ, 447, 73
- (12) Fisher A., Branch D., Höflich P., Khokhlov A. 1998, ApJ, 494, 47
- (13) Fisher A., Branch D., Hatano K., Baron E. 1999, MNRAS, 304, 679
- (14) Hamuy M. et al. 1996, AJ, 112, 2391
- (15) Hatano K., Branch D., Lentz E. J., Baron E., Filippenko A. V., Garnavich P. 2000, ApJ 543L, 49
- (16) Höflich P. 1988, PASAu 7, 434 A&A, 248, L7
- (17) Höflich P., Khokhlov A., Müller E. 1991, A&A, 248, L7
- (18) Höflich P., Khokhlov A., Müller E. 1992, A&A, 257, 641
- (19) Höflich P., Khokhlov A., Müller E. 1993, A&A, 270, 223
- (20) Höflich P. 1995, ApJ, 443, 89
- (21) Höflich P., Khokhlov A., Wheeler J.C. 1995, ApJ, 444, 211
- (22) Höflich P., Khokhlov A. 1996, ApJ, 457, 500
- (23) Höflich P., Khokhlov A., Wheeler J. C., Phillips M. M., Suntzeff N. B., Hamuy M. 1996a, ApJ, 472, L81
- (24) Höflich P., Dominik C., Khokhlov A., Müller E., Wheeler J. C. 1996b, in Texas Symposium on Relativistic Astrophysics, Annals of the New York Academy of Science, 759, 348
- (25) Höflich P., Wheeler J. C., Thielemann F. K. 1998, ApJ, 495, 617
- (26) Höflich P., Nomoto K., Umeda H., Wheeler J. C. 2000, ApJ, 528, 590
- (27) Höflich P., Gerardy C., Fesen R., Sakai S. 2002, ApJ 568, 791
- (28) Höflich P., Stein J. 2002, ApJ 568, 771 & astro- ph/0104226
- (29) Höflich P., in: Stellar Atmospheres, eds. Hubeney et al., in press & astro-ph/0207103
- (30) Howell A., Höflich P., Wang L., Wheeler J. C. 2001, ApJ, 556, 302
- (31) Hoyle P., Fowler W.A. 1960, ApJ, 132, 565
- (32) Iben Jr I., Tutukov A.V. 1984, ApJs, 54, 335
- (33) Itoh N., Mitake S., Iyetomi H., Ichimaru S. 1983, ApJ 273, 774
- (34) Khokhlov A. 1991, ApJ, 245, 114
- (35) Khokhlov A., Müller E., Höflich P. 1993, A&A, 270, 223
- (36) Khokhlov A. 1995, ApJ, 449, 695
- (37) Khokhlov A., Oran E.S., Wheeler J.C. 1997, ApJ, 478, 678
- (38) Khokhlov A. 2001, ApJ, submitted & astro-ph/0008463
- (39) Kirshner R. P., Jeffery D., Leibundgut B., Challis P., Sonneborn G., Phillips M.M., Suntzeff N., Smith R., Winkler P., Frank W., Winge C. 1993, ApJ 415, 589
- (40) Kurucz R. L. 1993, Atomic Data for Opacity Calculations, Cambridge/Center for Astrophysics, CD
- (41) Kurucz R. L. 1994, Solar Abundance Model Atmospheres for 0,1,2,4,8 km/s, Kurucz CD-Rom No. 19
- (42) Langer N., et al. 2002, A&A, in press
- (43) Leibundgut B. et al. 1993, AJ, 105, 301
- (44) Lentz E. J., Baron E., Branch D., Hauschildt P., Nugent,P. 2000, ApJ, 530, L9
- (45) Lentz E. J., Baron E., Branch D., Hausschildt P. 2001, ApJ, 557, 2001
- (46) Lisewski A. M., Hillebrandt W., Woosley S. E., Niemeyer J. C., Kerstein A. R. 2000, ApJ 537, 405L
- (47) Livne E. 1993, ApJ 406, 17L
- (48) Livne E. 1998, ApJ, 527, 97
- (49) Livne E. 1998, talk in workshop on SNe Ia, private communication with P. Höflich, Aspen 1998.
- (50) Marion H., Höflich P., Vacca D., Wheeler J.C. 2002, ApJ, submitted
- (51) Meikle W. P. S. et al. 1996, MNRAS, 281, 263
- (52) Mendoza C., Cunto W. 1993, AA, 275, L5
- (53) Mihalas D. 1978, Stellar Atmospheres, San Francisco, Freeman 124,503
- (54) Müller E., Höflich P. 1994, A&A 281, 51
-
(55)
Nearby Supernovae Factory,
http://snfactory.lbl.gov - (56) Nomoto K., Sugimoto S., Neo S. 1976, ApSS, 39, L37
- (57) Nomoto K. 1980, ApJ, 248, 798
- (58) Nomoto K. 1982, ApJ 253, 798
- (59) Nomoto K., Thielemann F. -K., Yokoi K. 1984, ApJ, 286, 644
- (60) Nugent P., Baron E., Hauschildt P., Branch. D. 1997, ApJ, 485, 812
- (61) Ostriker P., Steinhardt P.J. 2001, Scientific American, Jan. 2001, p. 47
- (62) Paczyński B., 1985, in: Cataclysmic Variables and Low-Mass X-Ray Binaries, eds. D.Q. Lamb, J. Patterson, Reidel, Dordrecht, p.1 IAU-C 7156
- (63) Perlmutter S., et al. 1999a, ApJ 517, 565
- (64) Perlmutter S., Turner M.S., White M. 1999, Physical Review Letters 83, 670
- (65) Perlmutter C. et al. 1997, ApJ 483, 565
- (66) Phillips M. M. et al. 1987, PASP 90, 592
- (67) Phillips M.M., Lira P., Sunzeff N.B., Schommer R.A., Hamuy M., Maza J. 1999, AJ 118, 1766
- (68) Reinecke M., Hillebrandt W., Niemeyer J., Klein R., Gröbl A. 1999, AA 347, 724
- (69) Riess A.G., Press W.H., Kirshner R.P. 1996, ApJ 473, 88
- (70) Riess A.G., et al. 1998, AJ 116, 1009
- (71) Riess A.G., et al. 1999, AJ 118, 2675
- (72) Rudy R.J., Lynch D.K., David K., Mazuk S.M., Venturini C.C., Puetter R.C., Höflich P. ApJ 565, 413
- (73) Saha A., Sandage A., Labhard L., Tammann G.A., Macchetto F.D., Panagia N. 1997, ApJ Suppl. 486, 1
- (74) Saha A., Sandage A., Thim F., Labhard L., Tammann G.A., Christensen J., Panagia N., Macchetto F.D. 2001, ApJ 551, 973
- (75) Schmidt, B. P., et al. 1998, ApJ 507, 46
-
(76)
SNAP Project,
http://snap.lbl.gov - (77) Straniero O. Chieffi A. and Limongi M. 1997, ApJ 90, 425
- (78) Thielemann F. K., Nomoto K., Hashimoto M. 1996, ApJ, 460, 408
- (79) Umeda H., Nomoto K., Kobayashi C., Hachisu I., Kato M. 1999, ApJ, 522, L43
- (80) Wang L., Wheeler J. C., Höflich P. 1997, ApJ, 476, L27
- (81) Wang L., Höflich P., Wheeler C.J. 1998, ApJ Let. 487, 29
- (82) Wang L., Howell A., Höflich P., Wheeler J.C. 2001, ApJ 550, 1030
- (83) Webbink R. F. 1984, ApJ, 277, 355
- (84) Wheeler J. C., Höflich P., Harkness R. P., Spyromilio J. 1998, ApJ, 496, 908
- (85) Whelan J., Iben Jr. I. 1973, ApJ, 186, 1007
- (86) Woosley S. E., Weaver T. A., Taam, R. E. 1980, in: Type I Supernovae, ed. J. C. Wheeler, Austin, U. Texas, p.96
- (87) Woosley S. E., Weaver T. A. 1986, ARAA, 24, 205
- (88) Woosley S. E., Weaver T. A. 1994, ApJ, 423, 371
- (89) Yamaoka H., Nomoto K., Shigeyama T., Thielemann F.K. 1992, ApJ, 393, 55
Appendix A: Numerical Radiation Hydrodynamics
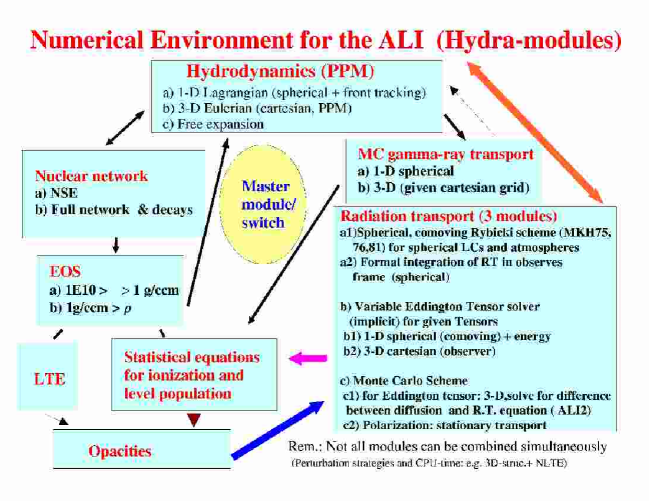
The computational tools summarized below were used to carry out many of the analyzes of SNIa and Core Collapse Supernovae (H88 , Höflich, Müller & Khokhlov 1993, hoeflich95 , howell01 , …). A consistent treatment of the explosion, light curves and spectra are needed (see Fig. 13). Details of the numerical methods and codes, namely HYDRA, can be found in h02 and references therein. Here we give a brief outline of the basic concepts.
A.1 Hydrodynamics
The explosions are calculated using a spherical radiation-hydro code, including nuclear networks (hwt98 and references therein). This code solves the hydrodynamical equations explicitly by the piecewise parabolic method collela84 and includes the solution of the frequency averaged radiation transport implicitly via moment equations, expansion opacities (see below), and a detailed equation of state. Nuclear burning is taken into account using a network which has been tested in many explosive environments (see thieleman96 , and references therein). The propagation of the nuclear burning front is given by the velocity of sound behind the burning front in the case of a detonation wave, and in a parameterized form during the deflagration phase, calibrated by detailed 3-D calculations (e.g. khokhlov01 ). The density for the transition from deflagration to detonation is treated as a free parameter.
5.1 A.2 Light Curves
From these explosion models the subsequent expansion and bolometric and broad band light curves (LC) are calculated following the method described by hwt98 , and references therein. The LC-code is the same as used for the explosion except that -ray transport is included via a Monte Carlo scheme and nuclear burning is neglected. In order to allow a more consistent treatment of the expansion, we solve the time-dependent, frequency-averaged radiation moment equations. The frequency-averaged variable Eddington factors and mean opacities are calculated from the frequency-dependent transport equations in a co-moving frame at each time step. The averaged opacities have been calculated assuming local thermodynamic equilibrium (LTE). Both the monochromatic and mean opacities are calculated in the narrow line limit. Scattering, photon redistribution, and thermalization terms, calibrated by the full non-LTE-atomic models, have been included. About one thousand frequencies (in one hundred frequency groups) and about nine hundred depth points are used.
5.2 A.3 Spectral Calculations
Our non-LTE code (hoeflich95 , and references therein) solves the relativistic radiation transport equations in a co-moving frame. The spectra are computed for various epochs using the chemical, density, and luminosity structure and -ray deposition resulting from the light curve coder. This provides a tight coupling between the explosion model and the radiative transfer. The effects of instantaneous energy deposition by -rays, the stored energy (in the thermal bath and in ionization) and the energy loss due to the adiabatic expansion are taken into account. Bound-bound, bound-free and free-free opacities are included in the radiation transport, which has been discretized with about frequencies and 97 radial points.
The radiation transport equations are solved consistently with the statistical equations and ionization due to -radiation for the most important elements and ions. Typically, between 27 and 137 bound levels are used for C, O, Mg, Si, Ca, Ti, Fe, Co, Ni with a total of about 40,000 individual NLTE-lines. The neighboring ionization stages have been approximated by simplified atomic models restricted to a few NLTE levels + LTE levels. The energy levels and cross sections of bound-bound transitions are taken from kurucz93 ; kurucz94 starting at the ground state. The bound-free cross sections are taken from TOPBASE mendoza93 . Collisional transitions are treated in the ‘classical’ hydrogen-like approximation mihalas78 that relates the radiative to the collisional gf-values. All form factors are set to 1. About 106 additional lines are included (out of a line list of ) assuming LTE-level populations. The scattering, photon redistribution, and thermalization terms are computed with an equivalent-two-level formalism.
6 Appendix B: Uncertainties
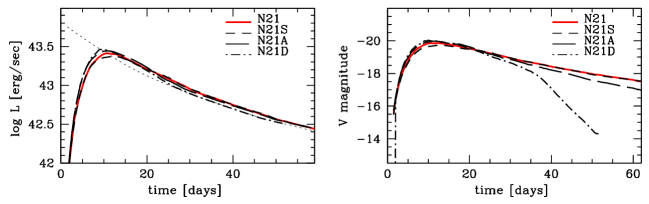
In the detailed numerical models described in the last section we can identify three kinds of uncertainties: 1) uncertainties in the nuclear and atomic data such as cross-sections and opacities, 2) errors due to inconsistencies, discretization, and approximations for the numerical solution, and 3) conceptual simplifications in the supernova scenario. In Fig. 15 and hoeflich91 ; hoeflich93 ; khokhlov93 , the effects of the opacities, scattering ratio, approximations for (gray) radiation transport and different frequency averaging procedures have been tested with respect to typical properties of the LCs such as the absolute brightness , rise time and color index B-V (Figs. 15, 16). Before these papers, theoretical models were based on the diffusion approximation and opacities that were constant with density, chemistry and time. Clearly, those assumptions were not adequate. However, within reasonable simplifications, the uncertainties in bolometric luminosity , absolute magnitude in V band , time of peak V magnitude , and color (flux ratio) B-V have been found to be less than 10%, even if the opacities have been scaled by a factor of 3 either way.

Within this narrow range the numerical solution of the radiation transport problem helps to improve the differences between and the energy production due to . As discussed in sections III and IV there exists a strong physical basis for this as well as tight model restrictions on the variation. Extensive tests showed variations in are less than even if we allow for model assumptions which have since been ruled out or for use of clearly simplified approximations (e.g. one-zone model). The exact time of maximum light is governed by when the temperature drops below , i.e. when the mean opacity drops by several orders of magnitude hoeflich91 ; hoeflich93 ; khokhlov93 . Prior to maximum light, the drop in the temperature is governed by the expansion work and only to a small degree by radiation transport effects hoeflich93 . Note that V is well determined because it is in the linear tail of the emissivity. Uncertainties in B, in particular past maximum light, have been found to be up to because the size of line blocking and photon redistribution effects change drastically over the period considered.
We can also test the global energy conservation based purely on observations and predictions. Fig. 16 shows the relation between luminosity and the monochromatic colors, known as the bolometric correction BC. The empirical and model based factors for BC agree to better than hk96 . Another class of test is based on predictions of distances for individual SNe Ia hoeflich92 ; mueller94 made prior to their determination based on stars by HST: all but one agreed well within the -error bars (see table 1 from hk96 ). A notable exception was the peculiar SN1991T for which hoeflich91 predicted a distance of Mpc while distance measurements of a neighboring galaxy (host of 60f) suggested a distance of 19Mpc saha97 . However, recently a direct measurement of the host galaxy by reduced the distance to 13.5 Mpc saha01 .
Discretization errors have been tested by doubling the number of depth points (e.g. khokhlov93 , hoeflich95 ). Typically, we use 456 to 912 depth points. The errors are found to be less than a few percent in the total energy and the production of elements during the explosion. For the LCs and spectra, the resulting fluxes change by less than 1% hoeflich95 . In the LC flux calculations, the main sources of errors are due to the limitations of the frequency grid, the neglect of aberration terms in the radiation transport equation, and the use of simplified atomic models for the frequency redistribution of photons. If we compare the LCs with the spectral calculations, the resulting error is in the flux and about and in B-V around maximum light and about 2 weeks after maximum, respectively hoeflich95 ; bowers97 ; hwt98 ; hgfs02 .
Errors can arise because the models are simplifications of reality, e.g. adopting spherical symmetry. Deviations from this could be due to either global asymmetries in the density or the distribution of elements wang97 ; wang01 ; howell01 . In general, only upper limits for normal bright SNe Ia are given; recent observations with VLT indicate a level of about 0.1%, which translates into a direction dependent luminosity of hoeflich91 . However, the subluminous SN1999by shows polarization as high as 0.7% howell01 , and rotational symmetry. This implies that the luminosity will vary by about , depending on the position of the observer.
Another possible breakdown in geometry is the description of the burning front but, currently, the size of this effect is hard to estimate. As noted above, 3-D models are currently limited to the regime of linear instabilities and a significant amount of C/O remains unburned (). Clearly, these early 3-D attempts are in contradiction with observations.