11email: Luca.Cortese@mib.infn.it; Giuseppe.Gavazzi@mib.infn.it 22institutetext: Laboratoire d’Astrophysique de Marseille, BP8, Traverse du Siphon, F-13376 Marseille, France.
22email: jorge.iglesias@oamp.fr; alessandro.boselli@oamp.fr 33institutetext: Instituto Nactional de Astrofisica, Optica y Electronica, Apartado Postal 51 C.P. 72000 Puebla, Pue., Mexico. 33email: carrasco@transum.inaoep.mx 44institutetext: Observatorio Astronomico Nacional/UNAM, Ensenada B.C., Mexico.
Optical spectroscopy and the UV luminosity function of galaxies in the Abell 1367, Coma and Virgo clusters.††thanks: Based on observations obtained with the Loiano telescope belonging to the University of Bologna (Italy), with the G.Haro telescope of the INAOE (Mexico) and with the Calar Alto observatory operated by the Centro Astronomico Hispano Aleman (Spain).
Optical spectroscopy of 93 galaxies, 60 projected in the direction of Abell 1367, 21 onto the Coma cluster and 12 on Virgo, is reported. The targets were selected either because they were detected in previous H, UV or surveys. The present observations bring to 100% the redshift completeness of H selected galaxies in the Coma region and to 75% in Abell 1367. All observed galaxies except one show H emission and belong to the clusters. This confirms previous determinations of the H luminosity function of the two clusters that were based on the assumption that all H detected galaxies were cluster members. Using the newly obtained data we re-determine the UV luminosity function of Coma and we compute for the first time the UV luminosity function of A1367. Their faint end slopes remain uncertain (-2.00-1.35) due to insufficient knowledge of the background counts. If 90% of the UV selected galaxies without redshift will be found in the background (as our survey indicates), the slope of UV luminosity function will be -1.35, in agreement with the UV luminosity function of the field (Sullivan et al. 2000) and with the H luminosity functions of the two clusters (Iglesias-Paramo et al. 2002). We discover a point like H source in the Virgo cluster, associated with the giant galaxy VCC873, possibly an extragalactic HII region similar to the one recently observed in Virgo by Gerhard et al. (2002).
Key Words.:
galaxies: redshift; galaxies: luminosity function; galaxies: clusters: individual: Abell 1367, Coma, Virgo1 Introduction
Multi-wavelength determinations of the luminosity function of galaxies belonging to nearby
rich clusters are fundamental tools for shedding light on the process of galaxy evolution and, in conjunction
with similar determinations of ”field” galaxies, should help unveiling the
role of the environment on galaxy evolution.
These determinations suffer from insufficient redshift coverage, a crucial parameter for
discriminating the (minority of) cluster members from the background interlopers.
Luminosity functions based on narrow band (i.e. H) surveys are less affected by the redshift incompleteness:
only emission-line galaxies in a narrow recessional velocity range are detected by the limited band–width of the adopted filters.
Complementary redshift information is nevertheless highly recommended in order to reject
background objects whose H or [OIII] lines would fall into the band designed for
containing the redshifted H line.
Iglesias-Paramo et al. (2002) carried out a deep H imaging survey of 1 1 degree area
in Coma and A1367 clusters
and obtained the first H luminosity function of nearby clusters of galaxies.
By that time approximately fifty percent of H emitting galaxies had no estimate of the recessional velocity.
With the aim of measuring the remaining redshifts and for confirming the H emission of these galaxies
we carried out the spectroscopic survey presented in this paper.
As a side product we also obtained redshifts of several
UV selected galaxies in Coma and A1367 regions which enable us to re-compute the
UV luminosity functions of the two clusters.
The present paper is arranged as follows: Section 2 contains a description of the galaxy selection criteria.
The observations and the data-reduction procedures are described in Section 3.
The new redshift are presented in Section 4 along with the data on one interesting object in the Virgo cluster.
The H and UV luminosity functions of A1367
and Coma are discussed in Section 5. Conclusions are briefly summarized in Section 6.
2 The sample selection criteria
Galaxies in the present study were primarily selected among objects, projected in the direction of the Abell
1367 and Coma clusters,
with H emission detected in the INT H survey of
(Iglesias-Paramo et al. (2002)) or selected from the survey by Iglesias-Paramo et al. (2003).
The H selected galaxies in the Coma cluster were all spectroscopically measured, while only 75% of them
were observed in A1367. The selected galaxies with have been observed with a completeness
of 64% and 92% for A1367 and Coma respectively.
In addition to these, we selected 20 targets with UV
magnitude
detected by the FOCA balloon-borne wide field UV camera ()
(Donas et al. 1995 and Donas, private communication).
The UV magnitude is defined as: ,
where is the flux in units of
The spatial resolution of the UV data is 20 arcsec FWHM (Milliard et al. 1992). The astrometric
accuracy of these data is therefore typically 3-5 arcsec, insufficient for
unambiguously identifying spectroscopic targets and discriminating between stars and galaxies.
To overcome this limitation, we cross-correlated the FOCA catalogues of A1367 and Coma with the band
catalogue of galaxies () by Iglesias-Paramo et al. (2003), using a matching radius of 20 arcsec.
In cases of multiple identifications we select the galaxy closest to the UV position. Including the present
observations, spectra are available for 64% and 56% of the
UV selected galaxies with an optical counterpart
in A1367 and Coma respectively.
A dozen of faint H emitting galaxies in the Virgo cluster with no estimate of the recessional
velocity in the literature were also selected as filler objects.
These were serendipitously found around bright VCC galaxies by visual inspection to the net ()
frames obtained at the INT by Boselli et al. (virgoint (2002)).
3 Observations and data reduction
Long-slit, low dispersion spectra of 93 galaxies were obtained in several observing runs since 2001 using the
imaging
spectrograph BFOSC attached to the Cassini 1.5m telescope at Loiano (Italy), LFOSC at the 2.1m telescope of
the Guillermo
Haro Observatory at Cananea (Mexico), and with CAFOS attached to the 2.2m telescope of the
Calar Alto Observatory (Spain). Table 1 lists the characteristics of the instrumentation in the
adopted set-up.
The observations at Loiano (44 galaxies) were performed using a 2.0 or 2.5 arcsec slit, depending on the seeing conditions,
generally oriented
E-W. The wavelength calibration was secured with exposures of HeAr lamps.
The on-target exposure time ranged between 15 and 30 min according to the brightness of the targets.
The observations at Cananea (40 galaxies) were carried out with a 1.9 arcsec slit, generally oriented N-S.
The wavelength calibration was secured with exposures of XeNe lamps.
The on-target exposure time ranged between
20 and 40 min according to the brightness of the targets.
The observations at Calar Alto (9 galaxies) were carried out with a 1.5 arcsec slit, generally oriented N-S.
The wavelength calibration was secured with exposures of CdHe lamps. The on-target exposure time ranged between
15 and 30 min according to the brightness of the targets. In all runs the observations were obtained in nearly
photometric conditions, with thin cirrus. The orientation of the slit was modified from the set-up given above
when two
adjacent objects could be observed in the same exposure.
The data reduction was performed in the IRAF environment. After bias subtraction, when 3 or more frames of the
same target
were obtained, these were combined (after spatial alignment) using a median filter to help cosmic rays removal.
Otherwise
the cosmic rays were removed using the task COSMICRAYS and/or under visual inspection.
The lamps wavelength calibration was checked
against known sky lines. These were found within from their nominal position, providing
an estimate of the systematic
uncertainty on the derived velocity of .
After subtraction of sky background, one-dimensional spectra were
extracted from the frames. The redshift were obtained using the cross-correlation
technique of Tonry & Davis (tonry (1979)).
This method is based on a ”comparison” between the spectrum of a galaxy (or a star) whose redshift is to be
determined, and a fiducial
spectral template of a galaxy of appropriate spectral type to contain the wanted absorption/emission lines.
The basic assumption behind this method is that the spectrum of a galaxy is well approximated by the spectrum
of its stars,
modified by the effects of the stellar motion inside the galaxy and by the systemic redshift. For this purpose
high
signal-to-noise spectra were taken of two template galaxies: VCC0066 (emission lines) and NGC221
(absorption lines), which were
converted to the rest frame . The derived redshift are not transformed to Heliocentric.
4 Results
The velocity measurements obtained in this work are listed in Table 2 as follow:
Column 1: Galaxy designation. For Virgo cluster we use the VCC (Binggeli et al. (1985)) and VPC (Young & Currie 1998)
designations when available.
Column 2, 3: (J2000) celestial coordinates, measured with few arcsec uncertainty.
Column 4: band magnitude.
Column 5, 6: observed recessional velocity with uncertainty derived in this work.
The latter quantity includes only statistical
errors. The global uncertainty can be derived by adding in quadrature due to the
uncertainty in the absolute wavelength calibration.
Column 7: type of lines (A=absorption; E=Emission)
Column 8: telescope (LOI=Loiano; CAN=Cananea, CAL=Calar Alto)
Column 9: galaxies selection band (UV, H or )
4.1 The Virgo cluster
Twelve redshift measurements presented in this work are of faint () objects in the Virgo cluster
which were serendipitously detected near bright VCC galaxies as part of an H
imaging survey of this cluster (Boselli et al. 2002).
Four of these galaxies turned out to be background galaxies whose emission, revealed in
the net () frames, is in fact due to H and [OIII] lines, showing that
at the faint limit of the survey the contamination by this type of objects becomes relevant.
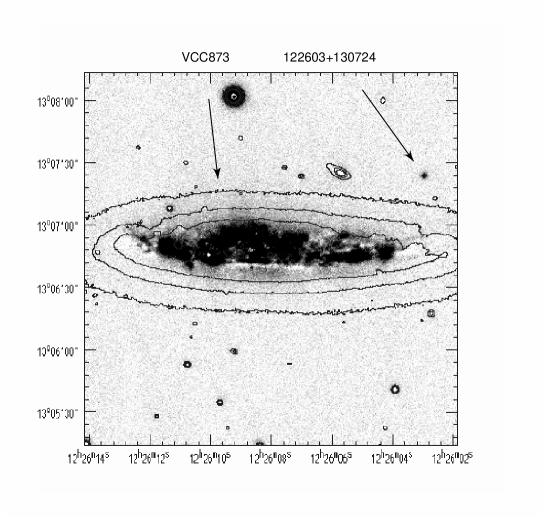
We would like to draw the attention on the point-like H source
122603+130724 detected at the projected distance of 2’
from the giant galaxy VCC873 shown in Fig. 1.
The source shows an
H equivalent width of
and an H flux .
In spite of its very faint continuum (), the 15 min spectrum of this object
taken with the Loiano 1.5m telescope
yielded a prominent H emission at
, consistent with the velocity of
VCC873 ().
Unlike planetary nebulae (ICPNe) found near giant galaxies in the
Virgo and Fornax cluster (Arnaboldi et al. 1996; Theuns & Warren 1997) showing strong
[OIII] lines (Dopita et al. 1992),
122603+130724 is not detected in [OIII].
However, given the weakness of the available spectrum, the upper limit on [OIII]
is 0.3 of the H flux, therefore
consistent with 122603+130724 being
an extragalactic HII region (Dopita et al. 2000) associated with the giant galaxy VCC873.
The point-like H source 122544+130740 listed in Table 2
could be another extragalactic HII region, in this case not associated with a bright cluster galaxy.
However the redshift of this faint () object, based on one line (presumably H)
needs confirmation because it lies at a projected
distance of 10 arcsec from a bright star.
Gerhard et al. (2002) found 17 candidate extragalactic HII regions in the Virgo cluster, among
which the one associated with VCC836 was confirmed spectroscopically.
Objects of this kind could account for the diffuse intracluster light (Bernstein et al. 1995)
and might contribute to the enrichment of the intergalactic medium in clusters.
5 The luminosity functions
5.1 The H luminosity function
With the new data presented in this work, the redshift of all H selected galaxies in the Coma cluster
(Iglesias-Paramo et al. (2002)) have been measured.
All objects turned out to be cluster members () and significant H
emission was detected
in their spectra. The H luminosity function determined by Iglesias-Paramo et al. (2002) assuming that all objects were
at the distance of Coma is fully confirmed.
In A1367 we measured the redshift of 14 galaxies, bringing to 75% the completeness of H selected
galaxies in this cluster.
The membership to the cluster was confirmed for 13 galaxies, while 1 (114430+195718) turned out to be
a background galaxy whose emission, revealed by
Iglesias-Paramo et al. (2002) is in fact due to H and [OIII] lines.
This confirms that the H survey by Iglesias-Paramo et al. (2002) is little contaminated by
H and [OIII] emission lines from background objects, emphasizing the high success-rate of
selecting emission line members with the Iglesias-Paramo et al. (2002) method.

5.2 The UV luminosity function


The H luminosity functions of Coma and A1367 are found consistent one another, being characterized by a faint end slope -0.7. This value differs significantly from the slope of the UV luminosity function of Coma (Andreon 1999, hereafter A99) -2.0, the only UV luminosity function ever determined for a cluster. While stars with masses M and lifetimes 20 Myr contribute significantly to the H flux, the UV emission is dominated by young stars of intermediate masses (2 M5 ). Furthermore UV emission is detected also from early-type galaxies with no recent star formation episodes (Deharveng et al. 2002). However these differences alone are insufficient for producing discrepant luminosity function such as obtained in the two bands. Thus we use the spectroscopic observations presented in this work to re-compute the Coma UV luminosity function and to compute, for the first time, the UV luminosity function of A1367. Using the same UV data available to A99, we cross-correlate the UV detections with the ’ catalogue of Iglesias-Paramo et al. (2003) for a better star/galaxy discrimination. This reduces our luminosity function determination to an area of (the same over which we determined the H luminosity function), instead of analyzed by A99. The determination of the cluster luminosity function requires a reliable estimate of the contribution of background/foreground objects to the UV counts. This can be accurately achieved for 16.75, since for these UV sources the redshift completeness is 90% (see Fig.2). At fainter magnitudes the redshift completeness drops rapidly, thus requiring the contamination to be estimated statistically from the number of field galaxies, per bin of UV magnitude, that are expected to be randomly projected onto the cluster area. The over-density of UV counts due to Coma/A1367 galaxies can be derived from the difference between the counts in the direction of the two clusters and the UV galaxy counts derived in three random fields by Milliard et al. (1992) using the same experimental set up as for Coma and A1367. Opposite to our expectation the cluster galaxy counts at faint magnitudes are 3 times lower than the Milliard et al. (1992) number counts (see Fig. 4), as already noticed by A99. The reason for such discrepancy is not fully understood and might reflect a higher degree of star contamination among the UV counts than estimated by Milliard et al. (1992).

Alternatively it might derive from a higher than expected
fraction of foreground galaxies in Milliard et al. (1992). However foreground galaxies should contribute
significantly less than background objects due to the small sampled volume at .
Using our new redshifts we can at least estimate a minimum and a maximum background contribution
to the observed counts in the direction of Coma and A1367, a method followed by A99.
The true background is at least composed of
all objects whose velocity falls outside the assumed range for the clusters ().
At most it comprises also all galaxies with unknown redshift.
These limiting estimates, shown in Figure 4 for
Coma (dotted line) and A1367 (long dashed line), are found in good reciprocal agreement, but
are significantly lower than the background counts estimated by Milliard et al. (1992).
The resulting clusters UV luminosity functions should lie in between the two determinations given
in Figs. 5 and 6.
Due to the large uncertainties we did not attempt to fit a complete Schechter (1976) function to the data.
Instead we fit the low-end slope (15.518) with an exponential form
of slope where is the UV magnitude and is related to the
parameter of the Schecther function by:
The resulting UV luminosity function of A1367 shows a slope between = 0.14 0.08 and = 0.42 0.09 (equivalent to =-1.350.20 and =-2.050.22). Similarly, for the UV luminosity function of Coma we find = 0.14 0.09 and = 0.37 0.09 (equivalent to =-1.350.22 and =-1.940.24). The upper and lower limits of the UV luminosity functions of the two clusters are in fair agreement, but the allowed range between the two limits is still very broad. Likely the low limit gives a more realistic representation of the true UV luminosity function because nearly all (18/20 or 90%) of the UV selected galaxies for which we obtained a redshift in this work turned out to be in the background. The low limit slope -1.35 is in agreement with the field UV luminosity function of Sullivan et al. (2000) and it is consistent with the slope of the H luminosity function of the two clusters as determined by Iglesias-Paramo et al. (2002). Certainly the very steep (-2.0, -2.2) luminosity function found for Coma by A99 is due to an underestimate of the density of background galaxies.
6 Summary and conclusions
Optical spectroscopy of 93 galaxies, 60 of which are projected in the direction of Abell 1367, 21 onto the
Coma cluster and 12 onto Virgo, is reported. These observations bring the redshift
completeness among H
selected galaxies by Iglesias-Paramo et al.(2002) to 100% in the Coma region and to 75%
in Abell 1367. All, except one, the H selected galaxies show H emission and are confirmed cluster members.
The exception is a background galaxy whose [OIII] lines fall in the H filter.
The H luminosity function of the two clusters determined by
Iglesias-Paramo et al. (2002) is fully confirmed.
Redshifts of UV selected galaxies in Coma and A1367 regions were also obtained. With these new data
the redshift completeness in the core
of the two clusters has reached 90% for 16.75. We re-determine the Coma UV luminosity function
and we compute for the first time the
UV luminosity function of A1367. The two are found in fair agreement. Their faint–end slopes remain
unconstrained (-2.00-1.35) due to the uncertainty on the background counts. However if
90% of the UV selected galaxies without a
redshift measurement will be found in the cluster background, as our data indicate, the slope of the UV luminosity
function should be near -1.35, in
agreement with the field one (Sullivan et al. 2000) and with the H luminosity functions of
the two clusters (Iglesias-Paramo et al. 2002).
Finally we discover a point like H source in the Virgo cluster,
associated with the giant galaxy VCC873, possibly an extragalactic HII region as the one recently observed
in Virgo by Gerhard et al.(2002).
Objects of this kind could account for the diffuse intracluster light and might contribute
to the enrichment of intergalactic medium in galaxy clusters.
Acknowledgements.
We wish to thank Jose Donas for providing us with his unpublished catalogue of UV sources in the Coma and Abell 1367 fields. The TACS of the Loiano, Cananea and Calar Alto telescopes are acknowledged for the generous time allocation to this project. This work could not be completed without the NASA/IPAC Extragalactic Database (NED) which is operated by the Jet Propulsion Laboratory, Caltech under contract with NASA.References
- Andreon (1999) Andreon S., 1999, A&A, 351, 65
- (2) Arnaboldi M., Freeman K. C., Mendez R. H., Capaccioli M., Ciardullo R., Ford H., Gerhard O., Hui X., Jacoby G. H., Kudritzki R. P., Quinn P. J., 1996, ApJ, 472, 145
- (3) Bernstein G. M., Nichol R. C., Tyson J. A., Ulmer M. P., Wittman D., 1995 AJ, 110, 1507
- Binggeli et al. (1985) Binggeli B., Sandage A., & Tammann G., 1985, AJ, 90, 1681
- (5) Boselli A., Iglesias-Paramo J., Vilchez J. M. & Gavazzi G., 2002, A&A, 386, 134
- (6) Deharveng J. M., Boselli A. & Donas J., 2002, A&A, 393, 843
- (7) Dopita M. A., Jacoby G. H., Vassiliadis E., 1992, ApJ, 389, 27
- (8) Dopita M. A., Kewley L. J., Heisler C. A., & Sutherland R. S., 2000, ApJ, 542, 224
- (9) Dressler A., 1980, ApJ, 236, 351
- (10) Gerhard, O., Arnaboldi M., Freeman K. C., Okamura S., 2002, ApJ, 580, L121
- Iglesias-Paramo et al. (2002) Iglesias-Paramo J., Boselli A., Cortese L., Vilchez J.M. & Gavazzi G., 2002, A&A, 384, 383
- Iglesias-Paramo et al. (2003) Iglesias-Paramo J., Boselli A., Gavazzi G., Cortese L. & Vilchez J.M., 2003, A&A, 397, 421
- Milliard et al. (1992) Milliard B., Donas J., Laget M., Armand C. & Vuillemin A., 1992, A&A, 257, 24
- (14) Donas, J., Milliard, B.& Laget, M., 1995, A&A, 303, 661
- (15) Theuns T., Warren S., 1997, MNRAS, 284, L11
- (16) Tonry J., Davis M., 1979, AJ, 84, 1511
- (17) Schechter P., 1976, ApJ, 203, 297
- (18) Sullivan M., Treyer M. A., Ellis R. S., Bridges T. J., Milliard B., Donas J., 2000, MNRAS, 312, 442
- (19) Young C. K., Currie M. J., 1998, A&AS, 127, 367
| Name | R.A. | Dec. | vel | Lines | Tel. | Sel. | ||
| (J.2000) | (J.2000) | mag | ||||||
| A1367 | ||||||||
| 114038+195437 | 11 40 38.96 | +19 54 37.4 | 17.48 | 7784 | 96 | E | LOI | H |
| 114110+201117 | 11 41 10.47 | +20 11 17.7 | 17.57 | 6952 | 22 | E | LOI | H |
| 114117+200832 | 11 41 17.60 | +20 08 32.0 | 15.93 | 14500 | 20 | E | LOI | UV |
| 114137+194451 | 11 41 37.90 | +19 44 51.0 | 17.14 | 27891 | 80 | A | CAN | UV |
| 114141+200230 | 11 41 41.20 | +20 02 30.5 | 17.37 | 8447 | 51 | E | LOI | H |
| 114142+200054 | 11 41 42.57 | +20 00 54.9 | 17.33 | 8456 | 69 | E | LOI | H |
| 114149+194605 | 11 41 49.79 | +19 46 05.1 | 17.52 | 7789 | 39 | E | LOI | H |
| 114156+194836 | 11 41 57.03 | +19 48 36.2 | 16.53 | 28896 | 140 | A | CAN | |
| 114229+195238 | 11 42 29.00 | +19 52 38.0 | 17.37 | 14084 | 130 | A | CAN | UV |
| 114238+192103 | 11 42 38.40 | +19 21 03.0 | 17.16 | 18674 | 72 | E | LOI | UV |
| 114240+195716 | 11 42 40.36 | +19 57 16.6 | 17.68 | 7501 | 46 | E | LOI | H |
| 114252+192543 | 11 42 52.22 | +19 25 43.4 | 15.13 | 24452 | 114 | A | LOI | |
| 114253+201039 | 11 42 53.11 | +20 10 39.8 | 15.43 | 6261 | 192 | A | CAN | |
| 114300+201225 | 11 43 00.30 | +20 12 25.9 | 14.90 | 20965 | 133 | A | CAN | |
| 114306+195620 | 11 43 06.31 | +19 56 20.0 | 15.21 | 6321 | 103 | A | LOI | |
| 114308+194155 | 11 43 08.00 | +19 41 55.0 | 16.45 | 12988 | 16 | E | LOI | UV |
| 114311+200144 | 11 43 11.19 | +20 01 44.9 | 15.37 | 6994 | 102 | A | CAN | |
| 114312+193841 | 11 43 12.68 | +19 38 41.0 | 16.23 | 27884 | 152 | A | CAN | |
| 114313+193645 | 11 43 13.08 | +19 36 45.8 | 17.27 | 6121 | 131 | E | LOI | H |
| 114314+194016 | 11 43 14.23 | +19 40 16.7 | 15.03 | 28078 | 142 | A | CAN | |
| 114315+195614 | 11 43 15.57 | +19 56 15.3 | 16.57 | 28847 | 117 | A | CAN | |
| 114331+200058 | 11 43 31.30 | +20 00 58.0 | 16.44 | 30164 | 23 | E | LOI | UV |
| 114337+191836 | 11 43 37.70 | +19 18 36.0 | 16.65 | 24154 | 132 | E | CAN | UV |
| 114341+200135 | 11 43 41.62 | +20 01 35.3 | 17.08 | 6455 | 66 | E | LOI | H |
| 114345+192332 | 11 43 45.41 | +19 23 32.0 | 15.60 | 27889 | 258 | A | LOI | |
| 114350+192606 | 11 43 50.85 | +19 26 06.2 | 15.31 | 6135 | 141 | A | CAN | |
| 114353+194321 | 11 43 53.88 | +19 43 21.3 | 17.15 | 24613 | 185 | A | CAN | |
| 114353+194428 | 11 43 53.77 | +19 44 28.6 | 15.30 | 6120 | 131 | A | CAN | |
| 114355+192743 | 11 43 55.71 | +19 27 43.9 | 18.72 | 6427 | 50 | E | LOI | H |
| 114357+195607 | 11 43 57.46 | +19 56 07.6 | 15.47 | 7057 | 88 | A | CAN | |
| 114401+191555 | 11 44 01.10 | +19 15 55.0 | 16.57 | 28353 | 76 | A | CAN | UV |
| 114401+191707 | 11 44 01.00 | +19 17 07.0 | 16.92 | 12784 | 91 | E | CAN | UV |
| 114401+192953 | 11 44 01.00 | +19 29 53.0 | 16.31 | 19367 | 25 | E | LOI | UV |
| 114403+194433 | 11 44 03.31 | +19 44 33.0 | 15.53 | 6715 | 101 | A | CAN | |
| 114407+193724 | 11 44 07.80 | +19 37 24.0 | 17.28 | 39774 | 85 | A | CAN | UV |
| 114413+192012 | 11 44 13.80 | +19 20 12.0 | 16.90 | 5852 | 47 | E | LOI | |
| 114419+191902 | 11 44 19.30 | +19 19 02.0 | 16.90 | 26091 | 217 | E | CAN | UV |
| 114430+195718 | 11 44 30.41 | +19 57 18.8 | 20.23 | 96341 | 19 | E | LOI | H |
| 114444+194814 | 11 44 44.28 | +19 48 14.0 | 19.62 | 8098 | 62 | E | CAL | H |
| 114446+194737 | 11 44 46.13 | +19 47 37.5 | 19.35 | 8240 | 59 | E | CAL | H |
| 114446+194639 | 11 44 46.68 | +19 46 39.5 | 22.03 | 8383 | 36 | E | CAL | H |
| 114447+194648 | 11 44 47.54 | +19 46 48.8 | 21.81 | 8428 | 33 | E | CAL | H |
| 114450+194605 | 11 44 50.81 | +19 46 05.1 | 20.16 | 8089 | 50 | E | LOI | H |
| 114451+194717 | 11 44 51.27 | +19 47 17.5 | 19.24 | 8022 | 35 | E | LOI | H |
| 114454+194733 | 11 44 54.22 | +19 47 33.2 | 18.32 | 8067 | 31 | E | LOI | H |
| 114454+200101 | 11 44 54.55 | +20 01 02.0 | 16.14 | 7646 | 500 | E | CAN | H |
| 114459+194757 | 11 44 59.35 | +19 47 57.1 | 18.42 | 39550 | 79 | E | LOI | |
| 114501+194550 | 11 45 01.90 | +19 45 50.0 | 16.74 | 20575 | 30 | E | CAN | UV |
| 114502+194520 | 11 45 02.71 | +19 45 20.6 | 16.74 | 20626 | 13 | E | LOI | |
| 114505+194514 | 11 45 05.67 | +19 45 14.8 | 18.07 | 20263 | 150 | A | CAN | |
| 114506+194733 | 11 45 05.98 | +19 47 33.6 | 16.82 | 19919 | 58 | E | LOI | |
| 114506+200921 | 11 45 06.56 | +20 09 21.4 | 15.36 | 6145 | 184 | A | LOI | |
| 114513+194523 | 11 45 13.77 | +19 45 22.2 | 15.84 | 8316 | 224 | E | CAN | H |
| 114514+200836 | 11 45 14.10 | +20 08 36.0 | 16.99 | 3752 | 43 | E | CAN | UV |
| 114518+200009 | 11 45 18.00 | +20 00 09.5 | 17.54 | 5327 | 28 | E | LOI | H |
| 114525+194905 | 11 45 25.56 | +19 49 05.7 | 15.22 | 8422 | 123 | A | CAN | |
| 114541+194613 | 11 45 41.16 | +19 46 13.4 | 14.89 | 5419 | 138 | A | CAN | |
| 114545+194130 | 11 45 45.20 | +19 41 30.0 | 16.48 | 6123 | 17 | E | CAN | UV |
| 114558+194810 | 11 45 58.59 | +19 48 10.9 | 15.41 | 5493 | 173 | A | LOI | |
| 114611+195110 | 11 46 11.99 | +19 51 10.0 | 15.07 | 5441 | 101 | A | CAN | |
| Coma | ||||||||
| 125802+282722 | 12 58 02.10 | +28 27 22.0 | 17.01 | 48300 | 150 | A | CAN | UV |
| 125815+283117 | 12 58 15.12 | +28 31 17.2 | 16.70 | 6725 | 56 | E | LOI | UV |
| 125823+281945 | 12 58 23.66 | +28 19 45.6 | 16.26 | 8352 | 126 | A | CAN | |
| 125828+283135 | 12 58 28.45 | +28 31 35.9 | 15.24 | 18290 | 104 | A | CAN | |
| 125829+281806 | 12 58 29.44 | +28 18 06.3 | 15.52 | 6082 | 99 | A | CAN | |
| 125845+283235 | 12 58 45.80 | +28 32 35.3 | 17.76 | 6333 | 14 | E | LOI | H |
| 125845+284133 | 12 58 45.64 | +28 41 33.1 | 17.21 | 6682 | 149 | E | LOI | H |
| 125856+282749 | 12 58 56.19 | +28 27 49.0 | 15.23 | 5927 | 156 | A | CAN | |
| 125918+283726 | 12 59 17.90 | +28 37 26.0 | 16.81 | 10340 | 32 | E | CAN | UV |
| 125923+282918 | 12 59 23.06 | +28 29 18.4 | 15.51 | 7015 | 165 | E | CAN | H |
| 125924+282050 | 12 59 24.11 | +28 20 50.1 | 16.62 | 20241 | 26 | E | LOI | UV |
| 125941+283026 | 12 59 41.12 | +28 30 26.6 | 15.45 | 8314 | 161 | A | CAN | |
| 125956+275548 | 12 59 56.68 | +27 55 48.2 | 15.31 | 7653 | 93 | A | CAN | |
| 130004+283614 | 13 00 04.51 | +28 36 14.1 | 15.32 | 6727 | 153 | A | CAN | |
| 130037+283951 | 13 00 37.22 | +28 39 51.7 | 16.62 | 7095 | 87 | E | CAN | H |
| 130127+281053 | 13 01 27.29 | +28 10 53.9 | 17.18 | 48821 | 100 | A | CAN | |
| 130128+281515 | 13 01 28.63 | +28 15 15.9 | 20.41 | 9061 | 33 | E | LOI | H |
| 130130+283328 | 13 01 30.85 | +28 33 28.0 | 16.76 | 6885 | 194 | E | LOI | H |
| 130140+281456 | 13 01 40.97 | +28 14 56.6 | 19.33 | 9286 | 20 | E | LOI | H |
| 130151+280822 | 13 01 51.90 | +28 08 22.0 | 17.00 | 28754 | 27 | A | CAL | UV |
| 130158+282114 | 13 01 58.43 | +28 21 14.8 | 19.81 | 8577 | 18 | E | LOI | H |
| Virgo | ||||||||
| VCC1715 | 12 37 28.45 | +08 47 39.2 | 15.37 | 888 | 32 | E | LOI | H |
| VCC 404 | 12 20 17.50 | +04 12 10.0 | 14.20 | 1746 | 93 | E | LOI | H |
| VPC766 | 12 30 46.20 | +12 05 57.1 | 17.05 | 1162 | 47 | E | LOI | H |
| 122544+130740 | 12 25 44.20 | +13 07 40.0 | 20.10 | 796 | 37 | E | CAL | H |
| 122603+130723 | 12 26 02.91 | +13 07 23.7 | 21.50 | 260 | 34 | E | LOI | H |
| 122605+130725 | 12 26 05.75 | +13 07 25.7 | 17.14 | 23980 | 40 | E | LOI | |
| 123015+122812 | 12 30 15.20 | +12 28 12.0 | 21.10 | 79521 | 37 | E | CAL | H |
| 123021+121614 | 12 30 21.10 | +12 16 14.0 | 20.70 | 90792 | 36 | E | CAL | H |
| 123222+090944 | 12 32 22.81 | +09 09 44.1 | 17.97 | 77812 | 50 | E | LOI | H |
| 123315+091448 | 12 33 15.25 | +09 14 48.0 | 17.59 | 30923 | 29 | E | LOI | |
| 123728+082540 | 12 37 28.00 | +08 25 40.0 | 20.60 | 79521 | 33 | E | CAL | H |
| 124547+102620 | 12 45 47.32 | +10 26 20.5 | 16.41 | 36946 | 144 | E | LOI | |