Spatially Resolved 3 µm Spectroscopy of IRAS 22272+5435:
Formation and Evolution of Aliphatic Hydrocarbon Dust
in
Proto-Planetary Nebula11affiliation: Based on data collected at Subaru Telescope,
which is operated by the National Astronomical Observatory of Japan.
Abstract
We present medium-resolution 3 m spectroscopy of the carbon-rich proto-planetary nebula IRAS 22272+5435. Spectroscopy with the Subaru Telescope adaptive optics system revealed a spatial variation of hydrocarbon molecules and dust surrounding the star. The ro-vibrational bands of acetylene (C2H2) and hydrogen cyanide (HCN) at 3.0 m are evident in the central star spectra. The molecules are concentrated in the compact region near the center. The 3.3 and 3.4 m emission of aromatic and aliphatic hydrocarbons is detected at 600–1300 AU from the central star. The separation of spatial distribution between gas and dust suggests that the small hydrocarbon molecules are indeed the source of solid material, and that the gas leftover from the grain formation is being observed near the central star. The intensity of aliphatic hydrocarbon emission relative to the aromatic hydrocarbon emission decreases with distance from the central star. The spectral variation is well matched to that of a laboratory analog thermally annealed with different temperatures. We suggest that either the thermal process after the formation of a grain or the variation in the temperature in the dust-forming region over time determines the chemical composition of the hydrocarbon dust around the proto-planetary nebula.
1 Introduction
IRAS 22272+5435 (= HD 285858, SAO 34504) is an extremely carbon-rich proto-planetary nebula (PPN) with peculiar infrared spectral features (Kwok, Volk, & Hrivnak, 1989; Geballe et al., 1992). A PPN is a transition object that has left the asymptotic giant branch (AGB) for a planetary nebula (PN), but it is not yet hot enough to ionize the surrounding AGB ejecta. The dust in a PPN is becoming optically thin, but has not been altered in the hard UV field of a PN. A carbon-rich PPN provides the best opportunity to study unprocessed solid carbon material immediately after the formation.
A classification of carbon dust in the interstellar medium (ISM) has been proposed by Geballe (1997) and Tokunaga (1997) based on the 3 m infrared emission features (IEF). The class A sources are characterized by the intense and isolated aromatic features at 3.3 m with an occasional association of weak and sharp peaks in the 3.4–3.5 m region. They are the most common IEF observed toward young stellar objects (YSO), H II regions, PN, reflection nebulae, diffuse interstellar medium, and extragalactic sources (Tokunaga et al., 1991; Sloan et al., 1997; Jourdain de Muizon, D’Hendecourt, & Geballe, 1990; Sellgren, Werner, & Dinerstein, 1983; Tanaka et al., 1996; Moorwood et al., 1996). The class B sources are characterized by broad and prominent aliphatic features at 3.4 m accompanied by the 3.3 m aromatic features. The class B IEF has been found exclusively toward PPNs with extremely carbon-rich chemistry typified by IRAS 22272+5435 (Geballe & Van der Veen, 1990; Geballe et al., 1992). The simultaneous presence of aromatic and aliphatic features in class B sources makes a good laboratory for the study of the transition of the chemical composition of hydrocarbons.
Another advantage in observing a PPN is that the history of its dust formation is locked in the spatial distribution of the material. Since PPNs are less developed than PNs, most of them are spatially unresolved. However, the dust distribution around IRAS 22272+5435 has been well studied by subarcsecond mid-infrared imaging (Meixner et al., 1997; Dayal et al., 1998; Ueta et al., 2001), optical imaging with the Hubble Space Telescope/Wide Field Planetary Camera 2 (HST/WFPC2) (Ueta, Meixner, & Bobrowsky, 2000), and near-infrared polarimetric imaging (Gledhill et al., 2001). Ueta et al. (2000) classified IRAS 22272+5435 as a member of PPNs that are optically thin. It therefore ensures an unobscured view of the central part of the nebula.
Although observing at 3 m is essential to assess the chemical composition of the carbon dust, a drawback is that the emitting region is physically more compact than at longer wavelengths. In addition, the contribution of the direct and scattered light from the central star is not negligible in the 3 m region. Both to resolve the dust emission region and to achieve the high dynamic range required to distinguish the faint dust emission from the central star, an adaptive optics (AO) system must be integral part of the instruments used to make the spectroscopic observations. Our goal for this work is to use the high spatial resolution spectroscopy afforded by AO to better understand how hydrocarbon dust forms around a carbon-rich evolved star, and how it is processed before dissipating into the local ISM.
2 Observation
The spectroscopic observation was made on UT 2001 July 13 using the Infrared Camera and Spectrograph (IRCS; Tokunaga et al. 1998; Kobayashi et al. 2000) at the 8.2 m Subaru Telescope in conjunction with the AO system (Takami et al., 1998; Gaessler et al., 2002). The Subaru AO system is a 36-element curvature system installed at the front end of the telescope Cassegrain port. A medium-resolution grism was used with a 030 slit in the 58 mas camera section to provide spectra from 2.84 to 4.18 m with a resolving power of 600–800. The visible central star was used as the wavefront reference source for the AO system. The position angle of the slit was 56∘ along the elongation in the mid-infrared image that corresponds to an equatorial density enhancement of the nebula (Ueta et al., 2001). The spectra were recorded by nodding the tip-tilt mirror inside the AO system by 2″ along the slit to subtract the sky emission and dark current images. The total on-source integration time was 720 s. A nearby F8V star HR 8472 was observed as a spectroscopic standard at similar airmass. The spectroscopic flat field was obtained at the end of the night with a halogen lamp.
3 Data Reduction and Results
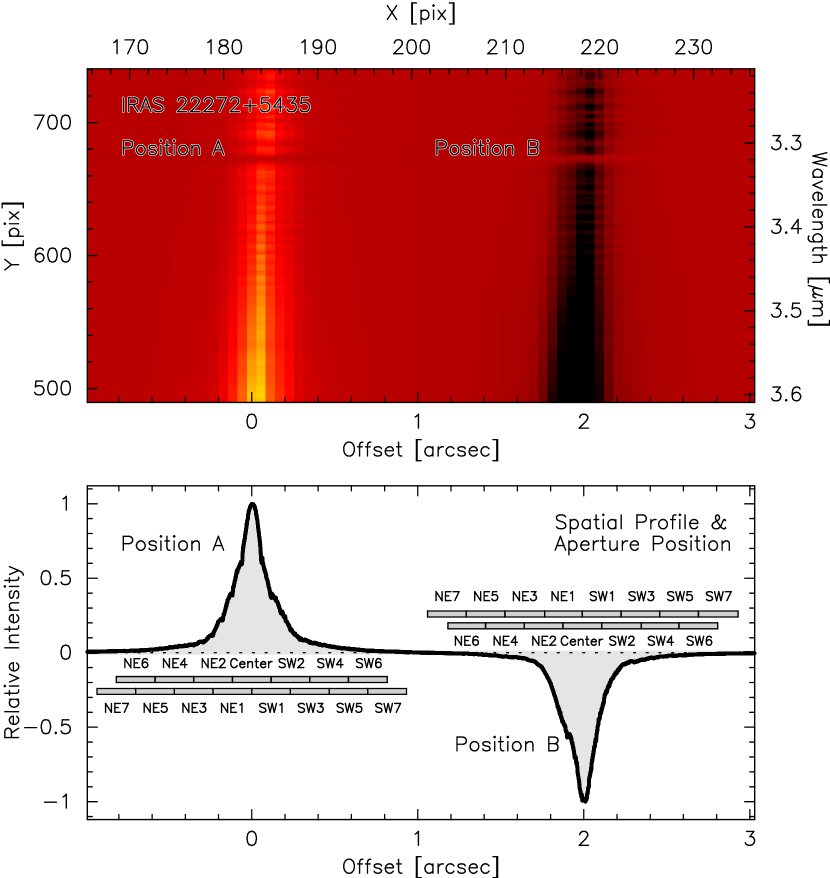
We obtained the one-dimensional spectra of IRAS 22272+5435 using the IRAF111IRAF is distributed by the National Optical Astronomy Observatories, which are operated by the Association of Universities for Research in Astronomy, Inc., under a cooperative agreement with the National Science Foundation. aperture extraction package. The aperture width was about equal to the FWHM of the spatial profile (4-pixel or 023). We set the extraction apertures at the central star and another 14 locations along the slit (Figure 1). We found the spectra recorded at the nodding positions A and B to be slightly different. The most likely reason for this is that the mirror nodding axis was not precisely straight to the slit, and we observed slightly different parts of the nebula. The data obtained at positions A and B were reduced separately. The wavelength calibration was performed by fitting over 60 telluric absorption lines in the 3 m region. The flux calibration relative to the standard star was made assuming the intrinsic spectrum of a F8V star is represented by a Planck function of 6100 K (Tokunaga, 2000). The hydrogen recombination lines in the standard star spectrum were fit with a Gaussian function and subtracted before dividing. The details of the reduction can be found elsewhere (Goto et al., 2002).
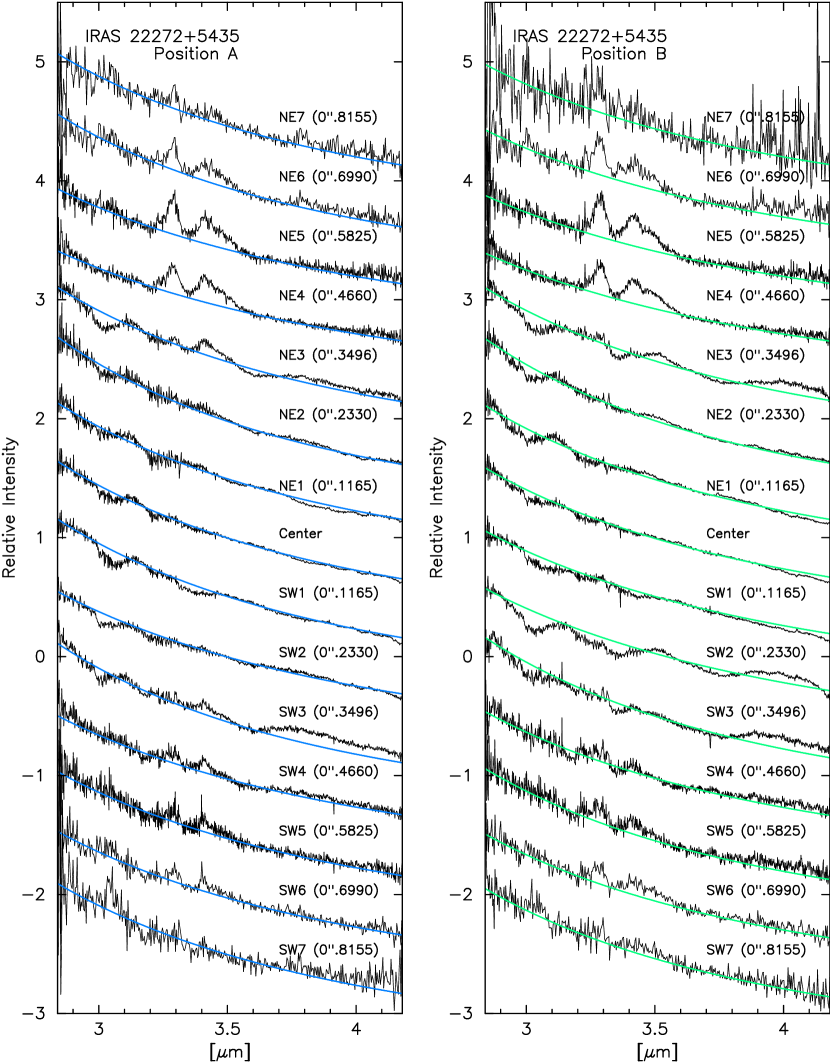
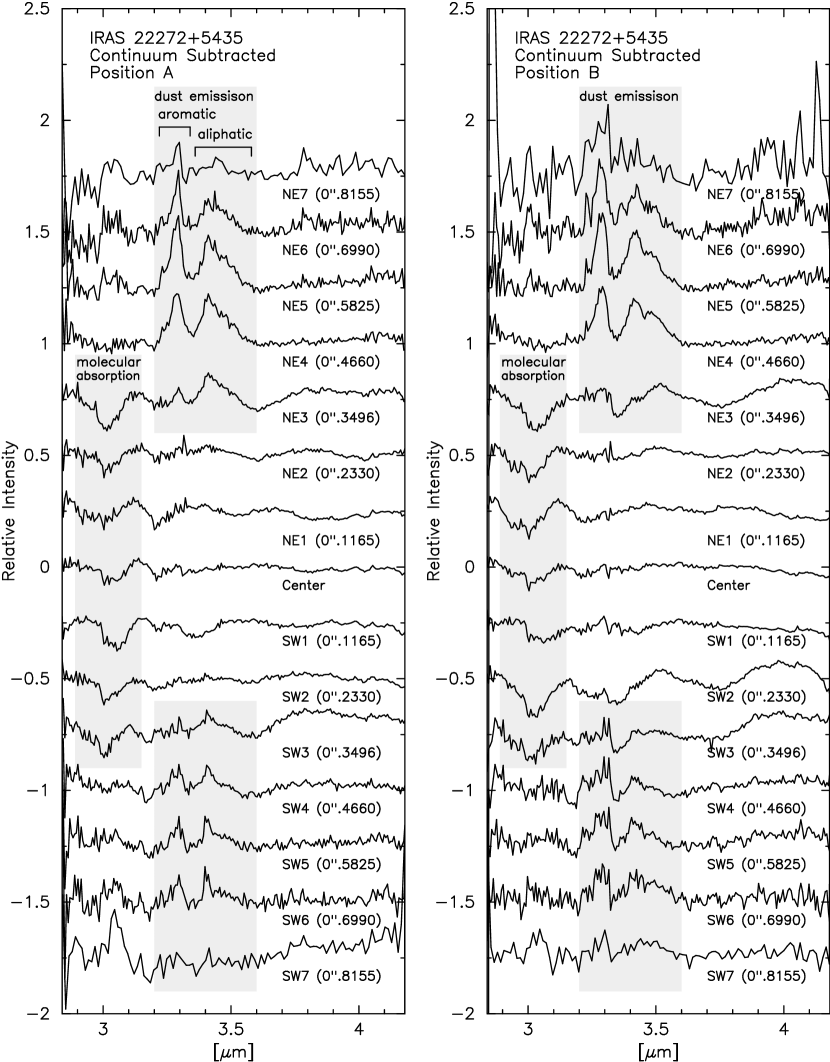
The result is shown in Figure 2 after being normalized to the continuum at 3.5 m. No hydrocarbon emission feature is seen at the position of the central star. Instead we observe absorption bands with the hydrocarbon emission bands becoming evident only at 035 from the central star. The integrated intensity of the hydrocarbon emission bands is consistent with that of 5″ aperture spectroscopy formerly reported by Geballe et al. (1992). The absence of hydrogen recombination lines at 3.74 m (Pf) and 4.05 m (Br) ensures that no H II region has developed at the center of the nebula. The spectrum continuum is approximately represented by a power law. The continuum flux around the central star is most likely the light scattered by large dust grains in the nebula superposed on the halo component of the point-spread function of the central star. The continuum subtracted spectra are shown in Figure 3.
4 Discussion
4.1 Molecular Absorption Features near the Center
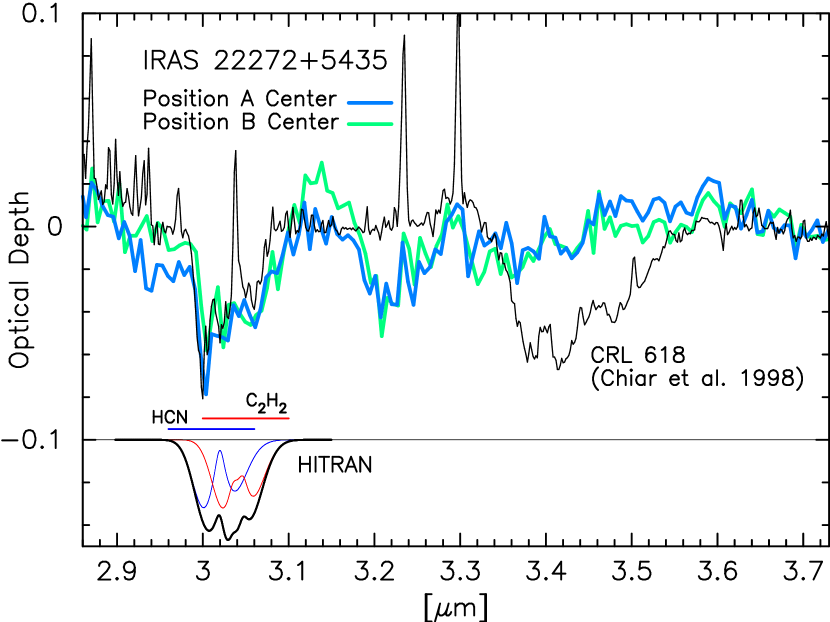
A wealth of absorption features is found in the spectra of IRAS 22272+5435 close to the central star. The carbon atoms consisting of C-H bonds have one of , , or hybridized orbitals, in which triple, double, and single bonds connect the carbon with adjacent atoms. The stretching vibration mode of different C-H bonds shows up as various band structures in the 3 m region. The individual ro-vibrational transition lines are not resolved with the present spectral resolution, and higher resolution spectroscopy will be required to make a solid identification of the absorption lines. The only exception is the absorption bands at 3.0 m, which are identified with the combination of and branches of C-H bonds in C2H2 and HCN. Figure 4 shows the same molecular features in CRL 618 (Chiar et al., 1998) and those computed with the HITRAN database (Rothman et al., 1998).
The molecular absorption features are evident close to the central star, but they disappear abruptly at 047 or 750 AU ( = 1.6 kpc is assumed based on a private communication with Nakashima 2002). The broad emission bands at 3.3 and 3.4 m become strong in turn at 600 AU (Fig. 3). This is the first time that both the hydrocarbon gas and dust are observed in a circumstellar environment in clearly separated locations. It indicates the hydrocarbon molecules are indeed the source of the solid dust material, and that the molecular gas that failed to be involved with the grain formation is being observed near the central star.
4.2 Hydrocarbon Dust Emission at 3.3–3.4 m
The most common IEF in the ISM is the class A type emission ubiquitously observed where the carbon dust is exposed to a hard UV field. The emission carrier has been attributed to aromatic species (Duley & Williams, 1981) such as neutral and ionized polycyclic aromatic hydrocarbons (PAH; Léger & Puget 1984; Allamandola, Tielens, & Barker 1985, 1989 and references therein). The 3.3 m feature matches the ro-vibrational band of the stretching vibration of aromatic C-H bonds. While the class A IEF is observed with hot excitation sources with 20000 K, the central stars of class B sources are typically F–G type supergiants whose effective temperature is = 4500–7000 K. The radiation environment of class B sources is much more benign with less UV photons available. The aromatic molecules absorbs UV-visible photons with a long wavelength cut-off. The larger molecules have a longer cut-off wavelength (Desért, Boulanger, & Puget, 1990; Schutte, Tielens, & Allamandola, 1993). The soft radiation field yet strong emission of class B features implies larger hydrocarbons than those of class A sources are responsible.
What distinguishes class B spectra most clearly from class A IEF is broad and intense emission at 3.4 m. It was once proposed that a hot band of anharmonic oscillation of aromatic C-H bonds is responsible (Barker, Allamandola, & Tielens, 1987). However, the weakness or absence of overtone bands at the 1.6–1.8 m region makes this hypothesis unlikely (Magazzu, & Strazzulla, 1992; Siebenmorgen & Peletier, 1993; Geballe et al., 1994). Instead Schutte, Tielens, & Allamandola (1993) proposed that the aliphatic C-H bonds of superhydrogenated benzene rings account for the 3.4 m emission. Hydrogenated PAH (Hn-PAH) is rich in C-H bonds where the double bonds in the benzene rings are partially saturated by extra attachment of hydrogens. Bernstein, Sandford, & Allamandola (1996) have shown that some Hn-PAH have similar absorption peaks that agree well with 3.4–3.5 m features of a class A source Orion bar. Joblin et al. (1996) argue that the aliphatic C-H bonds, in particular -CH2 in long chains or cyclic aliphatic hydrocarbons, best match the strong 3.42 m features of class B source IRAS 05341+0852.
In the mid-infrared region, IRAS 22272+5435 shows two broad emission features near 8 m and 12 m (Buss et al., 1993), which contrasts with typical class A IEF (Sloan et al., 1999). Allamandola, Hudgins, & Sandford (1999) tried several laboratory compounds of PAH to reproduce IEF of class A and class B sources. They suggested that there is a systematic difference in the character of aromatic species required to fit the IEF in the two different environments. The class A IEF is most closely reproduced by compounds of cations of stable PAH species, while neutral and less stable PAH species are a better match to the broad features of class B sources.
Specific chemical materials have been proposed for the class B IEF carriers by many authors. Those substances are in a more solid form, and laboratory spectroscopy indicates they are rich in hybridized bonds. These are the more common characteristics of amorphous carbons, totally fit in the above modifications required for the conventional aromatic species, namely, larger, more neutral, and more aliphatic materials for class B IEF. The possible carriers presented so far are all successful in reproducing the spectral shape from 3.3 to 3.4 m. These include a mixture of PAH molecules fully reprocessed by energetic hydrogen plasma (Beegle, Wdowiak, & Arnoult, 1997; Arnoult, Wdowiak, & Beegle, 2000), carbon nanoparticles produced by laser pyrolysis of C2H4 and C4H6 (Herlin et al., 1998) or C2H2 (Schnaiter et al., 1999), hydrogenated amorphous carbon prepared by eximer laser ablation of graphite in a hydrogen rich atmosphere (Scott, Duley, & Jahani, 1997; Grishko & Duley, 2000), and quenched carbonaceous composite produced by the plasma deposition technique with CH4 (Sakata et al., 1990; Goto et al., 2000). Semianthracite coal grains (Guillois et al., 1996) are also successful in reproducing the aliphatic band at 3.4 m and substructures in the mid-infrared feature and overall continuum shape. Since there is no unique laboratory analog, we refer the carrier of the class B emission features at 3.3–3.4 m as “hydrocarbon dust” in the following text. The hydrocarbon dust is rich in both aromatic and aliphatic C-H bonds.
4.3 Variations of Aliphatic and Aromatic Abundance
Figure 5 shows the emission feature at 600 to 1300 AU from the central star at the northeast sector of the nebula. The relative intensity of the aliphatic feature at 3.4 m to the aromatic feature at 3.3 m decreases with the distance from the central star. We discuss two processes that could modify the relative abundance of the aliphatics to the aromatics.
First, we examine the formation of the aliphatic C-H bonds on the surface of carbon particles. Mennella et al. (1999) demonstrated that hybridized C-H bonds are newly formed by exposing pure carbon particles to an atomic hydrogen atmosphere. The activated aliphatic band successfully reproduces the 3.4 m absorption feature observed toward the Galactic center. They discuss that the carrier responsible for the 3.4 m absorption ubiquitously observed toward highly reddened objects does not originate in cold dark clouds as has been proposed by Greenberg et al. (1995), but in the diffuse ISM where the destruction of C-H bonds by UV photolysis is equilibrated by rehydrogenation with ample atomic hydrogen (Mennella et al., 2001, 2002). Tielens et al. (1994) proposed a similar mechanism for the formation of aliphatic C-H bonds by hydrogenation of a graphite surface amorphized by the ion bombardment in the interstellar shocks. The process supposedly plays an important role in the production of the 3.4 m absorption feature in the Galactic center sources (Schnaiter et al., 1999). Chiar et al. (1998) proposed that the shocks caused by the fast wind at the last stage of the post-AGB evolution is relevant to the formation of the 3.4 m absorption carriers in CRL 618.
However, the freshly formed aliphatic bands do not match the emission feature we observed. In Figure 6 we compare the emission feature of IRAS 22272+5435 with the absorption features of carbon particles from Mennella et al. (1999), CRL 618 (Chiar et al., 1998) and the Galactic center (Chiar et al., 2000), as well as the laboratory analog of Goto et al. (2000). Indeed, the hydrogenated nano-size carbon particles of Mennella et al. (1999) reproduce the observed absorption band well; the discrepancy with IRAS 22272+5435 is obvious, indicating different carriers. Considering CRL 618 is a PPN more evolved than IRAS 22272+5435 with a compact H II region and a hot B0 star at the center of the nebula, the availability of UV might be critical to producing the particular chemical composition of the absorbing aliphatic hydrocarbons.
The thermal annealing of aliphatic material better fits the observed spectral variation. Figure 5 shows the 3 m spectra of a laboratory analog of hydrocarbon dust subjected to thermal annealing at different temperatures (Goto et al., 2000). The model carbon dust produced by the plasma vapor deposition method of CH4 has rich hybridized C-H bonds when it is deposited. As the annealing temperature becomes hotter in the postprocessing, the substance is dehydrogenated and graphitized. It gradually acquires strong continuum absorption, less prominent spectral features, and weak aliphatic features relative to the aromatic one. The thermal transformation of the aliphatic material is well studied in laboratory experiments with amorphous carbon films (Robertson, 1991; Bounouh et al., 1995). Similar spectral alterations have been also reported with hydrogenated amorphous carbons (Scott & Duley, 1996; Scott, Duley, & Jahani, 1997; Grishko & Duley, 2000; Mennella et al., 1996). The resemblance between the laboratory and the observed spectra indicates a similar process takes place in IRAS 22272+5435.
4.4 Thermal Process
4.4.1 Heat Source
For the thermal annealing of aliphatic material to take place, we need an adequate heat source for the raw material. The chemical composition of the thermally processed material is sensitive to the annealing temperature. The aliphatic to aromatic ratio observed in IRAS 22272+5435 indicates that the hydrocarbon dust has undergone heating to about 760 K (Figure 5).
In the investigation of heating mechanisms, we first assumed the thermal annealing is currently in progress at 1000 AU away from the star, where the hydrocarbon emission is being observed. The equilibrium temperature at 1000 AU is too cool for annealing to happen. Ueta et al. (2001) solved the two-dimensional radiative transfer model to get = 200 K at 800 AU from the star, which is again too cool for the thermal annealing. Shock heating could be an alternative heat source; however, no sign of shock-induced molecular hydrogen emission has been observed in the 2 m spectrum (Hrivnak, Kwok, & Geballe, 1994).
The heating mechanism is not necessarily a thermal equilibrium process. Thermal fluctuation or stochastic heating occurs when the energy of a single incident photon exceeds the total heat capacity of a grain. As no hydrogen recombination lines are detected in IRAS 22272+5435, no photons more energetic than Ly or = 10.2 eV are available. It is found that a grain should be smaller than 6 Å in radius ( 100) to be heated to 760 K by a single Ly photon. We use the empirical specific heat of graphite measured at a low temperature (Touloukian & Buyco, 1970) and the graphite mass density 2200 kg m-3 in estimating the heat capacity. This is very small for a solid particle; however, grains of this size have been considered as a common constituent of reflection nebulae to account for the hot blackbody continuum of about 1000 K (Sellgren, 1984).
Alternatively, as a PPN is a mass-losing object, the observed spatial variation could be interpreted as a record of the history of grain production of the central star. The changing chemical composition at the outer circumstellar shell could represent the temporal transition of hydrocarbon output during the evolution of the PPN. The possible mode-switching in the production of dust has been proposed by Buss et al. (1993); Geballe (1997); Kwok, Volk, & Hrivnak (1999); and Kwok, Volk, & Bernath (2001) to account for the systematic difference of the IEF in PNs and their progenitor PPNs. Thus, the thermal processing is not necessarily a current ongoing event. Actually, the most obvious heat source in the nebula is the central star and the warm circumstellar shell close to it. The particular chemical composition, or a sign of thermal processing, would be acquired when a grain was still in the warm environment near the star. We will call the inhomogeneous chemical composition resulting from the temporal transition of grain formation the “old record” scenario. In the scenario, the thermal processing was completed close to the central star, and is being observed now when the dust grains with varying chemical compositions are blown off to 1000 AU away from the star.
We will consider two heating scenarios in the following discussion, (1) the ongoing stochastic heating of a very small grain, and (2) the old record scenario in which the spatial variation in the chemical compositions originates in the past at the time of grain formation in the warm region near the central star.
4.4.2 Preserving Aliphatic Material
The immediate problem with the stochastic heating scenario is how the aliphatic material could survive through the warmer environment closer to the central star. The physical conditions are more favorable to active thermal annealing there; for instance, at the temperature of carbon condensation, the aliphatic material should be totally graphitized.
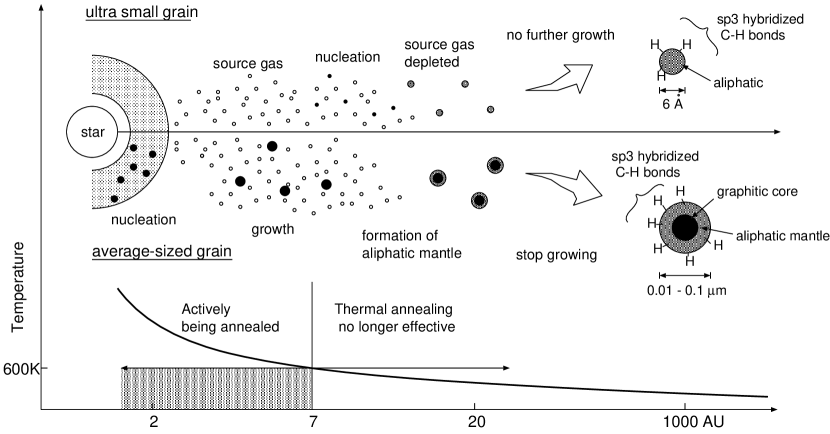
Before discussing the preservation of the aliphatic material, first we consider the location where the ultra-small grains could form. Because of the lack of an efficient destructive mechanism, a grain monotonically grows in the mass-loss wind as it travels through the circumstellar shell (Gail & Sedlmayr, 1988). Thus, a small grain can be formed only at the outer region of the envelope, where the grain growth is very inefficient; otherwise, the final dimension would be too large (Figure 7). Dominik, Gail, & Sedlmayr (1989) found that while most of the grains are nucleated at 1–2 from the star and keep growing until they are as large as 0.01–0.1 m, the population of small grains of carbon content = 100 should not be nucleated at 7 or closer to the central star. The temperature there falls down well below 600 K (Gail & Sedlmayr, 1987). It is cool enough to allow the aliphatic C-H bonds to be preserved.
In the old record scenario, we do not have to assume the grains are ultra-small. Most of the grains are formed in a thin shell near the sonic point 1–2 from the star. The nucleation and growth rates are very high there. However, grain formation is not an instantaneous event. Although the growth rate drops by orders of magnitude, a grain keeps growing even at tens of stellar radii from the star until the source gas is completely depleted or diluted (Dominik, Gail, & Sedlmayr, 1989). This means that the outermost layer of a grain particle is formed in the cool region where thermal processing no longer occurs. Thus, while the inner core formed in the warmer region is already graphitized, the fresh surface of a grain is most likely covered by the aliphatic C-H bonds (Figure 7). The growth of an “amorphous carbon mantle” in the cool (1100 K) mass-loss wind has been discussed by Gail & Sedlmayr (1984).
4.4.3 Mass-Loss History
We have heat sources, and the raw material is ready for the thermal treatment. Our observation shows less processed material inside, and more processed outside. We discuss how the observed spatial variation of hydrocarbon features could possibly be produced.
We start with a gradual annealing of a small grain when it travels outward in the circumstellar shell. The incidence of the Ly photon per grain from a G5Ia central star at the distance of 1000 AU can be predicted using the stellar spectral model of Kurucz (1979). Assuming all photons of 1215Å are converted to Ly and the total luminosity of the central star to be 1.3 (Ueta et al., 2001), the photon rate to a 6 Å particle turns out to be about once in thousands of years. However, it critically depends on the wavelength range we consider. For instance, if we count the photons 1500 Å, the incidence rate jumps up to once in every 5 yr. It drops by an order or two when visible extinction of AV = 1 is applied. At each incidence, a grain cools down in approximately 10-1 s while emitting as a blackbody. As a grain is blown off by roughly 1 AU per year if a 10 km s-1 mass-loss velocity is assumed; the region of our interest, 600–1300 AU from the star, corresponds to 700 yr for a grain to cross. The Ly photon rate ( 1215Å) without extinction does not conflict with the grain traveling time. The higher fraction of the dust particles have experienced more energetic photon incidence in the outer region than in the inner region because they have been soaked in the radiation field longer. Hence, we would see more thermally annealed grains closer to the edge of the nebula. However, we have to be cautious about the coincidence of the timescale. First, we implicitly assumed the effective temperature of the central star does not significantly change during the relevant period of the time, which is not a trivial issue. Second, the reorganization of the carbon frameworks may not finish in an instant, but may take a finite period of time until the aliphatic to aromatic transformation is settled down. When the alteration timescale is longer than the cooling time, a single Ly photon is insufficient to transform the chemical composition of the entire grain. Further discussion on the gradual annealing scenario would be premature until the microscopic processes of thermal annealing, as well as the effect of the evolution of the central star, is fully understood.
A size variation with distance from the star may provide a solution that accounts for the spatial variation in the chemical composition. Suppose that there is a dominant population of small grains farther away from the star; they are more processed than inner ones because a smaller grain reaches higher temperatures when heated with same energy input. Such a size variation with the distance from the star have been often observed in other PPN (e.g., Sahai et al. 1998). As the higher mass loss rate results in the larger grain size (Krüger & Sedlmayr, 1997), the accelerating mass loss at the end of AGB might be relevant to the production of the hypothetical grain size distribution.
On the other hand, in the old record scenario the assumed grain size is large enough to keep grains from thermal fluctuation. Thus, once the grain growth ceases near the star ( 20 ), the chemical composition of the grain surface remains unchanged during the traverse in the mass-loss wind. Then the variation of the spectral feature we observed at 1000 AU from the star simply reflects how the grain surface was composed near the star. If the timescale of grain growth is slow, it may keep growing in the cool region in the outer circumstellar shell, gradually building more aliphatic-rich mantles on the surface. By contrast, if the source gas quickly depletes closer to the star, a grain stops growing earlier in the warm region, and the surface composition remains mainly graphitic. The observed spatial variation implies a history of the gradual switching of these dust formation modes. However, dust formation models available at present are based on the stationary mass-loss wind, which is ineffective for predicting the temporal variation of chemical composition in dust production. The mass-loss rate is very sensitive to the stellar parameter at the end of the AGB phase (e.g., Willson 2000). In particular, in the superwind phase the mass loss shows complicated temporal variation strongly dependent on the initial mass of stars (Wachter et al., 2002; Schröder, Winters, & Sedlmayr, 1999). To fully understand how time-variable mass loss affects the chemical properties of dust, how those dust grains build up a heterogeneous spatial structure around the central star, and how eventually the spectrum of the chemical composition of dust becomes the carbon-rich late-type stars return to the ISM, further theoretical and observational studies are needed.
5 Summary
We presented spatially resolved 3 m spectroscopy of the proto-planetary nebula IRAS 22272+5435 that reveals the different distribution of the hydrocarbon gas and dust. The main conclusions are follows:
1. The acetylene (C2H2) and hydrogen cyanide (HCN) absorption is found in the central star spectrum at 3.0 m. The molecules are highly concentrated in the compact region at the center.
2. The 3.3 and 3.4 m hydrocarbon dust emission is detected at 600–1300 AU from the star. The spatial separation of C2H2 and hydrocarbon dust is observed for the first time, and it reinforces the classical view of the dust formation.
3. We found the relative intensity of the aliphatic feature at 3.4 m to the aromatic feature at 3.3 m decreases with the distance from the star. The spatial variation of the spectral feature is well reproduced in the spectra of a laboratory analog of carbon dust. The thermal process is likely to account for the spectral variation.
4. We suggested the stochastic heating of very small grains ( 6 Å) or the grain surface composition at the end of grain growth would explain the changing aliphatic and aromatic spectral features. In both cases the time-dependent mass-loss profile should be the key to reproducing the spatial variation.
References
- Allamandola, Hudgins, & Sandford (1999) Allamandola, L. J., Hudgins, D. M., & Sandford, S. A. 1999, ApJ, 511, L115
- Allamandola, Tielens, & Barker (1985) Allamandola, L., J., Tielens, A. G. G. M., & Barker 1985, ApJ, 290, L25
- Allamandola, Tielens, & Barker (1989) Allamandola, L., J., Tielens, A. G. G. M., & Barker 1989, ApJS, 71, 733
- Arnoult, Wdowiak, & Beegle (2000) Arnoult, K. M., Wdowiak, T. J., & Beegle, L. W. 2000, ApJ, 535, 815
- Barker, Allamandola, & Tielens (1987) Barker, J. R., Allamandola, L. J., & Tielens, A. G. G. M. 1987, ApJ, 315, L61
- Beegle, Wdowiak, & Arnoult (1997) Beegle, L. W., Wdowiak, T. J., & Arnoult, K. M. 1997, ApJ, 486, L153
- Bernstein, Sandford, & Allamandola (1996) Bernstein, M. P., Sandford, S. A., Allamandola, L. J. 1996, ApJ, 472, L127
- Bounouh et al. (1995) Bounouh, Y., Théye, M. L., Dehbi-Alaoui, A., Matthews, A., & Stoquert, J. P. 1995, Phys. Rev. B, 51, 9597
- Buss et al. (1993) Buss, R. H., Jr., Tielens, A. G. G. M., Cohen, M., Werner, M. W., Bregman, J. D., & Witteborn, F. C. 1993, ApJ, 415, 250
- Chiar et al. (1998) Chiar, J. E., Pendleton, Y. J., Geballe, T. R., & Tielens, A. G. G. M. 1998, ApJ, 507, 281
- Chiar et al. (2000) Chiar, J. E., Tielens, A. G. G. M., Whittet, D. C. B., Schutte, W. A., Boogert, A. C. A., Lutz, D., Van Dishoeck, E. F., & Bernstein, M. P. 2000, ApJ, 537, 749
- Dayal et al. (1998) Dayal, A., Hoffmann, W. F., Bieging, J. H., Hora, J. L., Deutsch, L. K., & Fazio, G. G. 1998, ApJ, 492, 603
- Desért, Boulanger, & Puget (1990) Desért, F.-X., Boulanger, F., & Puget, J. L. 1990, A&A, 237, 215
- Dischler, Bubenzer, & Koidl (1983) Dischler, B., Bubenzer, A., & Koidl, P. 1983, Solid State Comm., 48, No. 2, 105
- Dominik, Gail, & Sedlmayr (1989) Dominik, C., Gail, H.-P., & Sedlmayr, E. 1989, A&A, 223, 227
- Duley & Williams (1981) Duley, W. W., & Williams, D. A. 1981, MNRAS, 196, 269
- Gaessler et al. (2002) Gaessler, W., et al. 2002, Proc. SPIE, 4494, 30
- Gail & Sedlmayr (1984) Gail, H.-P., & Sedlmayr, E. 1984, A&A, 132, 163
- Gail & Sedlmayr (1987) Gail, H.-P., & Sedlmayr, E. 1987, A&A, 171, 197
- Gail & Sedlmayr (1988) Gail, H.-P., & Sedlmayr, E. 1988, A&A, 206, 153
- Geballe (1997) Geballe, T. R. 1997, in ASP Conf. Ser. 122, From Stardust to Planetesimals, ed. Y. J. Pendleton & A. G. G. M. Tielens (San Francisco: ASP), 119
- Geballe et al. (1994) Geballe, T. R., Joblin, C., D’Hendecourt, L. B., Jourdain de Muizon, M., Tielens, A. G. G. M., & Leger, A., 1994, ApJ, 434, L15
- Geballe et al. (1992) Geballe, T. R., Tielens, A. G. G. M., Kwok, S., & Hrivnak, B. J. 1992, ApJ, 398, L89
- Geballe & Van der Veen (1990) Geballe, T. R., & Van der Veen, W. E. C. J. 1990, A&A, 235, L9
- Gledhill et al. (2001) Gledhill, T. M., Chrysostomou, A., Hough, J. H., & Yates, J. A. 2001, MNRAS, 322, 321
- Goto et al. (2002) Goto, M., Kobayashi, N., Terada, H., & Tokunaga, A. T. 2002, ApJ, 572, 276
- Goto et al. (2000) Goto, M., Maihara, T., Terada, H., Kaito, C., Kimura, S., & Wada, S. 2000, A&AS, 141, 149.
- Greenberg et al. (1995) Greenberg, J. M., Li, A., Mendoza-Gómez, C. X., Schutte, W. A., Gerakines, P. A., & De Groot, M. 1995, ApJ, 455, L177
- Grishko & Duley (2000) Grishko, V. I., & Duley, W. W. 2000, ApJ, 543, L85
- Guillois et al. (1996) Guillois, O., Nenner, I., Papoular, R., & Reynaud, C. 1996, ApJ, 464, 810
- Herlin et al. (1998) Herlin, N., Bohn, I., Reynaud, C., Cauchetier, M., Galvez, A., & Rouzaud, J.-N. 1998, A&A, 330, 1127
- Hrivnak, Kwok, & Geballe (1994) Hrivnak, B.J., Kwok, S., & Geballe, T. R. 1994, ApJ, 420, 783
- Joblin et al. (1996) Joblin, C., Tielens, A. G. G. M., Allamandola, L. J., & Geballe, T. R. 1996, ApJ, 458, 610
- Jourdain de Muizon, D’Hendecourt, & Geballe (1990) Jourdain de Muizon, M., D’Hendecourt, L. B., & Geballe, T. R. 1990, A&A, 227, 526
- Kobayashi et al. (2000) Kobayashi, N., et al. 2000, Proc. SPIE, 4008, 1056
- Krüger & Sedlmayr (1997) Krüger, D., & Sedlmayr, E. 1997, A&A, 321, 557
- Kurucz (1979) Kurucz, R. L. 1979, ApJS, 40, 1
- Kwok, Volk, & Hrivnak (1999) Kwok, S., Volk, K., & Hrivnak, B. J. 1999, A&A, 350, L35
- Kwok, Volk, & Bernath (2001) Kwok, S., Volk, K., & Bernath, P. 2001, ApJ, 554, L87
- Kwok, Volk, & Hrivnak (1989) Kwok, S., Volk, K. M., & Hrivnak, B. J. 1989, ApJ, 345, 51
- Leger & Puget (1984) Leger, A., & Puget, J. L. 1984, A&A, 137, L5
- Magazzu, & Strazzulla (1992) Magazzu, A., & Strazzulla, G. 1992, A&A, 263, 281
- Meixner et al. (1997) Meixner, M., Skinner, C. J., Graham, J. R., Keto, E., Jernigan, J. G., & Arens, J. F. 1997, ApJ, 482, 897
- Mennella et al. (1999) Mennella, V., Brucato, J. R., Colangeli, L., & Palumbo, P. 1999, ApJ, 524, L71
- Mennella et al. (2002) Mennella, V., Brucato, J. R., Colangeli, L., & Palumbo, P. 2002, ApJ, 569, 531
- Mennella et al. (1996) Mennella, V., Colangeli, L., Palumbo, P., Rotundi, A., Schutte, W., & Bussoletti, E. 1996, in NASA Conf. Publ. 3343, From Stardust to Planetesimals: Contributed Papers, ed. M. E. Kress, A. G. G. M. Tielens, & Y. J. Pendleton, (Moffet Field, CA: NASA Ames Research Center) 109
- Mennella et al. (2001) Mennella, V., Muñoz Caro, G. M., Ruiterkamp, R., Schutte, W. A., Greenberg, J. M., Brucato, J. R., & Colangeli, L. 2001, A&A, 367, 355
- Moorwood et al. (1996) Moorwood, A. F. M., Lutz, D., Oliva, E., Marconi, A., Netzer, H., Genzel, R., Sturm, E., & de Graauw, T. 1996, A&A, 315, L109
- Robertson (1991) Robertson, J. 1991, Prog. Solid St. Chem., 21, 199
- Rothman et al. (1998) Rothman, L. S., et al. 1998, JQSRT, 60, 665
- Sahai et al. (1998) Sahai, R., Hines, D. C., Kastner, J. H., Weintraub, D. A., Trauger, J. T., Rieke, M. J., Thompson, R. I., & Schneider, G. 1998, ApJ, 429, L163
- Sakata et al. (1990) Sakata, A., Wada, S., Onaka, T., & Tokunaga, A. T. 1990, 353, 543
- Schnaiter et al. (1999) Schnaiter, M., Henning, Th., Mutschke, H., Kohn, B., Ehbrecht, M., & Huisken, F. 1999, ApJ, 519, 687
- Schröder, Winters, & Sedlmayr (1999) Schröder, K.-P., Winters, J. M., & Sedlmayr, E. 1999, A&A, 349, 898
- Schutte, Tielens, & Allamandola (1993) Schutte, W. A., Tielens, A. G. G. M., & Allamandola, L. J. 1993, ApJ, 415, 397
- Scott & Duley (1996) Scott, A. D., & Duley, W. W. 1996, ApJ, 472, L123
- Scott, Duley, & Jahani (1997) Scott, A. D., Duley, W. W., & Jahani, H. R. 1997, ApJ, 490, L175
- Sellgren (1984) Sellgren, K. 1984, ApJ, 277, 623
- Sellgren, Werner, & Dinerstein (1983) Sellgren, K., Werner, M. W., & Dinerstein, H. L. 1983, ApJ, 271, L13
- Siebenmorgen & Peletier (1993) Siebenmorgen, R., & Peletier, R. F. 1993, A&A, 279, L45
- Sloan et al. (1997) Sloan, G. C., Bregman, J. D., Geballe, T. R., Allamandola, L. J., & Woodward, C. E. 1997, ApJ, 474, 735
- Sloan et al. (1999) Sloan, G. C., Hayward, T. L., Allamandola, L. J., Bregman, J. D., Devito, B., & Hudgins, D. M. 1999, ApJ, 513, L65
- Takami et al. (1998) Takami, H., Takato, N., Otsubo, M., Kanzawa, T., Kamata, Y., Nakashima, K., & Iye, M. 1998, Proc. SPIE, 3353, 500
- Tanaka et al. (1996) Tanaka, M., Matsumoto, T., Murakami, H., Kawada, M., Noda, M., & Matsuura, S., 1996, PASJ, 48, L53
- Tielens et al. (1994) Tielens, A. G. G. M., McKee, C. F., Seab, C. G., & Hollenbach, D. J. 1994, ApJ, 431, 321
- Tokunaga (1997) Tokunaga, A. T. 1997, in ASP Conf. Ser. 124, Diffuse Infrared Radiation and the IRTS, ed. H. Okuda, T. Matsumoto, & T. Roellig (San Francisco: ASP), 149
- Tokunaga (2000) Tokunaga, A. T. 2000, in Allen’s Astrophysical Quantities, ed. A. N. Cox (4th ed., New York: Springer), 143
- Tokunaga et al. (1991) Tokunaga, A. T., Sellgren, K., Smith, R. G., Nagata, T., Sakata, A., Nakada, Y. 1991, ApJ, 380, 452
- Tokunaga et al. (1998) Tokunaga, A. T., et al. 1998, Proc. SPIE, 3354, 512
- Touloukian & Buyco (1970) Touloukian, Y. S., & Buyco, E. H. 1970, Thermophysical Properties of Matter, Vol. 5 (New York: Plenum)
- Ueta, Meixner, & Bobrowsky (2000) Ueta, T., Meixner, M., & Bobrowsky, M. 2000, ApJ, 528, 861
- Ueta et al. (2001) Ueta T., et al. 2001, ApJ, 557, 831
- Wachter et al. (2002) Wachter, A., Schröder, K.-P., Winters, J. M., Arndt, T. U., & Sedlmayr, E. 2002, A&A, 384, 452
- Willson (2000) Willson, L. A. 2000, ARA&A, 38, 573