The Interplay of Cluster and Galaxy Evolution
Abstract
We review here the interplay of cluster and galaxy evolution. As a case study, we consider the Butcher–Oemler effect and propose that it is the result of the changing rate of cluster merger events in a hierarchical universe. This case study highlights the need for new catalogs of clusters and groups that possess quantified morphologies. We present such a sample here, namely the Sloan Digital Sky Survey (SDSS) C4 Catalog, which has been objectively–selected from the SDSS spectroscopic galaxy sample. We outline here the C4 algorithm and present first results based on the SDSS Early Data Release, including an X–ray luminosity–velocity dispersion (–) scaling relationship (as a function of cluster morphology), and the density–SFR relation of galaxies within C4 clusters (Gomez et al. 2003). We also discuss the merger of Coma and the NGC4839 group, and its effect on the galaxy populations in these systems. We finish with a brief discussion of a new sample of H–selected galaxies (i.e., k+a, post–starburst galaxies) obtained from the SDSS spectroscopic survey.
In this review, we investigate the interplay of cluster and galaxy evolution. We do so via two case studies: First, the relation between the Butcher–Oemler effect and the changing rate of cluster merger events in a hierarchical universe. Secondly, a study of the distribution of post–starburst galaxies in, the around, the Coma Cluster of Galaxies.
1 Cluster Mergers and the Butcher–Oemler Effect
In a hierarchical universe, clusters of galaxies are formed through the merger of small clusters and groups of galaxies (e.g., Dubinski 1998). Such merger events have a significant effect on the physical nature of the clusters involved, as such events can release a total kinetic energy of ergs111By comparison, supernovae and gamma–ray bursts release ergs of energy. This energy drives shocks through the intra-cluster medium (ICM), heating the gas and generating turbulence. Detailed simulations of major cluster mergers (e.g., mass ratio of 3:1) show that the effect of such events can persist for over 2 Gigayears, with large-scale eddies running through the ICM, up to several hundreds of kpcs in size. Even after a Hubble time, these motions persist as subsonic turbulence in the cluster cores, providing 5 to 10% of the pressure support of the ICM against gravity (see Ricker & Sarazin 2001; Kempner, Sarazin & Ricker 2002; Roettiger, Burns & Loken 1996; Ritchie & Thomas 2001; Schindler et al. 2001).
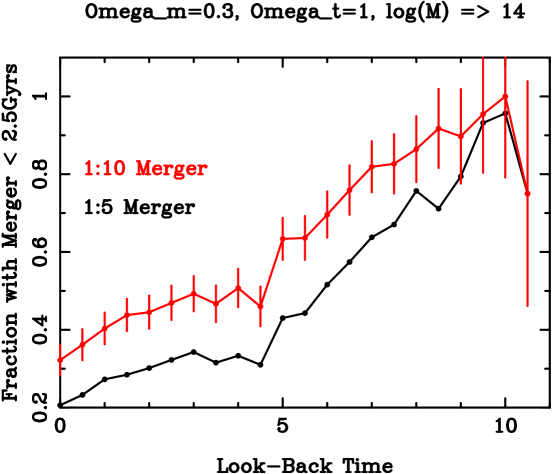
In Figure 1, we present the expected fraction of clusters with () that have experienced a major merger in the last 2.5 Gigayears, as a function of look-back time. This figure demonstrates that as we push to higher redshift, a majority of clusters should show significant evidence of a recent merger which may have severely affected their physical state (see Mathiesen & Evrard 2001). Figure 1 is in qualitative agreement with the recent Chandra observations reported in Henry (2001), in that 75% of clusters show significant substructure. The fraction of local clusters and groups with substructure has yet to be fully quantified (see Mohr, Mathiesen & Evrard 1999).
It is natural to ask the question: What effect do such merger events have on the properties of galaxies within the clusters? Also, could the change in the merger rate (Figure 1) mimic an evolutionary trend? To partially address these questions, we will use the Butcher–Oemler (BO) effect as a case study (see also Poggianti 2002 in this volume).
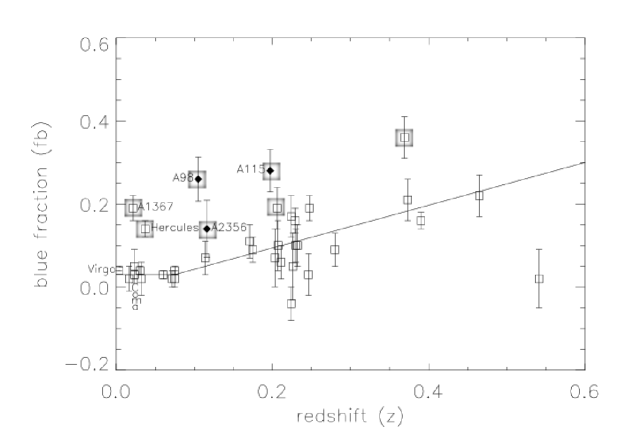
In Figure 2, we show the original BO effect, i.e., the fraction of blue galaxies in clusters () increasing with redshift (Butcher & Oemler 1984). In this figure, we have highlighted clusters with known substructure in the literature, or that have been classified as irregular, which suggests these systems have experienced a recent major interaction (see Metevier et al. 2000; Wang & Ulmer 1997; Wang, Ulmer, & Lavery 1997). In fact, all the high clusters in this figure (and thus in the original BO sample, see also Pimbblet et al. 2002) appear to be merger events; a fact noted by Butcher and Oemler themselves. Therefore, could the evolutionary trend of increasing with redshift (seen in Figure 2) be primarily due to the increased fraction of disturbed clusters with redshift, as seen Figure 1? For example, the skewness of the distribution could be increasing with redshift, as more clusters populate the high tail of the distribution. Kron (1993) raised similar concerns regarding the possible role of selection effects in producing the BO effect, while Kauffmann (1995) also proposed that the BO effect was a natural consequence of hierarchical structure formation.

To fully test this hypothesis would require a larger, more systematic, study which must begin with an objective sample of clusters that possess well-determined physical properties i.e., mass, dynamical state and local environment. Such work has already begun with X–ray samples of clusters, e.g., Wake et al. (in prep) have systematically studied the blue fraction of galaxies in sixteen, intermediate redshift clusters, and find no correlation of with X–ray luminosity or redshift (see also Fairley et al. 2002, Metevier et al. 2000; Smail et al. 1998; Andreon & Ettori 1999). Secondly, Goto et al. (2003a) is studying the BO effect in optical clusters objectively selected from the Sloan Digital Sky Survey (SDSS) photometric data (see Goto et al. 2002), while we will discuss below a new sample of clusters objectively–selected from the SDSS spectroscopic survey.
We have purposely focused on the BO effect here, at the expense of recent morphological and spectroscopic studies of clusters (e.g., CNOC & MORPHS work). We refer the reader to the review article of Poggianti (this volume) and Ellingson et al. (2001) for discussion of this work. Furthermore, we have ignored other explanations for the BO effect (both real and systematic).
2 The SDSS C4 Catalog
The Sloan Digital Sky Survey (SDSS) is underway (see Stoughton et al. 2002 and http://www.sdss.org). As of December 2002, the SDSS has obtained of the spectra it plans to obtain (corresponding to galaxy redshifts). When combined with the SDSS multi–color photometry, this dataset is ideal for objectively finding clusters and groups of galaxies in three–dimensions.
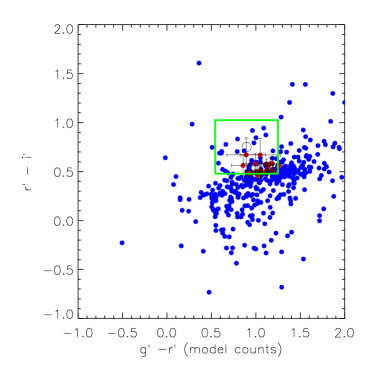
In Miller et al. (in prep), we outline the C4 algorithm of finding clusters and groups in the SDSS spectroscopic data (see also Nichol et al. 2001 & Gomez et al. 2003). Briefly, the fundamental premise of the C4 algorithm is that galaxies in the cores of clusters are a co–evolving population and thus have the same spectral energy distributions (same colors). Therefore, we perform a search for clusters of galaxies simultaneously in both redshift–space and color–space. This involves counting the number of nearest neighbors in a 7–dimensional box (3 spatial and 4 color coordinates) placed around each galaxy in our sample. The size of the box is determined by the observed errors on the color of the target galaxy, and the observed scatter in the color–magnitude relation of ellipticals in clusters. In Miller et al. (in prep), we demonstrate that the clusters selected using this technique are relatively insensitive to the details of the algorithm (e.g., box size). The power of the C4 approach is that galaxies only sparsely populate the 7–dimensional space considered here, and therefore, any observed clustering in this high dimensional space is statistically significant, see Figure 3. The C4 algorithm is similar to the work of Gladders & Yee (2000) and Goto et al. (2002), but with one key difference; these other techniques model the expected colors of cluster galaxies, as a function of redshift, while the C4 algorithm is model–independent and only requires a clustering in color–space, rather than a specific color.
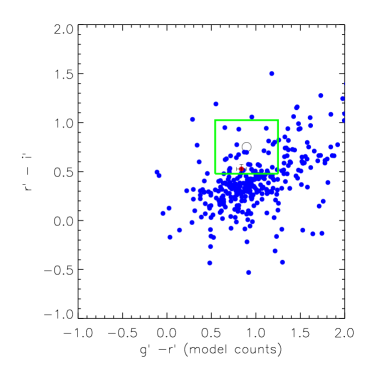
Once we have counted the number of nearest neighbors, we used the False Discovery Rate (FDR; Miller et al. 2001) to determine which galaxies have an unusual number of nearest neighbors in the 7–dimensional box, i.e., live in clusters. This thresholding scheme removes 80% of all galaxies, preferentially those in low–density regions (see Figure 4). Next, these remaining galaxies are clustered using a density estimator and cluster candidates selected. Once we have a list of candidates, we then measure a variety of physical parameters, including the velocity dispersion, total optical luminosity and the existence of any nearby companion. We also use the ROSAT All-Sky Survey data to estimate the X–ray luminosity of each cluster. Details of the C4 algorithm, including extensive tests of the completeness and purity of the catalog, can be found in Miller et al. (in prep).
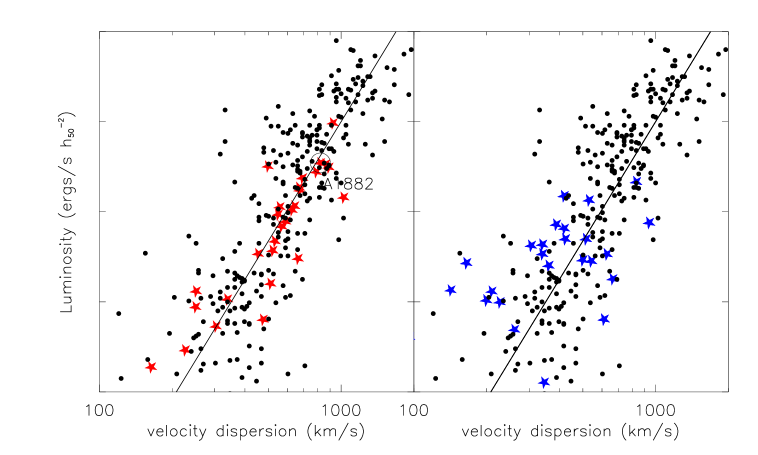
In Figure 5, we present first results from running the C4 algorithm on the SDSS Early Data Release (EDR; Stoughton et al. 2002). We show the relation between X–ray luminosity and velocity dispersion for EDR clusters, as a function of their morphology. The cluster morphology is based on the number of peaks detected in the velocity distribution of each cluster. As one can see, isolated clusters have a tight – relation; about a factor of 5 tighter than previous observations (Mahdavi & Geller 2001) or EDR clusters with a complex morphology (see also Smith et al. 2002).
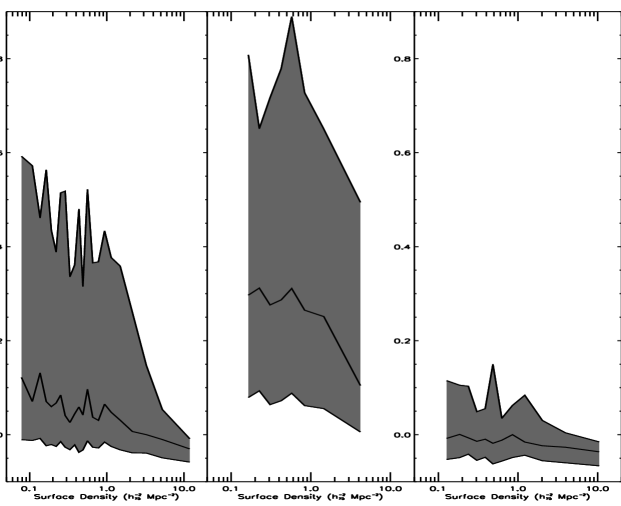
We have begun studying galaxy evolution in SDSS C4 clusters, e.g., in Figure 6, we show the density–star formation rate (SFR) relation recently discussed in Gomez et al. (2003). This work shows a clear “break” in the density–SFR relation of galaxies at a density of (see also Kodama et al. 2001; Lewis et al. 2002). At densities greater than this (which corresponds to cluster regions within virial radii), the SFR of galaxies decreases rapidly. Below this critical density, the SFR of galaxies appears to be uncorrelated with density. In Gomez et al. (2003), we attempted to determine if the density–SFR relation is degenerate with the density–morphology relation (see Dressler et al. 1997). As shown in Figure 6, there is some evidence that these two relations are independent, and all morphological types experience a density–SFR relation (see Balogh et al. 1998; Poggianti et al. 1999). This will require further study, but this work does illustrate the power of the SDSS data and, in the near future, we will investigate the density–SFR–morphology relation over a range of C4 clusters. We plan to study the BO effect in C4 clusters, as a function of cluster morphology and luminosity, for spectroscopically confirmed galaxy members.
3 Coma Cluster and Post–Starburst Galaxies
The Coma Cluster is under–going a major merger event with a satellite group centered on NGC4839 (mass ratio of 3:1; see Neumann et al 2001). Due to the low redshift of Coma, it is ideal for studying the interplay of such an event with the properties of galaxies in the main cluster and the group. In fact, the most striking evidence yet for any interplay between a cluster merger and galaxy evolution, was the apparent discovery of an excess of post–starburst galaxies (galaxies with the signature of a recent burst of star–formation) along the filament of galaxies joining the core of Coma with the NGC4839 group (see Caldwell & Rose 1997; Burns et al. 1994). However, Castander et al. (2001) recently presented the first hour of extragalactic observations of the SDSS spectroscopic survey and obtained spectra for 196 Coma galaxies out to the virial radius of Coma (1.5 degrees). These observations covered the southern part of the cluster, including the NGC4839 group. Castander et al. discovered several H–strong galaxies, indicative of post–starburst (or k+a) galaxies, but found no evidence that galaxy star–formation (both past and present) was at all correlated with the existence of a merging group; see Figure 3 in Castander et al. (2001), as well as Carter et al. (2002). Alternatively, the SDSS Coma spectral data are consistent with simple galaxy in–fall as in Gomez et al. (2003), i.e., as galaxies in–fall into a cluster, their star–formation is slowly truncated (see Figure 6). The lack of an obvious connection between the merger in Coma and the galaxy populations may be because the NGC4839 group is still in–falling, and has yet to pass through the core of Coma (see Neumann et al. 2001).
We take this opportunity to briefly mention a new sample of H–selected galaxies (i.e., post–starburst, k+a) by Goto et al. (2003b). They have found 3340 such galaxies in the SDSS spectroscopic sample, which is two orders of magnitude greater than any other local sample of H galaxies. Due to page constraints, we will presents results from this work elsewhere.
4 Summary
Using two case studies (Coma and the BO effect), we have examined the interplay between cluster and galaxy evolution. It is clear from this brief study that both major mergers and galaxy in–fall are important mechanisms for explaining galaxy evolution in dense environments. As one goes to higher redshifts, the relative importance of these two mechanisms may change and therefore, it is imperative that we are careful about the selection of clusters used in such studies. Larger, more homogeneous samples of clusters (e.g. from XMM and SDSS), with quantified properties (mass, luminosity, morphology) are important. Such samples will allow us to robustly investigate the relation between cluster parameters and the galaxy populations in those clusters222Kauffmann (1995) notes that one must account for cluster evolution when comparing low redshift clusters with higher redshift systems, as the density of massive clusters is evolving with redshift..
Acknowledgements.
We thank our collaborators; Michael Balogh, Ann Zabludoff, Percy Gomez, Gus Evrard, Risa Wechsler, Tim Mckay and our SDSS colleagues. We thank Ian Smail, Michael Balogh and Kathy Romer for reading an earlier draft of this review. RCN thanks Catarina Lobo and Pedro Viana for their hospitality which made his stay in Portugal so much fun. Finally, RCN acknowledge partial funding from the conveners of the ”Galaxy evolution” workshop through project ref. PESO/PRO/15130/1999 from FCT/ Portugal.References
- [Andreon & Ettori(1999)] Andreon, S. & Ettori, S. 1999, ApJ, 516, 647
- [Balogh et al.(1998)] Balogh, M. L., et al., 1998, ApJL, 504, L75
- [Butcher & Oemler(1984)] Butcher, H. & Oemler, A. 1984, ApJ, 285, 426
- [Burns, Roettiger, Ledlow, & Klypin(1994)] Burns, J. O., Roettiger, K., Ledlow, M., & Klypin, A. 1994, ApJL, 427, L87
- [Caldwell & Rose(1997)] Caldwell, N. & Rose, J. A. 1997, AJ, 113, 492
- [Carter et al.(2002)] Carter, D. et al. 2002, ApJ, 567, 772
- [Castander et al.(2001)] Castander, F. J. et al. 2001, AJ, 121, 2331
- [cohn] Cohn, J. D., Bagla, J. S., & White, M. 2001, MNRAS, 325, 1053
- [Dressler et al.(1997)] Dressler, A. et al. 1997, ApJ, 490, 577
- [Dubinski(1998)] Dubinski, J. 1998, ApJ, 502, 141
- [Ellingson, Lin, Yee, & Carlberg(2001)] Ellingson, E., Lin, H., Yee, H. K. C., & Carlberg, R. G. 2001, ApJ, 547, 609
- [Fairley et al.(2002)] Fairley, B. W., et al., 2002, MNRAS, 330, 755
- [Gladders & Yee(2000)] Gladders, M. D. & Yee, H. K. C. 2000, AJ, 120, 2148
- [ggg] Gomez, P., et al. AJ, in press (see astro-ph/0301024)
- [Goto et al.(2002)] Goto, T. et al. 2002, AJ, 123, 1807
- [Goto et al.(2003)] Goto, T. et al. 2003a, PASJ, submitted
- [Goto et al.(2003)] Goto, T. et al. 2003b, PASJ, submitted
- [H] Henry, J. P., 2001, astro-ph/0109498
- [K95] Kauffmann, G. 1995, MNRAS, 274, 153
- [Kempner, Sarazin, & Ricker(2002)] Kempner, J. C., Sarazin, C. L., & Ricker, P. M. 2002, ApJ, 579, 236
- [hsh] Kodama, et al. 2001, ApJL, 562, 9
- [K93] Kron, R., 1993, “The Deep Universe”, Saas-Fee Advanced Course 23, Springer
- [Lewis et al.(2002)] Lewis, I. et al. 2002, MNRAS, 334, 673
- [Mahdavi & Geller(2001)] Mahdavi, A. & Geller, M. J. 2001, ApJL, 554, L129
- [Math] Mathiesen, B. F. & Evrard, A. E. 2001, ApJ, 546, 100
- [Metevier, Romer, & Ulmer(2000)] Metevier, A. J., Romer, A. K., & Ulmer, M. P. 2000, AJ, 119, 1090
- [Miller et al.(2001)] Miller, C. J. et al. 2001, AJ, 122, 3492
- [Mohr, Mathiesen, & Evrard(1999)] Mohr,J. J., Mathiesen, B., & Evrard, A. E. 1999, ApJ, 517, 627
- [Neumann et al.(2001)] Neumann, D. M. et al. 2001, A&A, 365, L74
- [Nichol et al.(2001)] Nichol, R. C. et al. 2001, Mining the Sky, 613
- [pp] Pimbblet, K.A., et al., 2002, MNRAS, 331, 333
- [Poggianti et al.(1999)] Poggianti, B. M., et al., 1999, ApJ, 518, 576
- [P95] Poggianti, B. M., 2002, this volume (see astro-ph/0210233)
- [Ricker & Sarazin(2001)] Ricker, P. M. & Sarazin, C. L. 2001, ApJ, 561, 621
- [K95] Ritchie, B. W., Thomas, P. E., MNRAS, see astro-ph/0107374
- [K95] Roettiger, K., Burns, J. O., & Loken, C. 1996, ApJ, 473, 651
- [K95] Schindler, S., 2001, see astro-ph/0107008
- [Smail, Edge, Ellis, & Blandford(1998)] Smail, I., Edge, A. C., Ellis, R. S., & Blandford, R. D. 1998, MNRAS, 293, 124
- [Smith] Smith, G. P., et al., 2002, ApJL, submitted (astro-ph/0211186)
- [Stoughton et al.(2002)] Stoughton, C. et al. 2002, AJ, 123, 485
- [Wang, Ulmer, & Lavery(1997)] Wang, Q. D., Ulmer, M. P., & Lavery, R. J. 1997, MNRAS, 288, 702
- [Wang & Ulmer(1997)] Wang, Q. D. & Ulmer, M. P. 1997, MNRAS, 292, 920
- [Zabludoff et al.(1996)] Zabludoff, A. I., et al., 1996, ApJ, 466, 104