On the Selection of Photometric Planetary Transits
Abstract
We present a new method for differentiating between planetary transits and eclipsing binaries based on the presence of the ellipsoidal light variations. These variations can be used to detect stellar secondaries with masses orbiting sun-like stars at a photometric accuracy level which has already been achieved in transit surveys. By removing candidates exhibiting this effect it is possible to greatly reduce the number of objects requiring spectroscopic follow up with large telescopes. Unlike the usual candidate selection method, which are primarily based on the estimated radius of the orbiting object, this technique is not biased against bona-fide planets and brown dwarfs with large radii, because the amplitude of the effect depends on the transiting object’s mass and orbital distance. In many binary systems, where a candidate planetary transit is actually due to the partial eclipse of two normal stars, the presence of flux variations due to the gravity darkening effect will show the true nature of these systems.
We show that many of the recent OGLE-III photometric transit candidates exhibit the presence of significant variations in their light curves and are likely to be due to stellar secondaries. We find that the light curves of white dwarf transits will generally not mimic those of small planets because of significant gravitationally induced flux variations.
We discuss the relative merits of methods used to detect transit candidates which are due to stellar blends rather than planets. We outline how photometric observations taken in two bands can be used to detect the presence of stellar blends.
Subject headings:
stars: low-mass – binaries: eclipsing – planetary systems1. Introduction
In recent years the discoveries of large numbers of planets via high precession radial velocity studies (Marcy & Bulter 2000) has fostered a surge of activity aimed at the discovery of low mass companions to nearby stars. However, with the radial velocity technique alone it is not possible to uniquely determine the mass of a planetary candidate since the orbital inclination () is poorly determined. The uncertainty in leads to a degeneracy in the mass of the orbiting object. In contrast, planetary transit searches measure light curves which put strong constraints on the inclinations of the planetary orbits. This information can be combined with radial velocity measurements to determine a transiting object’s mass and mean density. Furthermore, once a transiting planet or brown dwarf has been confirmed by radial velocity measurements, additional high accuracy spectral and photometric observations make it possible to detect the presence of specific chemical elements in a transiting planet’s atmosphere (Seager & Sasselov 2000, Brown 2001, Charbonneau et al. 2002).
The radial velocity survey based discovery of a planetary companion to HD 209458 and the subsequent discovery of a planetary transit (Henry et al. 2000, Charbonneau et al. 2000, Mazeh et al. 2000) has led to a great deal of interest in the detection of extra-solar planets via photometric transits. The planetary object, HD 209458b, has a mass of 0.69MJ, a radius of 1.35RJ, and an orbital distance of 0.047AU (Cody & Sasselov 2002). A number of other extra-solar planets have been discovered with small separations from their parent stars in radial velocity surveys (51-Peg-b, -Boo-b, HD 187123b, etc.), but no photometric transits have been observed for these.
Within the last year planetary transit candidates have been discovered in the data from the OLGE-III (Udalski et al. 2002a,b) and the EXPLORE (Mallén-Ornelas et al. 2002) projects as well as the Vulcan campaign (Jenkins et al. 2002). However, when considering whether a photometric transit is due to a planet or a small star, such as a late M-dwarf, it is necessary to know the mass of the transiting object. This mass can be determined with radial velocity measurements by using large telescopes with high resolution spectrographs (such as VLT or Keck). However, the determination of the mass of a single object may require a number of observations taken on multiple nights. As there are currently more than 60 planetary transit candidates and many hundreds more expected from space missions and other searches, it will soon be impractical to measure the radial velocity profiles of all candidates.
A method of selecting planetary transit candidates has been put forward by Seager & Mallén-Ornelas (2002). Among other things, this selection favors planets that have circular orbits, unblended parent stars and produce flat bottomed eclipse shapes. However, it is clear that any of these criteria may be restrictive against bona-fide planet transits. Circular orbits seem probable for transiting planets since they are strongly influenced by gravitational tidal forces due to their close proximity to their parent stars. However, this may not always be true since significant eccentricity has been observed among the planets found in radial velocity surveys (Udry et al. 2002). The second selection criteria can also fail to produce all good candidates because in some cases (such as OGLE-III) dense stellar fields are monitored to maximize the planet detection efficiency. Furthermore, many blends are likely to occur because of multiple star systems (Mallén-Ornelas et al. 2002). The selection of flat bottomed light curves excludes planets transiting near stellar limbs. These may not exhibit any flat regions whatsoever. Although the number of transits expected at these inclinations is generally small, the exact fraction of limb transits is strongly dependent on the as-yet-unknown sizes of tightly orbiting planets. Furthermore, the effect of limb darkening is strong in photometric bands blueward of I-band. Thus, a large fraction of bona-fide planets may not exhibit flat bottomed eclipses. The effect of limb darkening on the shape of planetary transits is clear from the HST data of planetary transit HD 209458 (Brown et al. 2001).
The selection of good planetary candidates can be improved if one knows the size of the parent star . This can be estimated with some accuracy by determining the spectral type of the parent star. Since the fractional drop in flux during the eclipse, , is related to the stellar and planetary radii by,
| (1) |
a determination of the candidate planet’s radius can be obtained. However, limb darkening changes the measured by a small amount which depends on the stellar type and the passband used.
The evolutionary theory of isolated planets by Baraffe et al. (1998, 2002) predicts that evolved extra-solar planets should have radii similar to that of Jupiter. Dreizler et al. (2002) used these models to select the best transit candidates from Udalski et al. (2002a,b), for follow-up with radial velocity measurements based on their sizes. However, currently there are little empirical data about the actual radii of gaseous planets at small separations from stars. For example, presently the only extra-solar planet with a measured radius is HD 209458b and as Dreizler et al. (2002) conceded, their adopted model is inconsistent with HD 209458b. It would seem that evolutionary models of isolated planets are poor representations of real planets. The giant extra-solar planet models of Burrows et al. (2000), Bodenheimer et al. (2001) and Guillot & Showman (2002) suggest that large extra-solar planets can exist at small distances from main-sequence stars. Guillot & Showman (2002) point out that, if only 1% of the flux incident on HD 209458b from its parent star was transformed to kinetic energy in the planetary atmosphere, a planet can maintain its size. In such models the incident radiation suppresses the typical energy loss by radiative diffusion and hence the contraction of such planets. As many planets have been found at small distances from their host stars in radial velocity surveys, it seems that gaseous planets at small orbits could have larger radii than HD 209458b. Furthermore, it seems possible that transiting brown dwarfs may also have large radii. In light of the current level of uncertainty about the radii of extra-solar planets and brown dwarfs in tight orbits, it would be useful to select candidates based on tracers for the transiting objects’ masses as well as their sizes. One tracer for the mass of the transiting companion in tight binary systems is the presence of gravity darkening effects in eclipsing binary light curves.
In the next section we outline the nature of the ellipsoidal variations observed in binary light curves due to gravity darkening. In §3, we show how the effect can be used to select bona-fide planet/brown dwarf candidates. In §4, we test some public photometric transit data for the presence of the gravity darkening effect. Following this in §5, we discuss the problems with planetary transit selection due to photometric blending. A partial solution to the blending problem will be discussed in §6, followed by concluding remarks.
2. Gravity darkening
When two stars exist in a tight orbit, their gravitational potential stretches the envelopes of the stars into ellipsoids (von Zeipel 1924). These distortions leads to sinusoidal modulations of the kind observed in the light curves of stars such as W UMa binary systems (Kitamura & Nakamura 1988). When these binary systems rotate their brightnesses vary depending on the observed luminosity and cross section of the stars. The temperature of the surface elements is seen to act in proportion to the effective gravity, such that
| (2) |
It is clear that the extent of the gravity darkening effect observed depends on the exponent . This parameter varies strongly between radiative stars (where it is 1) and convective stars (where it is typically around 0.25). The exact value of varies with the stellar mass and has been modeled for a range of stellar parameters by Alencar & Vaz (1997) and Claret (1998, 2000). However, there is only a small amount of empirical data available, such as Rafert & Twigg (1980).
The sinusoidal modulation due to ellipsoidal geometry of the stars in a binary system varies at twice the orbital frequency. Since the distortion of the primary is independent of whether or not the secondary is luminous, it is an ideal tracer for an unseen massive companion to a luminous star (Beech 1985). Furthermore, when both stars have similar luminosities the reflection effect can also be observed in the light curves. The ellipsoidal effect can be observed in binary systems even if an eclipse is not observed, because the ellipsoidal effect can be observed over a larger range of orbital inclinations than a transit. In the next section, we will show that, although accurate values of are yet to be determined empirically for many stellar types, even the slightest signal of a modulation can point to a secondary object with a significant mass.
3. Selecting planetary candidates
Typical planetary transits are expected to last a few hours for orbital periods of a few days. These dips in flux during the transit will be . Therefore, the detection of a planet transit requires a well sampled light curves with high accuracy data. Transit detections can be made by either making frequent observations of candidate stars (dedicated transit surveys), or by folding light curves and searching for significant periods in data taken less frequently over a longer time (such as microlensing surveys). Because planet transits are short, roughly 95% of the photometry points taken in a survey will occur outside the transit region for any given light curve. These measurements are of little use to the determination of a planet’s size or shape. However, these data make it possible to measure variations in the baseline of the light curve to much greater accuracy than the transit depth.
The OGLE-III transit search data set consists of 800 photometry points (Udalski et al. 2002a,b) with an accuracy of better than 1.5%. A simple Poisson argument would suggest that at a 3 sigma level, a modulation amplitude of magnitudes should be measurable. For the Explore-I project the best candidates () have 1600 photometry points with better than 0.5% photometry. In this case, we expect that a variation should be detectable at the level of magnitudes. However, in reality it is likely that there are systematic contributions to the uncertainty in the photometry points. Systematic errors can occur due to observations of a field being taken nightly at a similar airmass range. The observed scatter will not behave in a Poissonian way, so the actual measured baseline uncertainties will always exceed this limit. Indeed, many of the transit light curves presented by the OGLE-III project appear to exhibit time dependent fluctuations which are either due to systematic noise contributions or real variability of the parent stars.

In Figure 1 we present the modulation amplitudes expected due to the gravity darkening effect. These values have been determined using the Nightfall111See http://www.lsw.uni-heidelberg.de/rwichman/Nightfall.html for details eclipsing binary analysis program. This program can be used to model and fit the shapes of eclipsing binary light curves, line profiles and radial velocities, and includes effects such as limb darkening, star spots, reflections and third light . The values for the gravity darkening exponent are taken from the non-grey models of Alencar & Vaz (1997). For the curves in this particular example we have taken an orbital period of 2 days. This is consistent with a large number of the OGLE-III candidates. We expect that the spectral types of primary stars will generally be within the range of types shown on Figure 1. For example, the OGLE-III candidates measured by Dreizler et al. (2002) have spectral types ranging from A3 V to K4 V. Stars with spectral types later than K5 V are very faint and are, therefore, difficult to photometer accurately, while types earlier than A5 V (and giant types) will only have small planetary transit signals due to their sizes.
Current planetary transit surveys are attempting to find planets and brown dwarfs with masses in the range . From Figure 1 we see that (for most types of primary stars), the detection of modulations greater than mmag in amplitude is sufficient to reject candidates for orbital periods longer than 2 days. For larger orbital periods, the separations of the stars and candidate planets are greater and the gravity induced modulations are smaller. Thus, the presence of measurable modulations at longer periods provides even stronger evidence that transiting objects have significant masses. For the most accurately measured stars it may be possible to limit the secondary’s mass to within the brown dwarf mass range using photometry alone. This will be very useful for reducing the number of possible planetary candidates in space missions such as Kepler.
The transits of giant-type stars by main-sequence stars can be distinguished from those of planets eclipsing main-sequence stars, by using the parent star’s stellar density derived from the transit parameters (Seager & Mallén-Ornelas 2002). These stars can also be distinguished with spectra or multi-band photometry (Bessell & Brett 1988). Furthermore, the ellipsoidal effect is larger for giant stars than main-sequence stars since they are more readily distorted due to their low surface gravities.
If a candidate planetary transit is due to the partial eclipse of two normal stars, the observed gravity darkening effect may be large even though the observed eclipse may be very small. In some cases an observed ellipsoidal effect could also be due to the presence of additional massive object which is not the transiting object. Such a third object would have an orbital period different from that of the transiting object and thus would appear as a source of correlated noise in the phased transit light curve. In other cases a transit light curve may exhibit sinusoidal modulations due to effects other than the ellipsoidal effect. For instance, one can imagine cases where an observed modulation was due to the concentrations of star spots on one hemisphere of a star. However, this is unlikely to properly mimic the gravity darkening effect since this would require that the rotational period of the star was exactly twice the orbital period of a planet. Furthermore, the number and distribution of spots is likely to change over time.
Because there is some uncertainty in the value of , the exact amplitudes presented in Figure 1 are also quite uncertain. In any case, it seems prudent to reject candidate planetary transits exhibiting sinusoidal modulations whether they are due to a massive transiting object or some other phenomena.
4. Examination of the OGLE-III data
To test whether the ellipsoidal effect can really be used to select planetary transit candidates we retrieved the freely distributed OGLE-III transit data from the OGLE-III archive222ftp://bulge.princeton.edu/ogle/ogle3/transits. We phased these light curves with the most recently derived periods which are given on the OGLE-III web site333http://bulge.princeton.edu/ogle. Of the OGLE-III transit candidates, numbers 43 to 46 do not have known periods so could not be phased. On examination of the transit candidate OGLE-TR-39 we found it to have, not only a strong sinusoidal modulation but additional features visible at a period of 2.44565 days (three times the OGLE-III period). The presence of this additional signal would invalidate any sinusoidal fit, so we did not analyze this candidate. For each of the remaining set of light curves we subtracted the data during the period of the transit. Simply fitting the data with the inclusion of the transit dip would clearly bias the results toward higher values. In the absence of any ellipsoidal or other systematic effects, the data outside the transit region should be constant.
Many of the OGLE-III transit light curves show the clear signs of systematic trends with time. The exact origins of these features are unknown. However, such features are common in the photometry of crowded fields with large cameras. These occur because of blending between neighbouring stars, flat fielding errors, inaccurate airmass corrections, changes in transmission (due to atmospheric dust), etc. To obtain a reliable estimate of whether the effect of gravity is significant in any light curve, it is necessary to have a good estimate of the photometric scatter. In this analysis we attempted to determine the significance of the ellipsoidal variations in the presence of the real systematic noise. To do this, firstly, we fitted the phased light curves with the ellipsoidal modulation approximated by plus a constant (where is the gravity darkening amplitude). We note that Beech (1985) and others have shown that, although additional sinusoidal terms exist, they are small in comparison to the term. The initial fits resulted in large values and very significant sinusoidal amplitudes because of the underestimated uncertainties in the data points. Next, we subtracted the fitted values from the data to remove the gravity darkening trend. Based on a Gaussian uncertainty model, we determined the time averaged uncertainty in the residuals for each light curve. We scaled the error bars to match the observed scatter and determined the parameter uncertainties in the fit terms. In many cases the fit value remained high because of real variability structure within the light curves. As an additional test of the significance of the gravity darkening term we perform an F-distribution test for the significance of this extra parameter. That is, we compared the fit value for a constant baseline with the value for a constant term plus sinusoid. The F-test statistic is given by
| (3) |
where is the reduced chi-square value of the fit with the extra term. This statistic obeys the F-distribution for and ( points, parameters) degrees of freedom. An F-distribution value larger than 6.668 (for 750 data points) is expected in only 1% of experiments and larger than 10.91 for 0.1%. The larger this value the more significant the decease in the fit is with the additional term. In Table 1 we present the fit values for the OGLE-III transit candidates with amplitudes, , greater than zero at a 3.5 sigma level and F-statistic values greater than 6.668. We believe that these transit candidates are the most likely to have stellar mass secondaries.
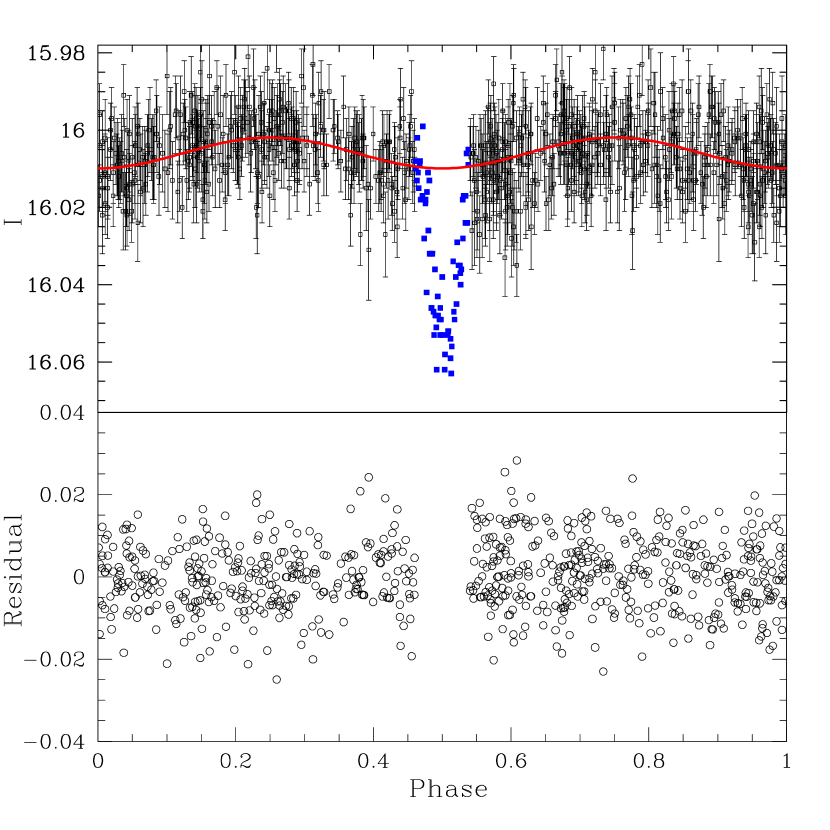
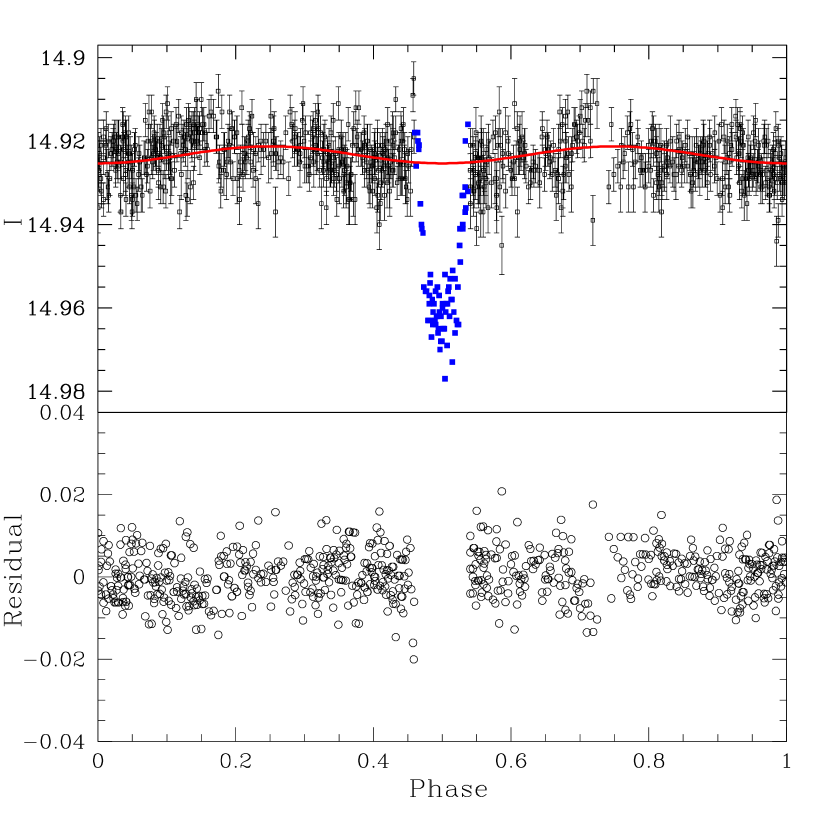
We note that the planetary transit candidate OGLE-TR-3 was selected by Dreizler et al. (2002) from the OGLE-III candidates as a likely planetary transit. This object exhibits a sinusoidal modulation at the level. The light curve also appears to exhibit the presence of a second dip in the phased light curve, although this dip is not very significant (). The presence of a second dip in a binary light curve is the clear sign that transiting object is luminous. In Figure 2 we present the fits to two of the OGLE-III planetary transit candidates, OGLE-TR-18 and OGLE-TR-30. The presence of a sinusoidal modulation is clearly seen in these light curves.
5. Blending
A common type of contaminant in searches for planetary transits are cases where an ordinary eclipsing binary star is blended with one or more additional stars. The light curves of these candidates exhibit a dip in flux where one of the stars is eclipsed. This may mimic a planetary transit as only a small dip in the group flux is observed. The additional flux from the blended stars causes the size of eclipsed object to be underestimated from the light curve. As an example, take an M5 V spectral type star eclipsing a K2 V type star. Without any blended flux the complete stellar eclipse would be too long and too deep to be due to a planet. However, if these stars were blended with the light from an F5 V type star, the transit time and the dip in flux would be consistent with a planet transiting the F5 type star near its limb. In this example we have assumed that the F5, K2 and M5 stars have the following typical parameters, (, , ) and (, , ), respectively.
Seager & Mallén-Ornelas (2002) have shown that the percentage of blended events can be derived statistically by using the ratio of the flat part of the eclipse to the total transit time. However, this statistical information does not determine which of the light curves are blended in a given survey. Alternatively, if a spectrum has been taken of the parent star, it is possible to assume an approximate mass and radius based on the spectral type. With the additional information it is possible to compare the density of the parent star with that derived from transit parameters, timescales (total and flat), depth, and orbital period (Seager & Mallén-Ornelas 2002). However, this process is complicated when the blended star is much brighter than the stars involved in the eclipse. In such cases, the measured spectra and density will be for the blended star rather than the eclipsing stars.
In principal it is also possible to determine the presence of blending astrometrically since the location of the photo-center of the blended system will vary from the location of the eclipsing stars. The location of the eclipsing system can be found by using difference image analysis (Alcock et al. 1999). This technique allows the determination of the photo-center of a variable object or binary system by subtracting the constant flux component (the blended baseline flux). An accurate location can be found by combining difference images taken at times during the eclipse. The position of the eclipse is the location of the residual flux. A significant offset between the position of the residual and the photo-center of the blended system can prove that candidate is blended (Alcock et al. 2000, 2001). However, in some cases the separation between the blended centroid and the eclipse centroid will be indistinguishable. Furthermore, many surveys use very large pixel sizes to survey large areas of sky. In such cases astrometry is probably impractical.
The gravity darkening effect occurs whether or not a planetary transit candidate is blended. However, the amplitude of the observed ellipsoidal light variations depends on the brightness of the eclipsing stars relative to the additional flux component. In our example above, the ellipsoidal modulation is very small for periods longer than a day and is washed out by the flux from the much brighter blended star. If the blending is caused by an association of stars, the number of planets is limited to the few stable orbital configurations in such systems. Alternatively, if the additional blended flux comes from the transiting object, such as when the planet candidate is due to a partial stellar eclipse, ellipsoidal variations will be detectable with good photometry.
6. Using colour information
In section 5 we demonstrated how a blended stellar system can mimic a planetary transit. We will now consider how colour information can be used to select bona-fide transits. Our blending example consists of F5, K2 and M5 type stars. An F5 V star has a colour of while a K2 V star has a colour of . The difference between the colour of these two stars will led to a variation in the transit depth when observed in multiple passbands. For our test case the maximum observed transit depths will be magnitudes in -band and magnitudes in -band. Although this difference is very small, it is a large fraction of the eclipse depth and is measurable at the accuracy levels achieved in current transit surveys.
The colours of stars on the main-sequence vary in relation to their sizes. The difference in the transit-depths observed in two passbands will increase as the difference in the sizes of the blended stars increases. Therefore, as the amount of blending increases the fractional difference in observed transit depth will generally increase. The variations in transit depth are most easily observed when observations are taken at widely separated wavelengths. With this in mind, it may well be worth pursuing an observational search strategy where filters are swapped between each observation. Such a strategy can achieve a sampling rate similar to a single colour survey (depending on the observation times and passbands chosen), and gain additional information about colour evolution.
Photometric planetary transit searches require light curves exhibiting a single eclipse since the planet does not contribute to the luminosity of the system. When the orbit of a binary is non-circular there are inclinations where a partial eclipse can appear like a planetary transit. In such cases the orbital eccentricity can cause only a single eclipse to be observed. The presence of a second eclipse is also significantly reduced when there are large differences in the luminosities of the stars in a binary. Therefore, candidate planetary transits are also biased towards binary stars with large luminosity differences. If both stars are on the mainsequence they are likely to have different colours. This colour information can be used to remove candidate planetary transits due to partial stellar eclipses. The detection of a significant colour change during an eclipse is evidence of blending. Colour changes have been observed in searches for planetary transits candidates in MACHO project data (Drake et al. 2003).
Testing planetary transit candidate light curves for colour changes during eclipses may be the easiest and most robust way of finding which events are due to blending. In many cases, a few high signal-to-noise photometric follow up observations, inside and outside the eclipse, will detect the presence of blending. However, in some situations, radial velocity measurements will still be necessary to determine whether or not blending is responsible. It is clear that none of the techniques listed above can give a clear indication of whether blending is present in all cases. Still, the combination of these techniques should reduce the number of blends in planetary transit searches.
7. Conclusions and Discussion
We have shown that the presence of modulations in the light curves of a planetary transit candidates is likely to be due to the gravity darkening effect. This photometric information can be used as an effective way of reducing the number of spurious candidates in current and future planet searches. Unlike the transit timescale, the gravity darkening modulations are directly related to the secondary’s mass. Such a size-independent relation is important because of current uncertainty about the sizes of planets and brown dwarfs in close stellar orbits.
In many cases when very good photometry () is obtained, it is possible to rule out transit candidates due to M-dwarfs to white dwarfs. If greater than 1000 highly accurate () photometry points are obtained, it may be possible to select objects in the planet/brown dwarf regime with photometry alone. The Kepler mission is expected to obtain a photometric precision of 90 micromags (Sahu & Gilliland 2002). However, radial velocity follow-up will still be necessary to determine accurate masses of individual objects and thus to separate brown dwarfs from planets.
White dwarf secondaries are expected to mimic small extra-solar planets in transit surveys due to the transit depths they will cause. It has been shown by Marsh (2001) that microlensing of a transiting white dwarf can cause a magnification during the transit. It has also been reported by Sahu & Gilliland (2002) that the presence of this lensing can be used to break the similarity between planetary and white dwarf transits. However, as white dwarfs are expect to have masses around 0.6 , the gravity darkening effect will be strong. Therefore, at small orbital distances () white dwarf transits will not appear similar to planets. At larger orbital distances microlensing becomes important. However, few transits are expected with long periods since the transit probability decreases as , where is the primary star’s radius and is the orbital separation.
In this work we have shown that many of the Udalski et al. (2002a,b) OGLE-III transit candidates exhibit the presence of ellipsoidal modulations in their light curves with significance. In the coming years many hundreds of planetary candidates are expected from on-going transit surveys. Such large numbers may necessitate the use of a lower selection threshold. However, any selection is tentative without a clear understanding of the systematic uncertainties in the light curves.
Udalski et al. (2002a,b) selected main-sequence stars as targets under the assumption that the transiting objects passed before the center part of their parent stars. Under this assumption it is possible to derive the parent star’s radius and mass from the transit light curve parameters using the equations presented by Seager & Mallén-Ornelas (2002). However, Udalski et al. (2002a,b) instead assumed that all candidates had a mass of and simply noted that there was a small scaling for parent star and planet with the true mass. Although this assertion is correct, the list of OGLE-III candidates contains many stars with radii which are inconsistent with a standard main-sequence mass-radius relationship. Since the radii of transiting objects are derived from the sizes primary stars, these values are biased by the assumption.
When a bright star is blended with an eclipsing binary system the resultant light curve can mimic the signal of a planet transiting the bright star. In such cases it may be difficult to separate bona-fide candidates from blends with spectra or based on the presence of sinusoidal baseline variations. However, it may be possible to detect the blend by measuring the depth of the transit in more than one passband.
I wish to thank the members of OGLE-III project for making their data publicly available. I also wish to thank Gabriela Mallen-Ornelas and Sara Seager for their comments which improved this paper.
References
- Alcock et al. (1999) Alcock, C., et al. 1999, ApJ, 521, 602
- Alcock et al. (2000) Alcock, C., et al. 2000, ApJ, 541, 734
- Alcock et al. (2001) Alcock, C., et al. 2001, ApJ, 552, 582
- Alencar, & Vaz (1997) Alencar S.H.P. & Vaz, L.P.R., 1997, A&A, 326, 257
- Baraffe et at. (1998) Baraffe, I., et al., 1998, A&A, 337, 403
- Baraffe et at. (1998) Baraffe, I., et al., 2002, A&A, 382, 563
- Beech (1985) Beech, M., 1985, Ap&SS, 117, 69
- Bessell, & Brett (1988) Bessell, M.S., & Brett, J.M., PASP, 1988, 100, 1134
- Bodenheimer, et al. (2001) Bodenheimer, P., Lin, D.N.C., & Mardling, R.A., 2001, ApJ, 548, 466
- Brown (2001) Brown, T.M., 2001, ApJ, 553, 1006
- Brown et al. (2001) Brown, T.M., et al., 2001, ApJ, 552, 699
- Burrows et al. (2000) Burrows, A., et al., 2000, ApJ, 534, 97
- Charbonneau et al. (2000) Charbonneau, D., et al., 2000, ApJ, 529, 45
- Charbonneau et al. (2002) Charbonneau, D., et al., 2002, ApJ, 568, 377
- Claret (1998) Claret, A., 1998, A&AS, 131, 395
- Claret (2000) Claret, A., 2000, A&A, 359, 289
- Cody, & Sasslov (2002) Cody, A., & Sasselov, D., 2002, ApJ, 569, 451
- Drake et al. (2003) Drake, A.J., et al., 2003, in preparation
- Dreizler et al. (2002) Dreizler, S., et al., 2002, A&A, 391, 17
- Guillot, & Showman (2002) Guillot, T., & Showman, A.P., 2002, A&A, 385, 156
- Henry et al. (2000) Henry, G.W., Marcy, G., Butler, R.P., & Vogt, S.S., 2000, ApJ, 529, L41
- Jenkins, et al. (2001) Jenkins, J., Caldwell, D.A., & Borucki, J., 2002, ApJ, 564, 495
- Kitamura, & Nakamura (1988) Kitamura, M., & Nakamura, Y., 1988, Ap&SS, 145, 117
- Mallén-Ornelas et al. (2002) Mallén-Ornelas, G., et al., 2002, astro-ph/0203218
- Marcy, & Bulter (2000) Marcy, G., & Butler, R., 2000, PASP, 112, 137
- Marsh (2001) Marsh, T.R., 2001, MNRAS, 324, 547
- Mazeh, et al. (2000) Mazeh, T., et al., 2000, ApJ, 532, 55
- Rafert, & Twigg (1980) Rafert, J.B., & Twigg, L.W., 1980, MNRAS, 193, 79
- Seager, & Sasselov (2000) Seager, S., & Sasselov, D.D., ApJ, 2000, 537, 926
- Seager, & Mallén-Ornelas (2002) Seager, S., & Mallén-Ornelas, G., 2002, astroph/0206228
- Sahu, & Gilliland (2002) Sahu, K., & Gilliland, R.L., 2002, astroph/0210554
- Udalski et al. (2002a) Udalski, A., et al., 2002a, Acta Astron., 52, 1
- Udalski et al. (2002b) Udalski, A., et al., 2002b, Acta Astron., 52, 115
- Udry et al. (2002) Udry, S., et al., 2002, A&A, 390, 267
- von Zeipel (1924) von Zeipel, H., 1924, MNRAS, 84, 665
| ID | Amp | Err | F | |
|---|---|---|---|---|
| (mmag) | (mmag) | |||
| OGLE-TR-2 | 3.21 | 0.27 | 1.45 | 149.7 |
| OGLE-TR-3 | 1.49 | 0.37 | 0.88 | 18.1 |
| OGLE-TR-5 | 7.23 | 0.39 | 1.49 | 323.4 |
| OGLE-TR-6 | 1.86 | 0.46 | 1.21 | 16.4 |
| OGLE-TR-7 | 1.79 | 0.36 | 1.29 | 23.6 |
| OGLE-TR-13 | 1.46 | 0.25 | 1.51 | 35.8 |
| OGLE-TR-14 | 1.60 | 0.25 | 1.43 | 46.2 |
| OGLE-TR-16 | 14.58 | 0.29 | 1.69 | 2573.9 |
| OGLE-TR-18 | 3.99 | 0.44 | 1.01 | 85.2 |
| OGLE-TR-21 | 1.79 | 0.38 | 1.00 | 23.7 |
| OGLE-TR-24 | 2.23 | 0.64 | 3.00 | 16.4 |
| OGLE-TR-25 | 3.28 | 0.38 | 1.35 | 72.5 |
| OGLE-TR-27 | 7.28 | 0.57 | 1.28 | 171.2 |
| OGLE-TR-30 | 2.04 | 0.31 | 1.33 | 44.7 |
| OGLE-TR-31 | 3.68 | 0.29 | 1.59 | 172.9 |
| OGLE-TR-32 | 6.01 | 0.27 | 1.28 | 454.3 |
| OGLE-TR-40 | 0.97 | 0.26 | 1.42 | 12.2 |
| OGLE-TR-52 | 3.67 | 0.56 | 1.33 | 42.8 |
| OGLE-TR-57 | 5.92 | 0.44 | 1.01 | 194.0 |
Note. — Col. (1), OGLE-III object ID. Cols. (2) & (3) Fit amplitude and uncertainty. Col. (4) Reduced value of fit. Col. (5) F-statistic value.