New Light on the Stellar Populations in I Zw 18: Deep Near-Infrared Imaging
Abstract
We present deep images of I Zw 18, the most metal-deficient Blue Compact Dwarf (BCD) galaxy known, and analyze them in conjunction with archival HST/WFPC2 optical images. To investigate the stellar populations, we have divided the main body of I Zw 18 into eight regions, and fit the optical, near-infrared (NIR), and hybrid optical-NIR colors of these and the C component with evolutionary synthesis models. The composite best fit is obtained for an age for evolved stellar populations of 200 Myr; fits with an older age of 500 Myr are less likely but possible. Our data show no evidence for stellar populations in I Zw 18 older than this, although as much as 22% of the stellar mass in older stars (4% in light) could remain undetected. The colors of the young and intermediate-age stellar populations are significantly affected by widespread and inhomogeneously distributed ionized gas and dust. Ionized gas emission is important in every region examined except the NW star cluster. Extinction is significant in both the NW and SE clusters. Red , , and colors are not reliable indicators of old stellar populations because ionized gas emission is also red in these colors. , on the other hand, reliably separates stars from gas because the former are red ( 0.4) while the latter is blue ( –0.4).
1 Introduction
The question of whether there are young galaxies in the local universe forming stars for the first time is of considerable interest for galaxy formation and cosmological studies. There are several reasons for this. First, Cold Dark Matter models predict that low-mass dwarf galaxies could still be forming at the present epoch because they originate from density fluctuations considerably smaller than those giving rise to the giant ones. Thus the existence of young dwarf galaxies in the local universe would put strong constraints on the primordial density fluctuation spectrum. Second, while much progress has been made in finding large populations of galaxies at high ( 3) redshifts (Steidel et al., 1996; Dey et al., 1998; Papovich et al., 2001), truly young galaxies in the process of forming remain elusive in the distant universe. The spectra of those far-away galaxies generally indicate the presence of a substantial amount of heavy elements, implying previous star formation and metal enrichment. Thus it is important to have examples of truly young galaxies in the local universe because they can be used as laboratories to study star formation and chemical enrichment processes in environments that are sometimes much more pristine than those in known high-redshift galaxies. Moreover, their proximity allows studies of their structure, metal content, and stellar populations with a sensitivity, precision, and spatial resolution that faint distant high-redshift galaxies do not allow. Finally, in the hierarchical model of galaxy formation, large galaxies result from the merging of smaller structures. These building-block galaxies are too faint and small to be studied at high redshifts, while we stand a much better chance of understanding them if we can find some local examples.
The Blue Compact Dwarf (BCD) galaxy I Zw 18 is one of the best candidates for being a truly young galaxy. It is described by Zwicky (1966) as a double system of compact galaxies, which are in fact two bright knots of star formation separated by 5″ and referred to as the brighter northwest (NW) and fainter southeast (SE) components; these two components comprise the main body. Later studies revealed a blue irregular star-forming region 22″ northwest of the NW component, referred to as component C. Dufour et al. (1996a), van Zee et al. (1998) and Izotov & Thuan (1998) have shown the C component to have a systemic radial velocity equal to that of the ionized gas in the NW and SE components, thus establishing its physical association with I Zw 18. Furthermore, 21 cm VLA mapping by van Zee et al. (1998) has shown that this component is embedded within a common H I envelope with the main body.
As the lowest-metallicity galaxy known, I Zw 18 has been studied intensively over the thirty years since the first determination of its heavy element abundance (Sargent & Searle, 1970). The low oxygen abundance of 1/50 the solar value of I Zw 18 has been confirmed by many groups (Izotov et al., 2001, and references therein). This lack of chemical enrichment has led to the idea that I Zw 18 may be a young galaxy, only now forming stars for the first time (Searle & Sargent, 1972). Izotov & Thuan (1999) have argued that the heavy element abundance of a BCD is a good age indicator. They found that all BCDs with heavy element mass fraction /20 show constant C/O and N/O abundance ratios, and interpret this constancy as meaning that C and N in these most metal-deficient galaxies are made in the same massive stars that produce O, and that intermediate-mass stars (3 9 ) have not had time to die and release their C and N production. This puts an age upper limit of the order of 400 Myr for these extremely metal-deficient BCDs (Izotov & Thuan, 2002). It was first thought that I Zw 18 did not follow that trend as Garnett et al. (1997) have derived a C/O ratio for I Zw 18 that is considerably higher than in other metal-poor BCDs, and concluded that carbon in I Zw 18 has been enriched by an older generation of stars. However, Izotov & Thuan (1999) have rederived the C/O abundance ratio in I Zw 18 and found a value in agreement with that of other BCDs with /20. Therefore, no preceding low-mass carbon-producing stellar population needs to be invoked. Young dynamical ages have been inferred for I Zw 18 from the structure of expanding superbubbles of ionized gas driven by supernova explosions (15 – 27 Myr: (Martin, 1996); 13 – 15 Myr: (Dufour et al., 1996b)).
The conclusion that I Zw 18 might be a young primeval galaxy in the local universe, with age 400 Myr, has been challenged, however, by the authors of several recent color-magnitude diagram (CMD) studies of stars resolved in HST images of I Zw 18. In the first CMD study based on , , and HST/WFPC2 images, Hunter & Thronson (1995) concluded that the optical colors of the stars in I Zw 18 were consistent with those of young massive main sequence stars, and the colors of the unresolved emission with an intermediate-age stellar population of B and early A stars. But the data did not go deep enough to detect individual evolved stars.
From an independent set of , and HST/WFPC2 images, Dufour et al. (1996b) concluded that the current star formation in the main body began at least 30 – 50 Myr ago, continuing to the present, consistent with the dynamical ages derived from expanding superbubbles of ionized gas. As for the C component, Dufour et al. (1996b) found that it consists of an older stellar population composed of faint red stars with ages 100 – 300 Myr on which the current modest starburst (blue stars with age 40 Myr) is superimposed in its southeastern half. Those ages are consistent with those derived from heavy element abundance ratios (Izotov & Thuan, 1999).
However, Aloisi et al. (1999) have reanalyzed the two HST/WFPC2 data sets above and, going deeper thanks to improved reduction techniques, concluded that there were two episodes of star formation in the main body: a first episode occurring over the last 0.5 – 1 Gyr, an age more than 10 times larger than that derived by Dufour et al. (1996b), and a second episode with more intense activity taking place between 15 and 20 Myr ago, with no star formation occurring within the last 15 Myr. For the C component, Aloisi et al. (1999) estimated an age not exceeding 200 Myr. Subsequently, Östlin (2000) has carried out a near-infrared (NIR) CMD study based on HST/NICMOS (F110W) and (F160W) images. He concluded that the main body of I Zw 18 is dominated by two populations, one 10–20 Myr population of red supergiants and another considerably older 0.1–5 Gyr population of asymptotic giant branch (AGB) and red-giant stars. Thus, it appears that CMDs require two episodes of star formation in I Zw 18: an old burst, responsible for the red faint stars, and a more recent one which produces the red supergiant and blue massive stars seen to dominate the CMDs. More recently, Recchi et al. (2002) also found that two bursts were necessary to explain the dynamical and chemical evolution in I Zw 18: an older burst which occurred 300 Myr ago, and a more recent one with age between 4–7 Myr.
Izotov et al. (2001) and Kunth & Östlin (2001) have pointed out that comparison of observed colors with those predicted by burst models of star formation inevitably leads to an underestimate of the age, and an overestimate of the star-formation rate. It is therefore important to consider various star formation scenarios (such as continuous star formation) in any comparison between models and observations. Legrand (2000) and Legrand et al. (2000) have gone to the other extreme by arguing that star formation in I Zw 18 may proceed, not in episodic bursts, but in a continuous fashion over a long period of many Gyr, at the low rate of about yr-1, more than a 1000 times lower than that inferred by Aloisi et al. (1999). This continuous low star formation would result in an extended underlying low surface brightness stellar component in I Zw 18. However, Izotov et al. (2001) and Papaderos et al. (2002) have shown that the existence of such a component is supported neither by spectroscopic nor photometric measurements of the extended emission around the star forming regions in I Zw 18.
It is thus clear that, in spite of numerous studies, there is still no consensus regarding the age of I Zw 18 and its star formation history. While CMD analysis is the method of choice for the determination of stellar ages, it is also subject to several uncertainties such as distance determination, extinction, and contamination of the stellar colors by gaseous emission. The NIR bands provide a clear advantage over optical bands in this context, because of their enhanced sensitivity to evolved red stars and reduced effects of dust extinction. To revisit the question of the ages of the stellar populations in I Zw 18, we have acquired deep images with UKIRT/IRCAM3. Using these together with HST WFPC2 and NICMOS archival images, we can directly address the above questions of extinction and gas contamination. Moreover, we can derive the color transformations between the HST and ground-based filters. This is necessary because the HST NICMOS 1µm filter (F110W) is very different from the standard Johnson filter. By necessity, we shall focus here on average stellar surface brightness distributions rather than on luminosities of single stars. While seemingly a liability, such an approach will allow us a more complete examination of the stellar content of the galaxy and its age.
The observations and analysis techniques are presented in Section 2. The derived NIR and hybrid optical-NIR colors are discussed in Section 3. In Section 4, we model the broadband colors with a variety of star-formation histories, and discuss the results in terms of stellar population ages, gaseous emission and dust extinction. We summarize our conclusions in Section 5.
2 Observations and Analysis
We acquired (1.2µm), (1.6µm), and (2.2µm) images of I Zw 18, including the C component, with the 3.8-m United Kingdom Infrared Telescope (UKIRT111The United Kingdom Infrared Telescope is operated by the Joint Astronomy Centre on behalf of the U.K. Particle Physics and Astronomy Research Council.) equipped with IRCAM3. The observations were performed in the UKIRT Service Observing program in March, 1999, as part of our ongoing project of NIR imaging and spectroscopy of BCDs. The IRCAM3 plate scale is 028 per pixel, with a total field-of-view of 72″ 72″. To obtain a clean image of the C component, 22″ to the NW, source and empty sky positions were alternated, beginning and ending each observing sequence with a sky position. Before the beginning of each sequence, dark exposures were acquired with the same parameters as the subsequent science frames. Total on-source integration times were 43 min in , 26 min in , and 39 min in . Individual frames were dark-subtracted and flat-fielded with the average of adjacent empty sky frames, after editing them for stars (to avoid “holes” in the reduced frames) and applying an average-sigma clipping algorithm. The reduced frames were then aligned and averaged. All data reduction was carried out in the IRAF environment222IRAF is the Image Analysis and Reduction Facility made available to the astronomical community by the National Optical Astronomy Observatory, which is operated by AURA, Inc., under contract with the U.S. National Science Foundation..
Photometric calibration was performed by observing standard stars from the UKIRT Faint Standard List (Hawarden et al., 2001) before and after the source observations. Each standard star was measured in several different positions on the array, and flat-fielded by dividing the clipped mean of the remaining frames in the sequence. To correct the standard-star photometry for atmospheric extinction, we used the UKIRT mean extinction coefficients of 0.102, 0.059, and 0.088 mag/airmass for , , and respectively. Formal photometric accuracy, as measured by the dispersion in the standard star magnitudes is 0.025 mag in and and 0.04 mag in .
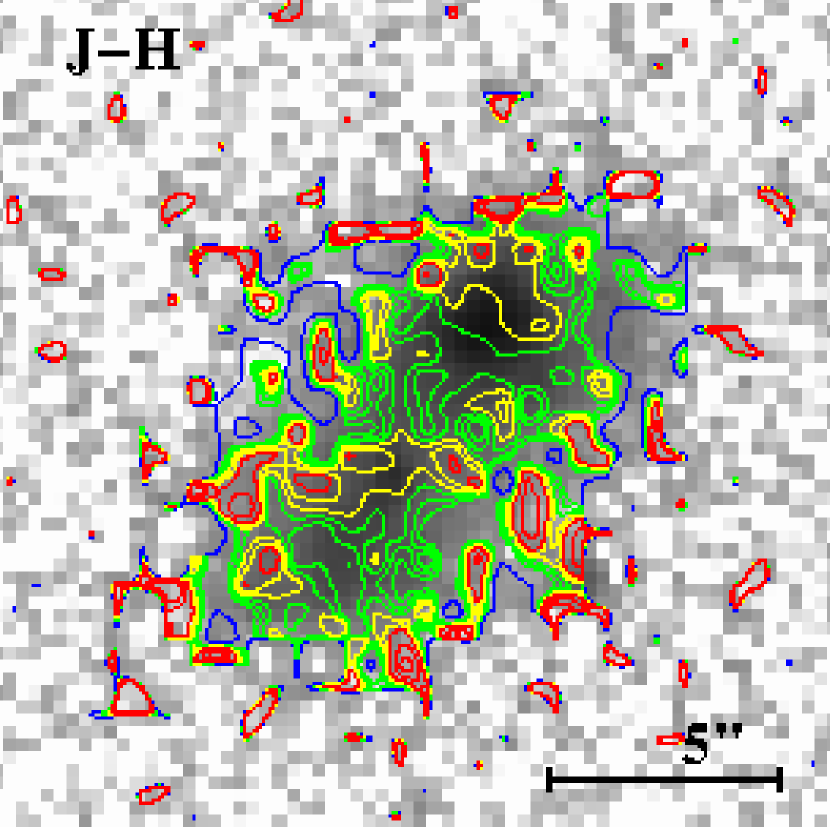
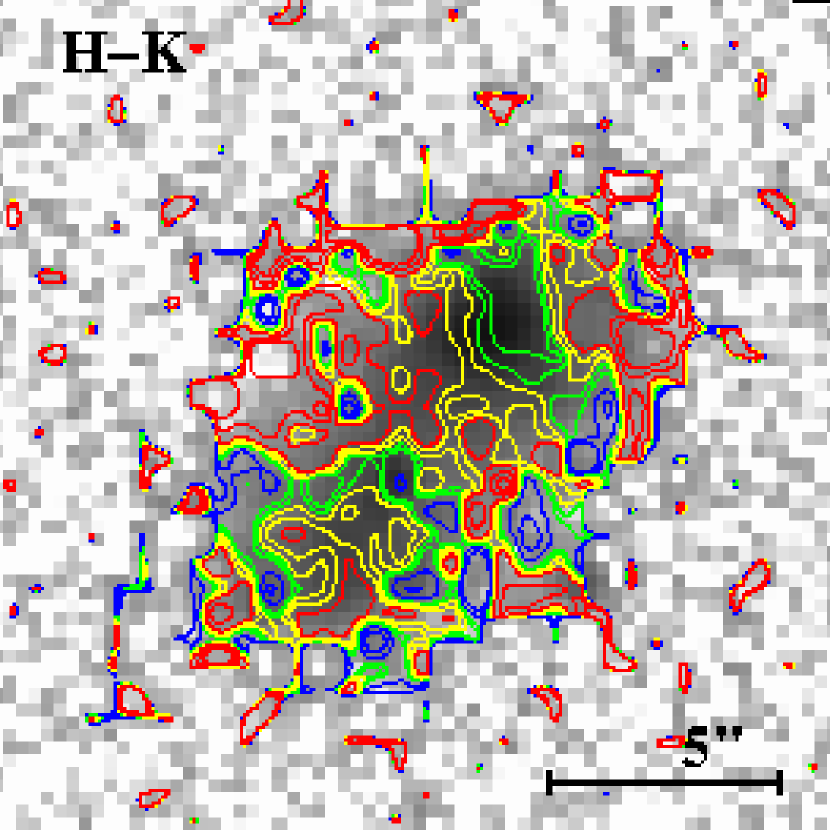
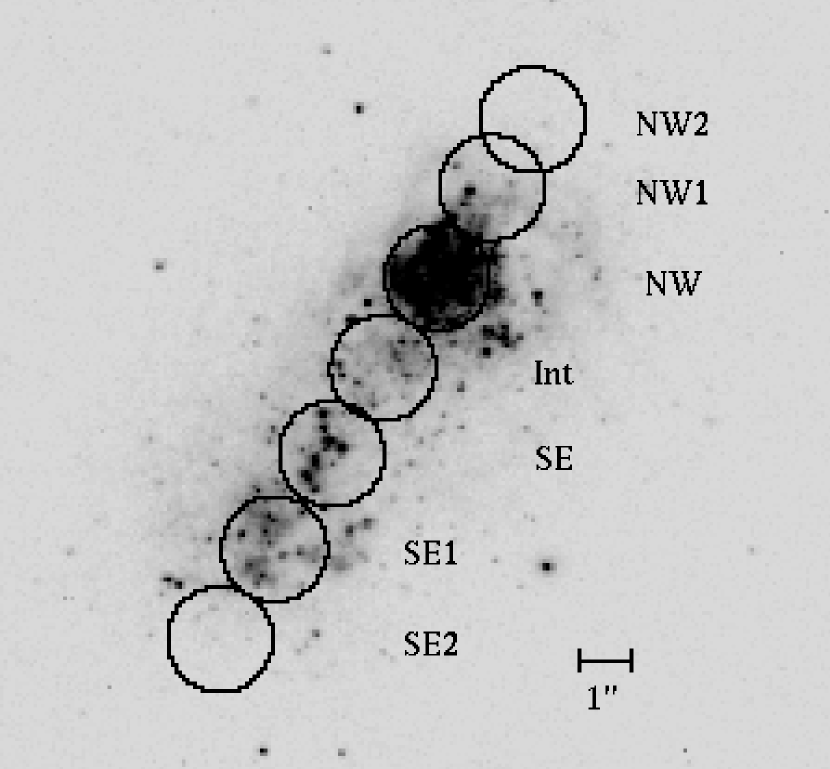
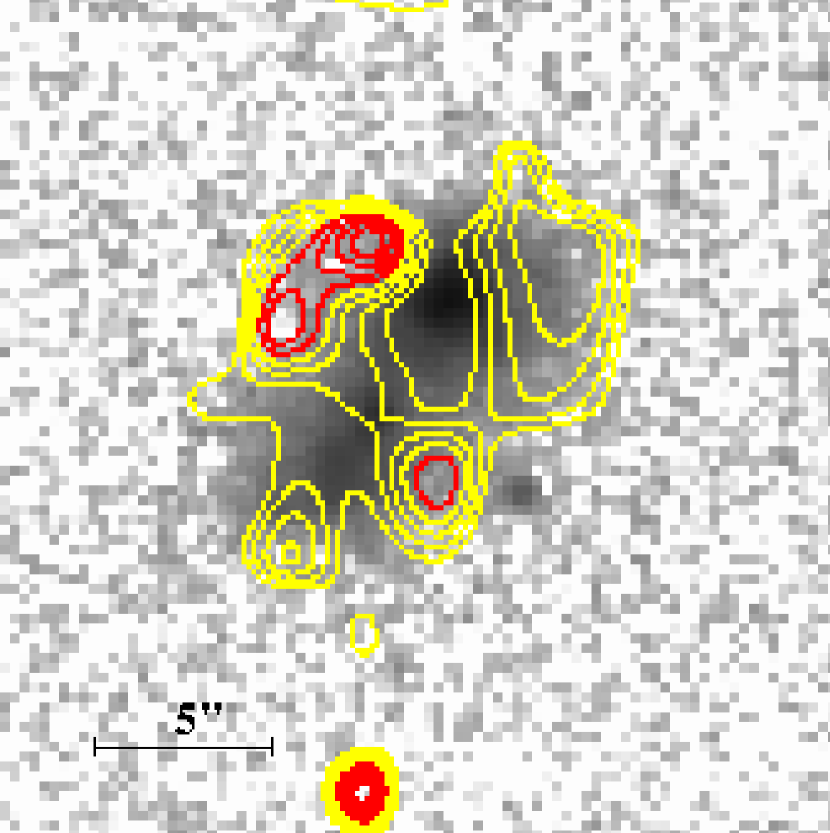
Color images were derived by registering the images to a few tenths of a pixel with a cross-correlation algorithm, then subtracting the magnitude images. The image is shown in Fig. 1, together with (left panel) and (right panel) contours superimposed. These contours will be discussed in Section 3.2.
2.1 HST WFPC2 and NICMOS Images
We retrieved from the HST archives WFPC2 images of I Zw 18 in the F555W () and F814W () filters (PI: D.A. Hunter, GO-5309), and in the F439W filter () (PI: R. Dufour, GO-5434). The pipeline reduction was used, followed by combination of the individual images with the IRAF/STSDAS333STSDAS is the Space Telescope Science Data Analysis System. task crreject. The images were calibrated and transformed to ground-based according to the precepts of Holtzman et al. (1995), then rotated to canonical orientation (N up, E left). The image was obtained by subtracting the magnitude images.
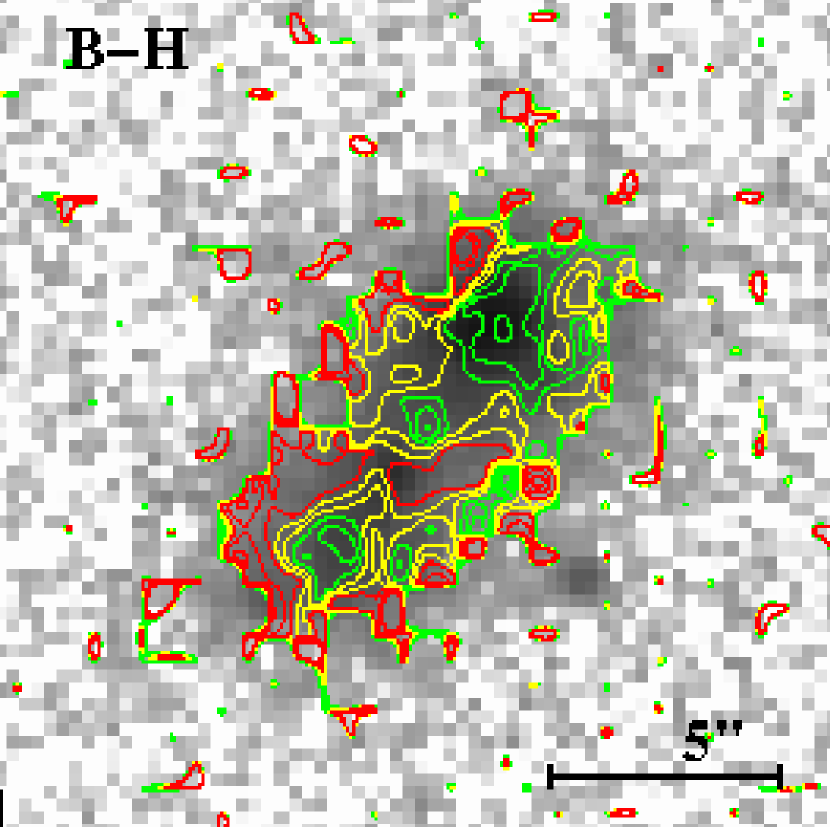
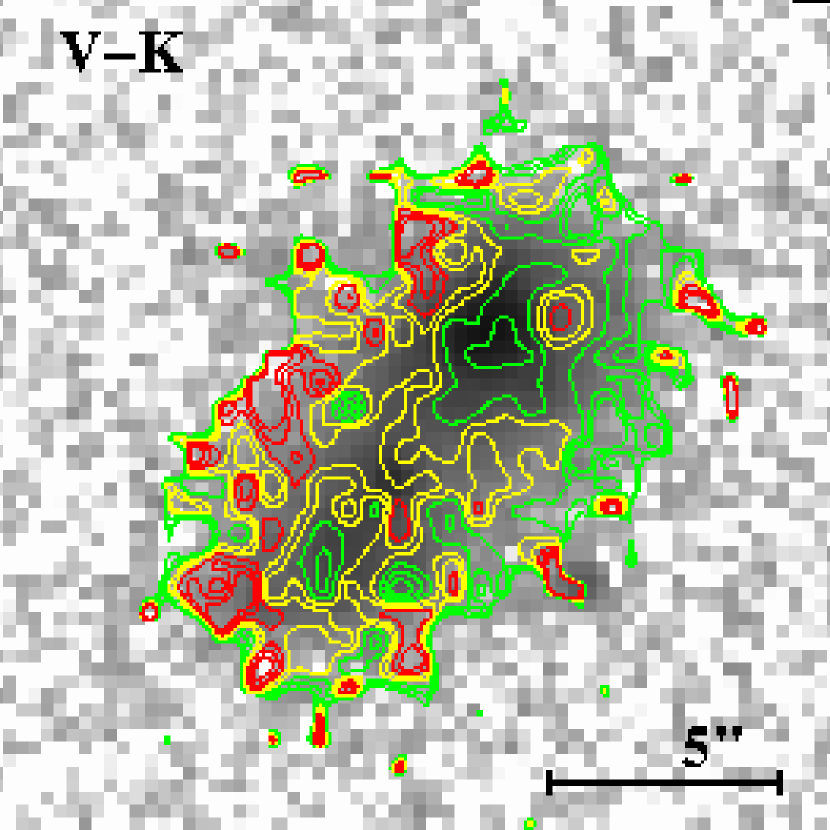
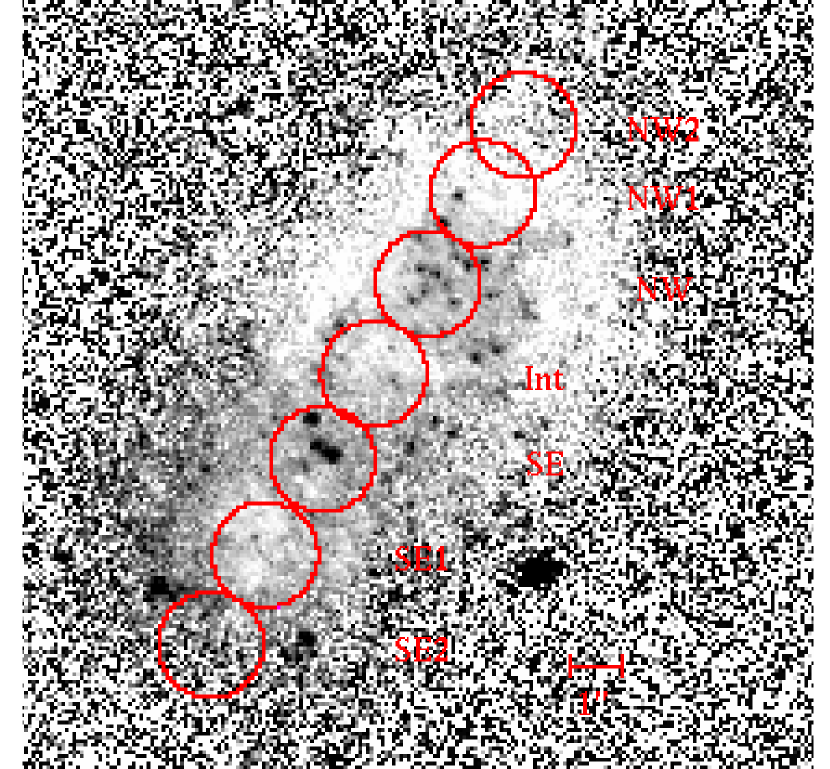
Hybrid ground-based NIR–optical WFPC2 color images were derived by first rotating them to the usual orientation (North up and East left), rebinning them to the UKIRT pixel size, and finally aligning them to a fraction of a pixel by cross-correlation. These color images, shown as contours superimposed on the image, are shown in Fig. 2.
The NICMOS F110W and F160W images were also acquired from the HST archive (PI: G. Östlin, GO-7461), and re-reduced with STSDAS task calnica using the best reference files. They were corrected for the pedestal effect with the software of van der Marel444http://www.stsci.edu/marel/software/pedestal.html, and calibrated in the standard way. Finally, they were rotated to canonical orientation. The analytical color transformation of Origlia & Leitherer (2000) was then applied to the rotated F110W–F160W color image to transform it to the standard . To compare the transformed HST/NICMOS image with our ground-based image, we rebinned the HST image to the larger UKIRT pixel size, and registered the two by cross-correlation.
2.2 Aperture Photometry
Aperture photometry with varying aperture diameters was performed on the NIR UKIRT and optical WFPC2 images at the locations of the two main star-forming regions in the main body of I Zw 18, the NW and the SE brightness peaks. To better study color gradients and possible changes in gaseous content and stellar populations over short distances in I Zw 18, we also performed photometry in circular apertures of radius 1″ along a position angle (PA) of 149∘, E from N, aligned with the NW and SE brightness peaks. Besides the NW and SE peaks, photometry was also obtained for the intermediate region between the NW and SE regions (“Inter”), two extended regions to the NW of the NW peak (“NW1” and “NW2”), and the two extended regions to the SE of the SE peak (“SE1” and “SE2”). We used an aperture of radius 15 in the NW2 and SE2 regions because of lower signal-to-noise. The different apertures and their designations are shown in Fig. 3 superimposed on the HST image in the left panel, and on the image in the right; the photometry itself, together with larger-aperture photometry for all regions, is reported in Table 1.
We have also obtained a UKIRT NIR image of the C component, and performed aperture photometry on two positions: one centered on the main brightness peak denoted by “C (central)”, and the other on the extended emission toward the NW denoted “C (extended)”. This photometry, together with the global photometry for the C component, is also reported in Table 1.
2.3 Surface-Brightness Profiles and Cuts
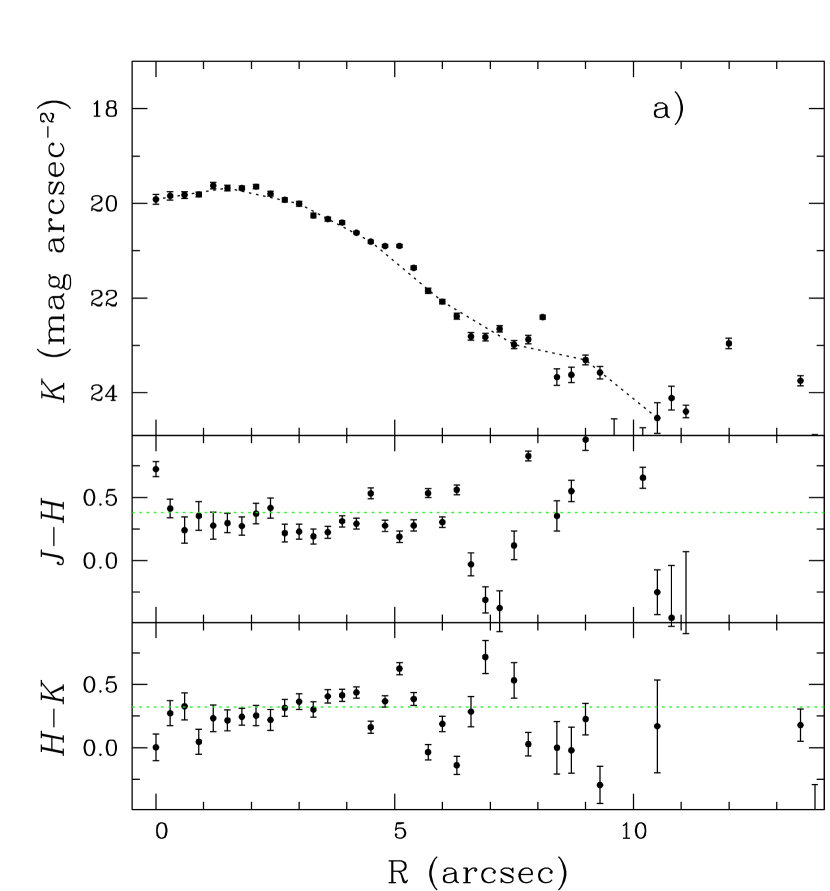
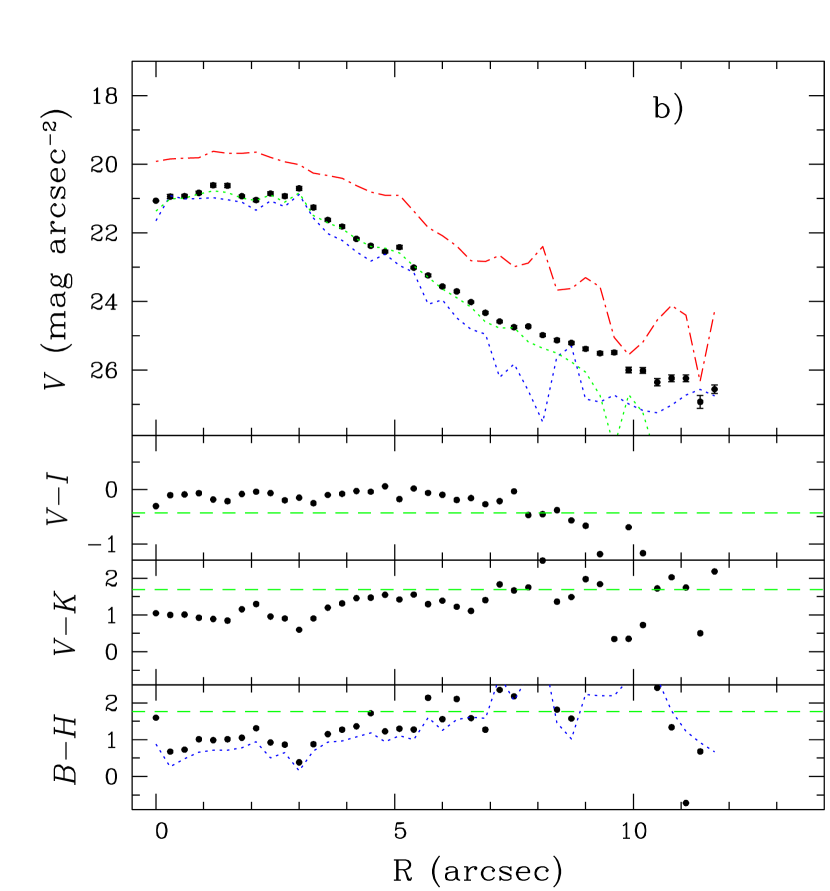
We have fit ellipses to the image of I Zw 18, with the centers defined by the center of symmetry of the outer regions, which lies roughly halfway between the NW and SE emission peaks. The PA and ellipticity of the ellipses were fixed to 141∘ (E from N) and 0.23, respectively, which were the values the isophotal fitting converged to. Note that this PA is 8∘ smaller than that we used for the cuts; the latter was defined by eye to contain the maxima of the NW and SE brightness peaks. Using this geometry, , , , and radial profiles were derived, and are shown in Fig. 4. Inspection of the figure shows that our image, when elliptically averaged, achieves a limiting surface brightness of 24 mag arcsec-2, enabling us to search effectively for an extended underlying old stellar population.
The mean NIR colors of extended emission were derived by calculating the average of all points in the profile with mag arcsec-2, , and radius 35. The mean optical and hybrid colors were derived in a similar way, with mag arcsec-2 and radius 55. The mean colors of the extended emission turn out to be: , , , , , where the quoted uncertainties are the standard deviations of the ensemble, rather than photometric “errors”. These values have been corrected for Galactic extinction according to the Schlegel et al. (1998) value = 0.138, and with the extinction law of Cardelli et al. (1989). The mean colors of the extended emission are indicated in Fig. 4 by horizontal dashed lines. The peak at 2″ corresponds to the approximate superposition of the NW and SE peaks in the elliptical average.
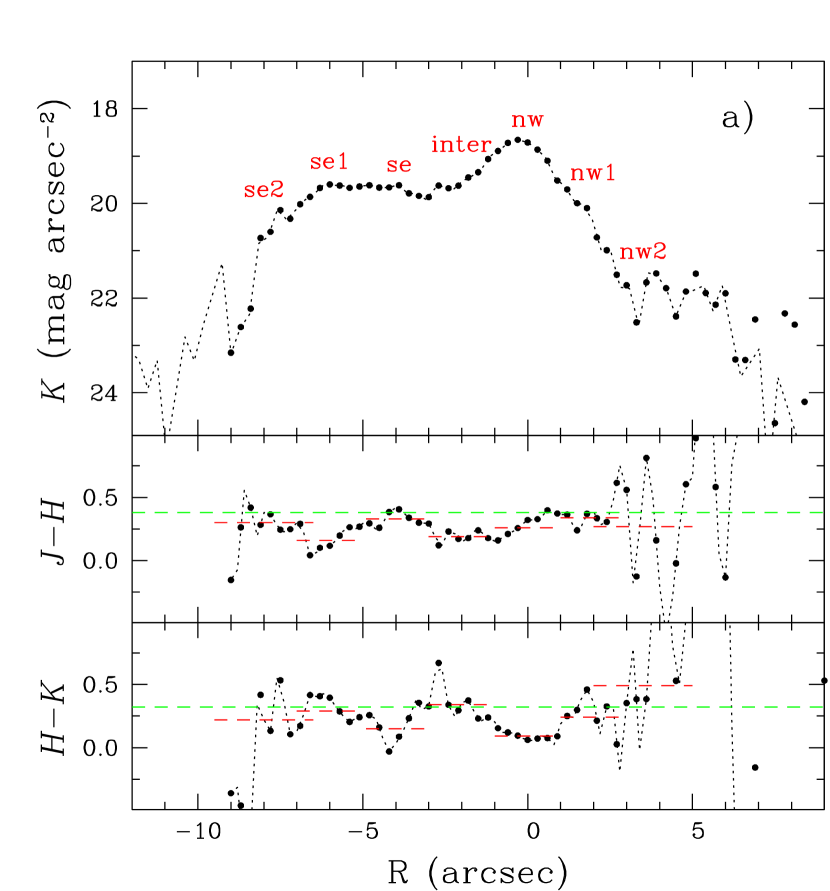
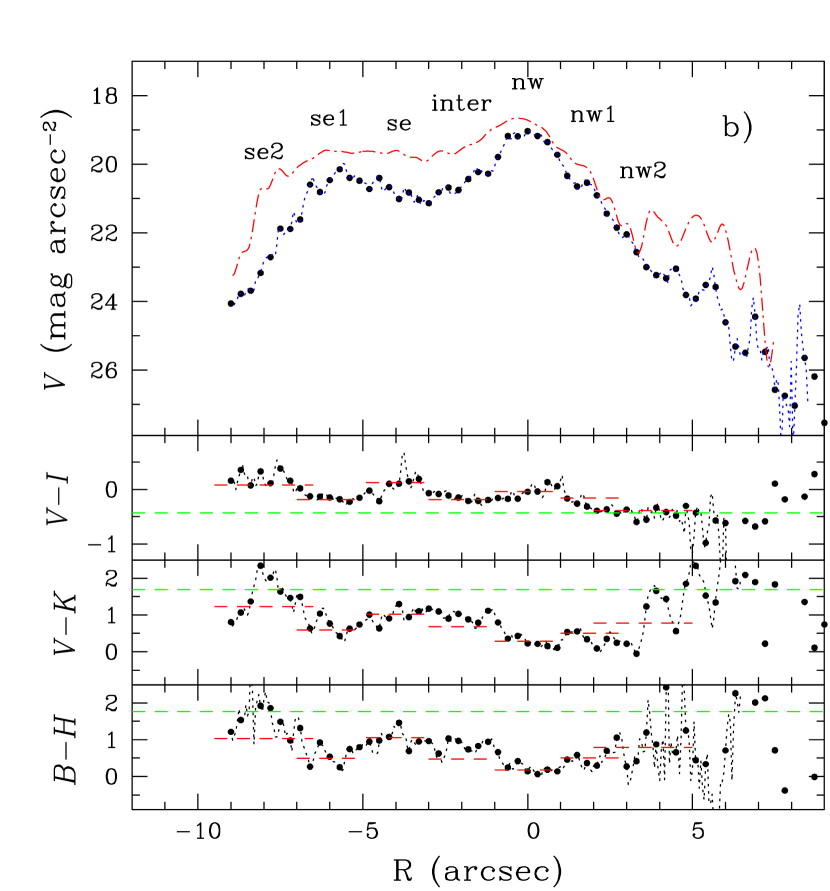
Although elliptical averaging is important because of the gains that can be achieved in signal-to-noise ratio, the inner structure of I Zw 18 is clearly not symmetric. Therefore, to better quantitatively examine color gradients, we have also derived surface-brightness profiles along a “cut”, coincident with the orientation of the aperture photometry (PA = 149∘ and aligned with the two main brightness peaks). The width of the cut is 17 in the perpendicular direction (6 pixels for the NIR images, 38 pixels for WFPC2). The resulting brightness and color profiles are shown in Fig. 5, where positive radii are towards the NW, negative towards the SE; the origin is defined by the NW brightness peak. NIR surface-brightness and color profiles are shown in the left panels, and analogous hybrid NIR-optical profiles in the right panels. Cut regions are labelled with their regional designation (see 2.2) at their approximate radial distance. The colors in the 2″ apertures are indicated by short horizontal dashed (red) lines. The color of the extended region is indicated by the long horizontal dashed (green) line555Although all figures are in black and white in the printed version of the paper, some will appear in color in the on-line version. Here, and for subsequent figures, we indicate in parentheses the colors.. All colors have been corrected for Galactic extinction as described above.
3 Broadband Colors
By combining the optical HST archival images together with our NIR data, we have at our disposal six broadband filters, , , , , and , and thus five independent colors. We have chosen to analyze , , , , and for the following reasons. The optical color provides important information about gas contamination, extinction, and young stars. Moreover, it distinguishes very well ionized gas emission from evolved stars. The NIR colors put constraints on the presence of an evolved stellar population, as well as on the presence of hot dust and ionized gas (). Hybrid optical-NIR color combinations, such as and , are effective extinction diagnostics: according to the Cardelli et al. (1989) extinction curve and Holtzman et al. (1995), the reddenings for and are respectively and , large enough to allow the separation of the effects of stellar population age gradients from those of dust. These hybrid colors also provide important diagnostics for the nature of the stellar populations. In particular, the color is very sensitive to age, as the onset of the AGB phase at 100 Myr causes a sudden intense reddening, making larger than 2 (Girardi & Bertelli, 1998). Hybrid optical-NIR colors are ambiguous however for discriminating stellar population effects from ionized gas contamination and extinction effects since they are red in all cases. To distinguish gas from older stars, the color of choice is and, to a lesser extent : while these colors are blue for gas, they are red for older stars. We discuss in turn the optical, NIR, and hybrid colors and color gradients in the following subsections.
3.1 Optical Colors
Inspection of the color image (right panel of Fig. 3) shows that there is a blue “crown” surrounding the NW star cluster, a red border to the E of the SE cluster, and numerous very red point sources scattered throughout the NW and SE brightness peaks and the region separating them. There is also a blue region around the SE1 star cluster. The colors in the crown range from to , and with redder colors toward the SE. The star clusters themselves appear to be relatively blue (). We ascribe the colors in the crown to ionized gas for the following three reasons. First, the color of ionized gas is –0.4 at the redshift of I Zw 18, similar to the crown color. Second, in the HST image (left panel of Fig. 3), filamentary structures can be seen surrounding the NW brightness peak, coincident with the blue crown. Third, examination of the H maps of Östlin et al. (1996) and Izotov et al. (2001) show very high equivalent widths at the location of the crown. This interpretation will be further discussed in the context of our color fits in 4.1.
The extended emission, at ″ and mag arcsec-2, shows also very blue . Such blue colors are highly unusual in BCDs. They are bluer than in any of the H ii galaxies studied by Telles & Terlevich (1997) but are comparable to those in SBS 0335–052 (Thuan et al., 1997), another extremely metal-poor BCD (1/40 solar metallicity).
A striking feature of the map shown in the right panel of Fig. 3 is the patchiness of the color, which can be most probably attributed to spatial variations in the dust and ionized gas emission. In addition to the patchiness on small scales, there are also large-scale color gradients. These can be clearly seen in the cuts shown in the right panel of Fig. 5. There is a general reddening of going from the NW to the SE: is –0.6 at the northernmost tip of the extended region to the NW, and gets progressively redder going toward the SE where, outside the main brightness peak, is 0.2. In addition to this general trend, there are local red maxima in near the NW and SE clusters, and further to the S (SE2). The red features evident in the color image (right panel of Figure 3) toward the SE can be seen in Fig. 5 at a radial distance of roughly ″, and the blue of the filaments toward the NW at a radial distance of ″.
The high resolution of the optical color images also reveals numerous very red point sources, particularly in the NW star cluster, where can be as high as 1.5 locally. Even higher is seen in the reddest compact sources between the two brightness peaks. Such red colors are consistent with those of bright extremely late-type stars ( K5) (Bessell & Brett, 1988), presumably red supergiants, or with those of dusty H ii regions.
3.2 NIR Colors
The color image shown in the left panel of Fig. 1 also reveals color gradients, although most of the image has (light grey666In the online color version, these and following contours correspond to: black=blue, light grey=green, white=yellow, dark grey=red. contours), the colors of young or intermediate-age stars, assuming there is no contamination from ionized gas emission. Moderately red ( 0.4, white contours) is seen towards the N of the NW cluster, and along the N border of the SE cluster. Very red structures (, dark grey contours) lie toward the E and the SE, both outside of the SE brightness peak. Toward the E, and , colors which are inconsistent with evolved stars. Toward the SE, and are redder, which, together with , could suggest the presence of an evolved stellar population. However, because the structure of the red regions is compact and different from the diffuse structure seen in other colors, it is likely that dust extinction also contributes to the red colors (see Sect. 4.3). A reddening of the color by 0.1 mag corresponds to an of order unity.
The image (right panel of Fig. 1) shows an even more inhomogeneous distribution. While the region to the E of the NW cluster has a relatively blue , its color is very red ( 0.6, dark grey contours). Such a combination of colors can only be attributed to hot dust (with a temperature K) or ionized gas, since dust extinction or red stars would result in a red as well. We tend to exclude the hypothesis that the red is due to hot dust since the UV flux reported by Vidal-Madjar et al. (2000) is not sufficient to heat dust to the necessary high temperatures even at 1 pc radius. Indeed, the colors of all regions with red are almost certainly due to ionized gas, with the exception of the region to the E of the SE cluster. There, is also red, which could be due to either red stars or dust extinction.
The NIR colors of the cut (Fig. 5) also reflect the information in the color images. Along the cut, is relatively constant, while has a local peak () in the “intermediate” region between the two main star clusters.
3.3 Hybrid Colors
The colors in the optical-NIR hybrid and images (Fig. 2) also show an inhomogeneous spatial distribution, with several compact regions being significantly redder than their surroundings. In particular, red (2.2) is confined to six small clumps outside the main NW and SE star clusters, and to the SE of the SE cluster. The same is true for where particularly red colors () are found in small clumps, most notably SE and E of the SE star cluster. The NW and SE star-forming complexes are both bluer in and than the region between them.
The elliptically-averaged profiles (Fig. 4) also show the effects of small-scale inhomogeneity, as well as large-scale color changes. The color of the extended emission is bluer than the main body, while and are redder; such a trend would be expected for ionized gas emission. The patchy distribution of the hybrid colors can also be seen in the right panels of Fig. 5. The bluest and colors are observed near the NW and SE brightness peaks, with both colors becoming redder farther away.
3.4 The C Component
Taken globally, the NIR colors of the C component are redder in than those in the main body, but bluer in . The optical magnitudes of the C component are and mag and its color is 0.12 (Papaderos et al., 2002). With and for the C component, this gives and (1.18 and 1.13 respectively, after the Galactic extinction correction). These colors are substantially bluer (in , , and ) than those in the extended region around the main body, but similar to those in the SE cluster.
4 The Age of the Stellar Populations in I Zw 18
A substantial amount of work has been done to reconstruct the star-formation history (SFH) in I Zw 18 (Dufour et al., 1996b; Hunter & Thronson, 1995; Martin, 1996; Izotov & Thuan, 1998; Aloisi et al., 1999; Östlin, 2000; Legrand, 2000; Legrand et al., 2000; Recchi et al., 2002), and set limits on the age of its oldest stars. As discussed in the Introduction, there is no consensus, and the possibilities range from a low level of continuous star formation starting some 10 Gyr ago (Legrand et al., 2000), to a first star formation episode occurring several Gyr ago (Östlin, 2000), to an instantaneous burst of age 15 – 100 Myr (Dufour et al., 1996b). We examine here whether our deep NIR photometric data can put more stringent constraints on these different scenarios and on the age of the stars in I Zw 18.
4.1 Fitting the Broadband Colors: Models and Methods
In accordance with previous work (Aloisi et al., 1999; Östlin, 2000; Recchi et al., 2002), we consider a star-formation scenario consisting of two distinct episodes: a recent one which accounts for the young stellar population, and a prior one responsible for the older stars.
Both young and old stellar components were modelled with synthetic stellar spectral energy distributions (SEDs) produced using the galactic evolution code PEGASE.2 (Fioc & Rocca-Volmerange, 1997) for an instantaneous burst, with ages ranging between 0 and 10 Gyr, and a heavy element mass fraction = 1/50 . PEGASE.2 uses mainly the “Padova” stellar tracks as described in the PEGASE documentation; the tracks for were published by Fagotto et al. (1994). We adopted an initial mass function with a Salpeter slope ( = –2.35), and upper and lower mass limits of 120 and 0.1 . Synthetic SEDs for continuous star formation were then calculated by integration of instantaneous burst models over the specific time interval.
The ionized gas emission contribution to the total brightness is important in some regions in I Zw 18. To calculate the gaseous continuum SED region by region, the observed H flux and the electron temperature are derived from the optical spectra (Izotov et al., 1999). Then the gas continuum is calculated from the contribution of free-bound, free-free, and two-photon continuum emission for the spectral range from 0 to 5 m (Aller, 1984; Ferland, 1980). Observed emission lines are superposed on the gaseous continuum SED with intensities derived from spectra in the spectral range 3700 – 7500 Å. Outside this range, the intensities of emission lines (mainly hydrogen lines) are calculated from the extinction-corrected flux of H.
The predicted colors of both stars and gas are obtained by convolving the theoretical SEDs with the appropriate filter bandpasses. The transmission curves for the , , , , and bands are taken from Bessell (1990) and Bessell & Brett (1988). The zero points are from Bessell, Castelli & Plez (1998).
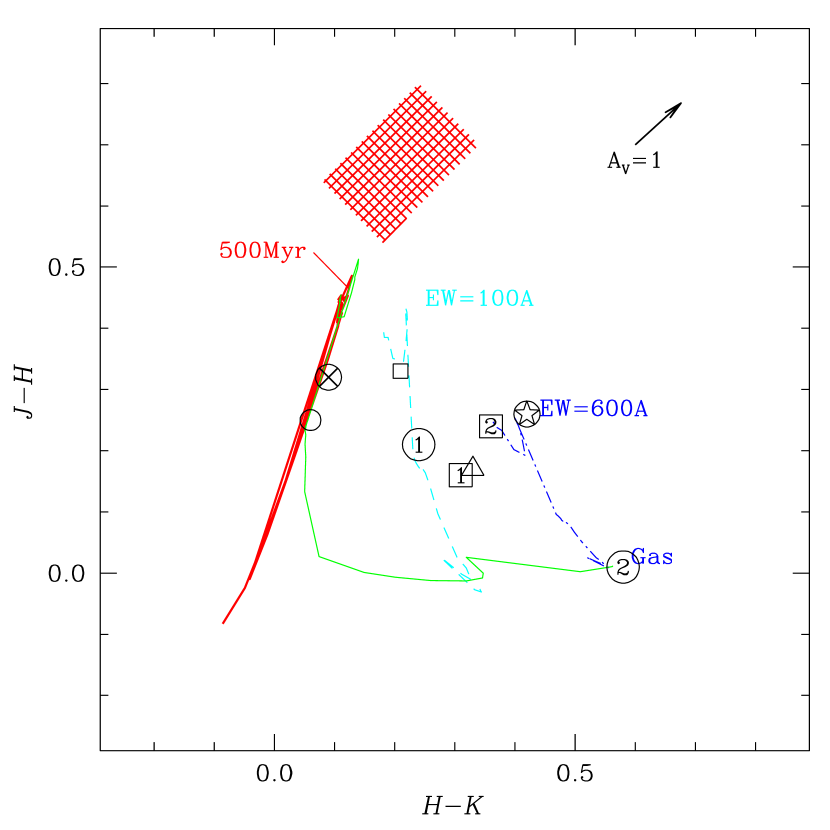
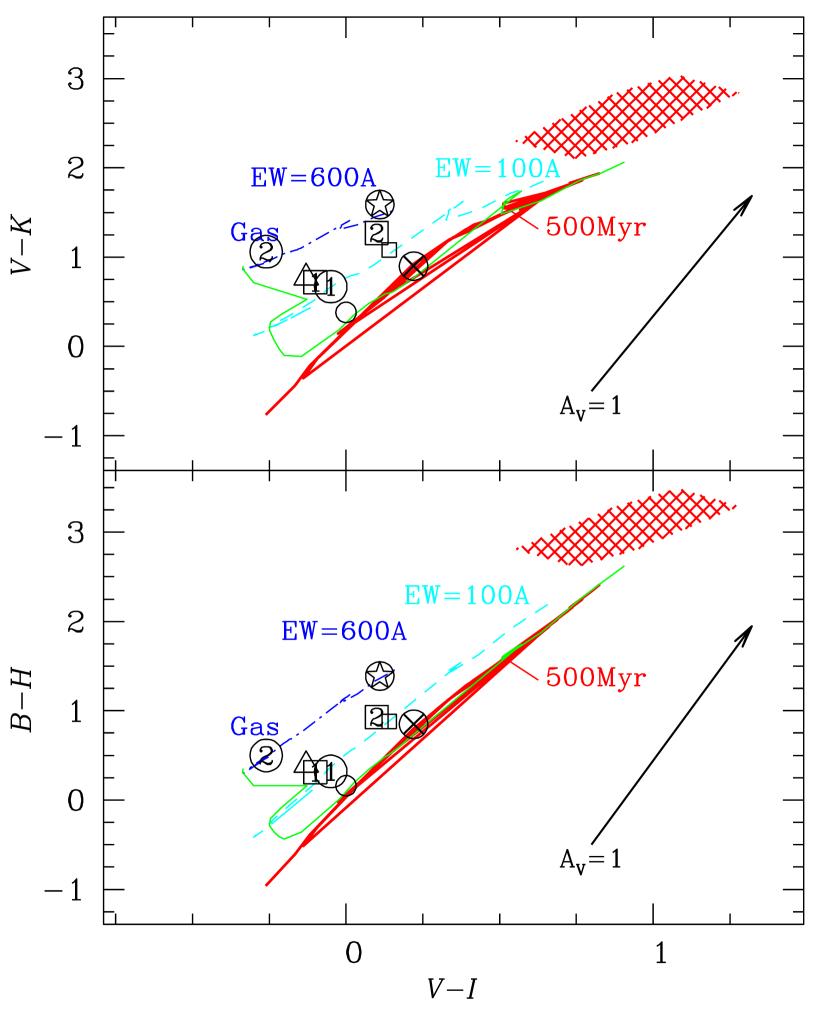
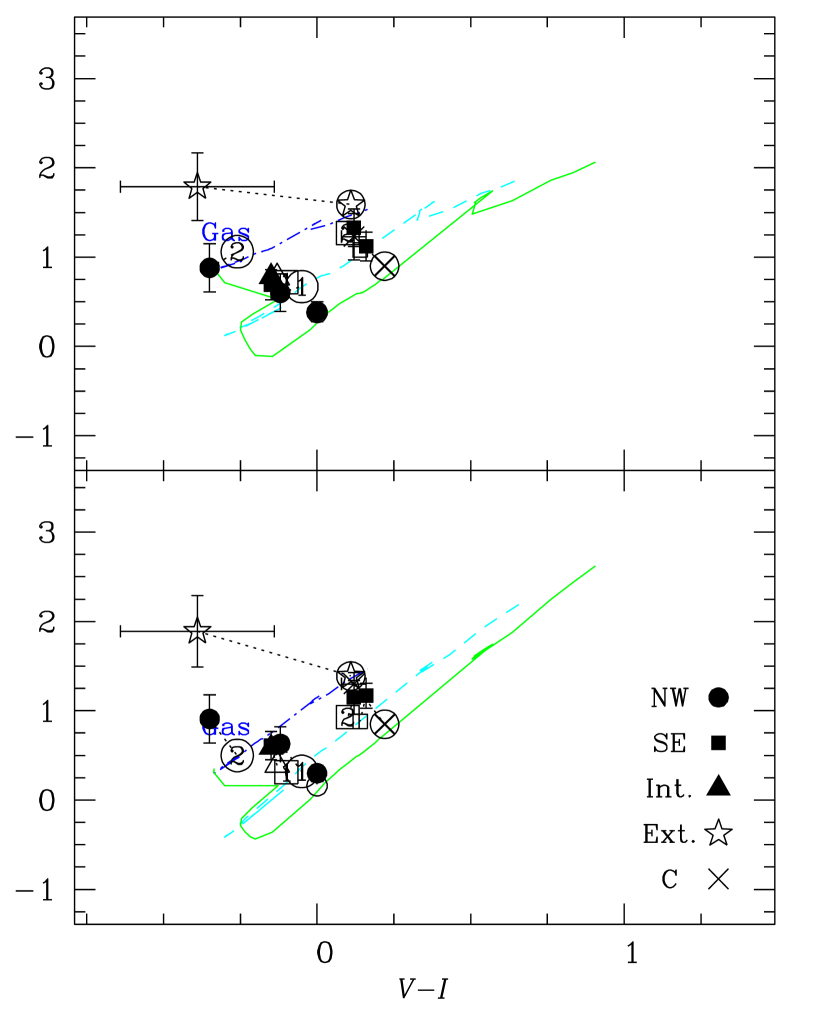
Generic colors of the young population only (instantaneous burst) are shown in the left panels of Figs. 6 (NIR colors) and 7 (optical and hybrid). Gas emission is taken into account in these curves by adding the observed gaseous SED from optical spectrophotometric observations of Izotov et al. (1999) to the calculated stellar SED of the younger population; its contribution is determined by the ratio of the observed equivalent width (EW) of the H emission line to the one expected for pure gaseous emission. The color-color tracks shown in Figs. 6 and 7 are those predicted by our instantaneous burst models for stellar populations with ages from 0 to 10 Gyr and for 1/50 metallicity, with line and continuum gaseous emission added. The relative intensities of the emission lines are taken to be the same as in the NW component. The short-dashed (cyan) line shows populations with fixed EW(H) = 100Å, and the dot-dashed line (blue) populations with EW(H) = 600Å. The light solid (green) line shows a scenario in which EW(H) changes self-consistently over time, namely the gaseous emission is defined by the ionizing flux of the stellar population; an age of 500 Myr is indicated with an arrow, with older ages being toward the red in both colors. These tracks differ from those calculated by Leitherer et al. (1999) mainly because they are characterized by a lower metallicity (1/50 ), and take line emission into account. Pure gaseous emission is denoted by “Gas”. Colors of continuous-burst stellar populations alone (without gas) are shown by heavy solid (red) lines. There are more than one of these (evident in Fig. 7) because we considered several initial and final burst ages; in the NIR these differences are insignificant, while in the opticalhybrid they are more pronounced. Also shown in the left panels as a grid are the NIR colors of normal spirals, taken from de Jong (1996).
The temporal evolution of the self-consistent model shows clearly the epoch where gas ceases to dominate the SED, since there is a sharp shoulder in the track, and the continuous-burst stars-only models converge with it. Red and blue and correspond to the youngest ages. There is an ambiguity in the hybrid colors since red (and to a lesser extent ) can be due to either gas or evolved stars. We will exploit the five independent colors at our disposal to resolve this ambiguity.
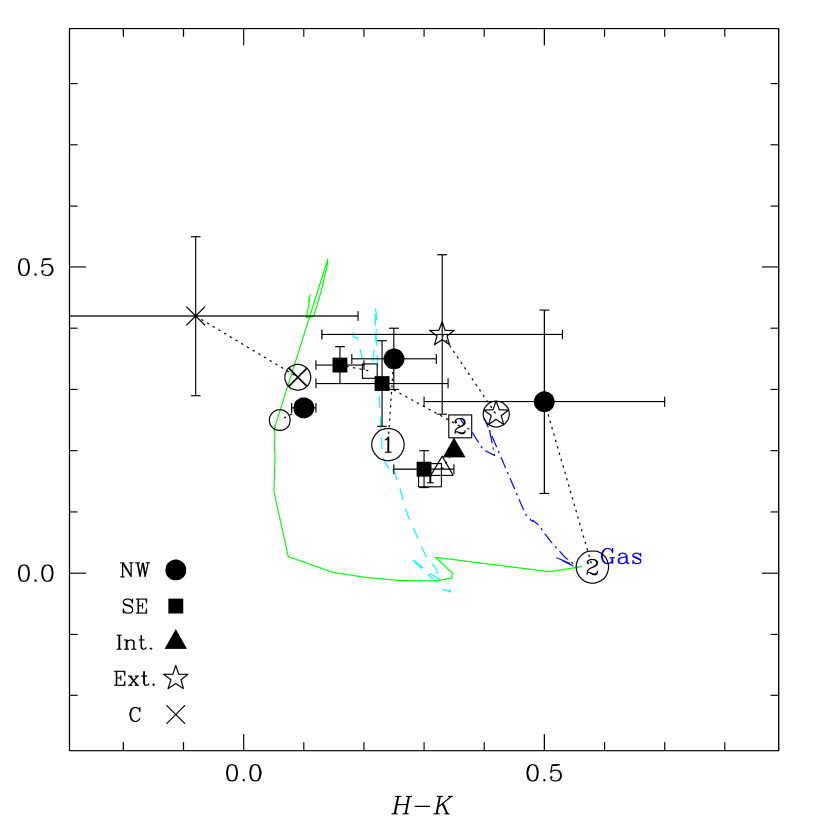
The observed color-color diagrams for the seven regions in the main body, the extended region around the main body, and the C component are shown in the right panels of Figs. 6 (NIR) and 7 (opticalhybrid). It is evident that the observed NIR and hybrid optical-NIR colors can be well reproduced by the models.
4.1.1 Constraints on the Old Stellar Population
To reconstruct the star formation history in I Zw 18 from its observed broadband colors, we proceed in the following manner. We first search the grid of synthetic models for the one which fits best the five broadband colors (, , , , and ) observed for the seven positions of aperture photometry in the main body of I Zw 18, the extended region around it, and the C component. In all cases, we modelled the old stellar population with a continuous episode of star formation, but considered both instantaneous and continuous scenarios for the young stellar population. The old stellar population, by definition, is composed of stars formed prior to the stars composing the young stellar population.
We derived the colors expected in each observing aperture by “mixing” curve calculations, usually used in connection with color-color diagrams. In such calculations, one starts with a “main” color associated with a physical component, in our case young instantaneous- or continuous-burst stellar populations. That color is then “mixed” with colors of other physical components, in our case continuous-burst older stars and gas emission (including both continuum and line emission as discussed above). Finally, foreground extinction is taken into account by reddening the “mixed” colors. Mathematically, the resulting colors do not depend on which component defines the “main” color.
For each region, we derived the model colors (, , , , and ) that best fit the observed ones by minimizing the . The uncertainties in the are the photometric uncertainties in the colors, obtained by adding in quadrature the photometric uncertainty of each filter. Color errors were constrained to be at least 0.05 mag because of possible systematic problems with HST/ground-based transformations. Free parameters in the model fitting include the age of the young stellar population and its burst mode of star formation (instantaneous or continuous), the age of the old stellar population (constrained to be a continuous burst), the luminosity fraction of old stars , the luminosity fraction of ionized gas , and the foreground visual extinction . Rather than fixing to the values derived from the Balmer decrement, we let vary in the fits, since ionized gas may be subject to a different extinction than the stellar emission (Calzetti et al., 1997).
However, fits performed in this way are unconstrained since we have five colors and five free parameters (six if the young-population burst scenario is included). Thus, to limit the parameter space to be explored, we had to impose additional observational constraints. One such constraint is the EWs of the H line at different locations in I Zw 18 (Izotov et al., 2001) which limits the range of ages the young stars can have. Furthermore, photometric studies of BCDs [e.g., Loose & Thuan (1986); Papaderos et al. (1996)], have shown that the same component of evolved stars is present in all regions within a galaxy. Therefore, we constrain the evolved stellar population to be the same everywhere in I Zw 18. To determine which ages are possible, we need to examine the colors of a region relatively free of the ionized gas emission known to be widespread in some parts of I Zw 18 (Izotov et al., 2001) and which contaminates the observed broadband colors. The C component is such a region; it has the lowest EW(H) of the I Zw 18 complex. Therefore, in principle, we can first fit the C component colors, without having to worry about gas contamination; then, the old stars in the I Zw 18 main body can be represented by the best-fit older stellar population in the C component. Such a procedure is supported by optical spectroscopy and imaging which suggest that star formation is oldest in the C component (age 100 – 200 Myr) and has propagated into the main body (Hunter & Thronson, 1995; Dufour et al., 1996b; Izotov & Thuan, 1998).
We therefore fit the C component by setting the gas fraction and extinction to zero, and letting the age of the young and old populations vary, together with the young-star burst scenario and the old-star fraction . By constraining the model prediction of the H EW in the burst scenario of the young population to be consistent with its observed value (20 – 60Å (Izotov et al., 2001)), we find the colors of the C component to be best fit by a young instantaneous-burst (IB) stellar population 15 Myr of age, with a dominant older stellar population of age 100–200 Myr. The second-best fit was obtained with a young continuous-burst (CB) 10–20 Myr of age, combined with of 100–200 Myr older stars. The third-best fit was similar to the best one, but with of a 20 Myr young population. These results are reported in Table 2.
The minimum value = 16.7 is obtained in the IB scenario, and gives a best fit with root-mean-square (RMS) residuals (over the five colors) of 0.21 mag, while the CB = 17.0 corresponds to an RMS of 0.23 mag. If we consider all the old stellar populations found in solutions with a value between and 1, we find that, in addition to the best-fit range of 100–200 Myr age, plausible other age ranges for the old stellar populations for I Zw 18 include 100–500 Myr, 10–200 Myr, 10–500 Myr, and 3–500 Myr. Although stars older than this gave substantially worse fits, to be conservative, and because the age of I Zw 18 is so controversial, we have included in the subsequent analysis the following additional older stellar populations: 3 Myr–1 Gyr, 100 Myr–1 Gyr, 0–1 Gyr, 100 Myr–2 Gyr. As a result, for the remaining main-body regions, we have considered a total of nine possible old stellar populations. Populations older than 2 Gyr are ruled out, since the values associated with them (together with the EW constraint on the young stars) were ranked at 600th in the best (IB) case. The worst of the older populations retained for further consideration (e.g., 2 Gyr) ranked 263rd.
4.1.2 The Young Stellar Populations, Gaseous Emission, and Extinction
We then fit the colors of each region in the main body of I Zw 18 by letting the age of the young stellar component vary, subject to EW constraints, as well as the parameters , , and . The old age and the burst scenario of the young population (IB or CB) was constrained to be the same for all regions. This was done for each of the ten different possible old stellar populations as defined above. We let each fraction in the mixing calculation vary from 0 to 1 in 10% increments, and let vary from 0 to 1, in increments of 0.1 mag. Therefore, considering all the possible young stellar populations (63), together with the nine candidate older populations, we calculated for each region 567,000 () sets of colors; with the two burst scenarios, we have considered more than a million color sets. summed over all five colors for each region was chosen from this ensemble. The global , , for a specific older stellar population and younger burst type was defined by summing over all regions (including the C component) the for each region at the particular older age (and younger burst type). The results are shown in Table 3, in order of increasing .
The optical and hybrid observed within a 2″ aperture are plotted together with the fitted colors in Figs. 6 and 7. In both figures, the best-fit colors are shown in both panels, and connected to the observed ones in the right panel with a dotted line. The fitted values for the five colors for each region can be seen to be consistent with those observed, within the observational errors.
4.2 Results
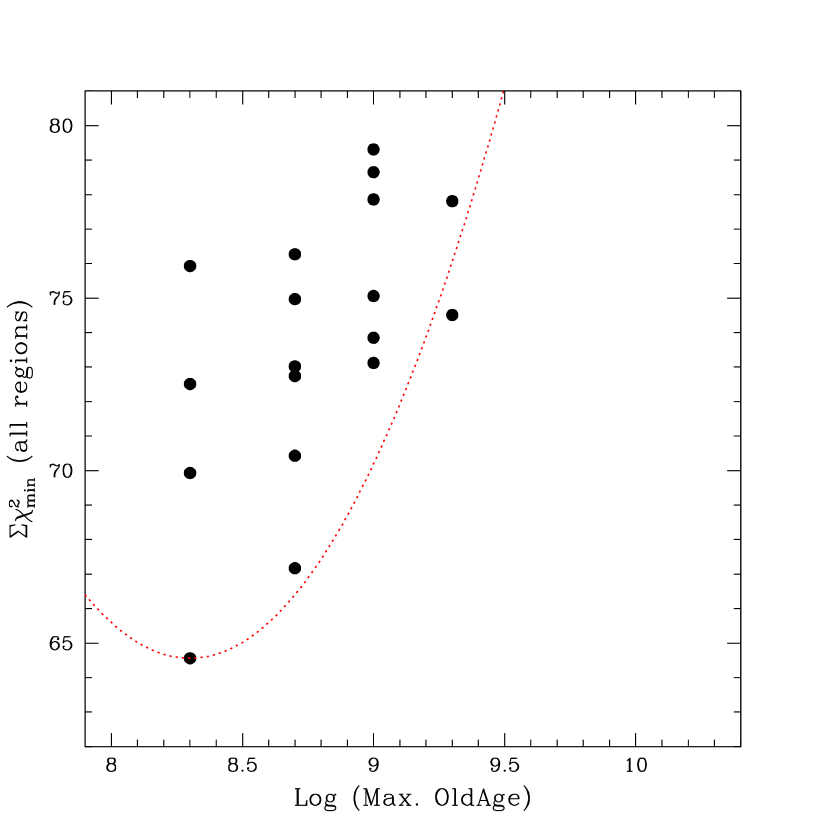
The best fit as given by the minimum in Table 3 is obtained for an underlying old stellar population of age 100–200 Myr. The values are plotted as a function of old population age in Fig. 8, where only the 18 lowest values are shown; these values are also reported in Table 3. The age in the plot is in fact the oldest age in the older stars, since there is ambiguity because of the numerous starting and ending CB times for the old burst in our model grids. Inspection of Fig. 8 shows the clear minimum for an older age of 200 Myr. Although the difference in between an oldest age of 200 Myr and 500 Myr is not significant enough for us to definitely exclude 500 Myr as the oldest age, we can definitely exclude an upper limit of 1 Gyr. In fact, the best fit with an oldest age of 1 Gyr is ranked 8th, and has with respect to . As for the burst scenario, our fits tend to suggest that an instantaneous burst rather than a continuous one is more likely for the younger population, since seven of the nine lowest values are for IBs.
Table 3 shows that, with two exceptions, the lowest also corresponds to the lowest regional . Hence, our requirement that the same evolved stellar population be present in all regions is not unduly constraining our results, since the condition is met naturally by our fits. One exception, NW2, is insignificant, since according to our fits it contains no evolved stars; consequently the resultant is insensitive to older age. The other exception (SE) reflects the difficulty of fitting a complex region with a simple model. The SE component shows the most spatially variable colors in the entire main body, and undoubtedly suffers from the effects of dust extinction.
The parameters of the best-fit model with an older population of age 100-200 Myr are given in Table 4. In all cases, the RMS residuals of the fits (Col. 6, 1st line) are smaller than or comparable to the RMS photometric uncertainties (Col. 6, 2nd line), suggesting that our fits are rather good approximations to the colors (see also Figs. 6 and 7). Inspection of Table 4 shows that the C component and the main SE cluster apparently host the highest fraction of evolved stars with = 0.6. The other regions have lower , with zero old stars in the farthest region to the NW (NW2); indeed 80% of the emission in NW2 is ionized gas. In the main body, the old-star fractions suggest that star formation has been proceeding the longest in the main clusters, SE and NW, since half or more of the light there can be attributed to a 100-200 Myr continuous burst.
The ages of the younger burst range from 3 Myr in the NW part of the main body to 10 Myr in most of the SE (with the exception of SE1 which has an age of 3 Myr). In the C component, the younger burst is older, with an age of 15 Myr or more (see also Table 3). Because of the gas emission, in most of the regions in the main body (with the exception of the NW cluster), young stars comprise less than half of the observed flux. The highest fraction of young stars is present in the NW star cluster (50%), while toward the SE, the fractions range from 10% to 30%. These results will be compared with previous work in 4.4.
4.3 Gas Contamination and Dust Reddening
We discuss here the evidence that the emission in many regions in I Zw 18 is dominated by gas and dust, rather than by old stars, and how neglecting this can affect the derived age.
4.3.1 Spatial Inhomogeneity of the Interstellar Medium
Table 4 shows that in the main body only the bright NW cluster is free of ionized gas. With the exception of the main NW cluster, all of the remaining regions contain a significant amount of ionized gas. As mentioned above, the gas fraction is highest to the NW (NW2), where 80% of its light is due to gas emission. This gas contribution is lowest in the SE, consistent with the relatively high fraction of evolved stars derived.
These results are compatible with the qualitative analysis in 3.1 and with other data. Deep Keck spectra of I Zw 18 obtained by Izotov et al. (2001) reveal extended gas emission around the NW component, with H emission detected as far as 30″ from it. The situation in the NW star cluster is contrary to this, since that region is only well fit by pure stellar emission, without any gas contribution. Our finding is also consistent with the H map of I Zw 18 which shows an apparent “hole” in the gas distribution at the location of the NW component (Cannon et al., 2002).
Extinction is also measurable in the main NW and SE clusters ( mag), and in the extended region. According to our fits, the light in the extended region surrounding the main body of I Zw 18 contains 40% evolved stars of age 100-200 Myr, and 60% gas, together with an extinction mag. The high and the large uncertainties777As mentioned in 2.3, these are the standard deviation over the ellipse. here reflect the difficulty of using an elliptical average, especially because in the NW2 region, the emission is 80% gas without a measurable contribution from an evolved stellar population, while in the SE, there appear to more old stars (40% of the light) and less gas.
In the SE region, is redder ( 0), as are the other colors, and, from Table 3, it appears that the color gradient evident in Fig. 5 is due to a population gradient, coupled with some extinction and a spatially-varying contribution from ionized gas. A greater extinction in the SE cluster is supported also by other data (Izotov & Thuan, 1998; Cannon et al., 2002): small-scale from the Balmer decrement in the SE region is 0.24 mag as compared to = 0.04 mag for the NW region. The slight difference between these and the results of our fits is almost certainly due to different aperture sizes and the spatially-varying interstellar medium (ISM).
Indeed, using the HST/WFPC2 extinction maps, Cannon et al. (2002) show that the H/H ratio varies considerably spatially, and show that such extinction can be produced by of dust. The structure in the extinction inferred from the recombination line ratios is very similar to the one seen in our optical/hybrid color images: the SE and the E side of the intermediate zone which are the most affected by extinction (see Figs.3, 2) are also the sites of the reddest colors. Cannon et al. speculate that there is a band of extinction between the NW and SE components, but are unable to measure it because of the absence of optical line emission. Our color images, in particular , reveal such a band, suggesting that much, if not all, of the structure seen in the colors is due to variations in the ISM, rather than to gradients in the stellar populations.
4.3.2 Color structure
The structure of the extended emission and the color gradients can also help understand its nature. As discussed in 3, the colors in I Zw 18 vary on small spatial scales. Such variations are not the smooth ones that would be expected for stellar population age gradients, but rather are patchy and inhomogeneous, common signatures of variations in dust extinction and gas emission. Indeed, the reddest structures in the colors are associated with compact sources rather than with smooth sheets of underlying red stars, which are conspicuously absent in our images.
Another signature of the ISM in I Zw 18 can be found from the comparison of the ground-based image with the HST/NICMOS F110W image. The difference – transformed (F110W–F160W) (see Sect. 2.1) is shown in the left panel of Fig. 9, with contours overlaid on the ground-based image. If the analytical transformation of Origlia & Leitherer (2000) holds, we would expect a difference between transformed F110W–F160W and to be close to zero; that is the case for the NW and “Inter.” regions of the main body. However, to the E of the intermediate region, to the SE and to the W of the NW star cluster, and to the S, the difference can be very negative. The highest (dark grey) contours correspond to a difference of mag, in the sense that the transformed F110W–F160W is redder than the ground-based .
The failure of the analytical color transformation is seen perhaps more clearly in the right panel of Fig. 9, where we have applied the color transformation to individual calibration stars, the seven discrete regions in the main body, and a field star in the image field-of-view. The field star is labelled “Star”, but is probably a galaxy (Östlin, 2000). The calibration stars and their photometry (shown by filled circles) were taken from the HST/NICMOS web page. It can be seen from the figure that the NW cluster and the “Star” obey the nominal transformation rather well, but the SE cluster and surroundings are highly discrepant: the transformed F110W–F160W is 0.5 mag redder than the true ground-based color. In NW2, the color is bluer than the transformed F110W–F160W consistent with slightly different gas fractions in the two sets of colors.
In general, the largest differences are located in the regions with the reddest colors. The spatial structure of these regions in the NIR images is very similar to that of the hybrid color images. These differences are good tracers of gas emission and dust extinction because, while the color transformation from F110W–F160W to is valid for normal stars, it fails where the colors are contaminated by other processes. That the ISM is at least partly responsible for the large differences is particularly evident in the negative region to the W of the NW brightness peak: this site has one of the largest H equivalent widths (Izotov et al., 2001) in I Zw 18.
Gaseous emission (including lines) may not affect ground-based much, since its , although it may make the color slightly bluer. However, the sensitivity to extinction of F110W–F160W is 0.3 (Holtzman et al., 1995), more than 3 times that of ground-based . The opposing effects of gas (which makes bluer) and dust extinction (which reddens the colors) make it difficult to quantify their combined effects. We can only emphasize that if these effects are not taken into account in the interpretation of the observed colors, the inferred age for the stellar populations may be incorrect.
4.3.3 Gas Emission and its Effect on Color Fitting
To better assess gas contamination and its effect on the fit results, we have estimated the gas fractions colors in the NW and SE clusters using two different techniques: 1) from the optical recombination line ratios [e.g., Izotov & Thuan (1998)] and assuming zero extinction, infer the NIR line fluxes and gas continuum; 2) from our new NIR spectra obtained at the Keck and UKIRT telescopes (Hunt et al., in preparation), measure the NIR recombination lines and infer the gas emission in the photometric filters. For (1), we have used the recipes of Joy & Lester (1988) to derive the gas continuum emission in the spectroscopic apertures (NW 4215, SE 3615). The extrapolation from the optical gives slightly lower gas fractions (15% in the SE and 5% in the NW) than our NIR spectra (SE: 32%, NW: 22%), however the former do not take line emission into account. Both strategies give results which are roughly consistent with each other, and broadly consistent with the results from the color fits, especially considering the different aperture sizes and orientations. The spectroscopic apertures are larger than the photometric ones and unequal (NW is larger than SE), and the spectroscopic slit was oriented at a slightly different angle (PA = 139∘) than our photometric cut (PA = 149∘). The larger gas fractions measured by our new NIR spectra relative to the optical extrapolations may also suggest a larger extinction. In spite of these caveats, the important result is that both techniques confirm spectroscopically that the SE cluster is more contaminated by gas than the NW, corroborating the results of our fits.
To determine if the age of the evolved stars inferred from our fits depends sensitively on our treatment of gas emission, we also ran a series of stars-only fits, that is to say without including the contribution of gas emission to the model colors. Although the resulting region values were much larger ( ), the maximum ages for the older stellar population remain 200-500 Myr. Moreover, these stars-only fits give the same ranking for the older stellar populations: namely the was found for an IB of age 100-200 Myr, with the next smallest value given by one of age 100-500 Myr.
To ascertain if the age of the evolved stars inferred from our fits depends on which colors are fit, we repeated the stars-only fits on different subsets of colors. We first eliminated one or both of the hybrid colors and from the fits, since these colors are presumably the most sensitive to red old populations. However, the results do not change: we obtain the same upper limit to the older age of 200-500 Myr, and the ranking of the fits is the same as with all five colors
We then eliminated from the fits, and again modelled the four remaining colors (now two hybrid ones and two NIR) without including gas emission. This was done for two external regions (Exten., SE2) with red colors (, , and ) so that we could effectively check the case most favorable for evolved stars. It turns out that eliminating this purely optical color from the fits significantly changes the estimate for the old age in these two regions. Without , the age of the evolved stars becomes 100Myr-2Gyr; becomes unity for the extended region and 0.7 for SE2 (instead of 0.4). The reason for this is that the of the gas is extremely blue () relative to old stars (), while the 888These colors all refer to stellar populations and ionized gas. () and () of the gas are similar to those of evolved stars (, ). Therefore, hybrid colors can be equally well fit by gas and evolved stars; red and are ambiguous since ionized gas and old stars are similarly red. Thus they cannot be used to discriminate gas from evolved stars in galaxies such as I Zw 18. on the other hand is a good discriminator since gas and evolved stellar colors differ by mag. It is clear that had we not included gas emission in our fits, and avoided incorporating , we would have concluded that the stellar populations in I Zw 18 are 2 Gyr old. This age is a factor of four greater than our most stringent upper limit.
4.4 Comparison with Previous Work on I Zw 18
We have shown in the preceding sections that the optical, NIR and hybrid colors of all regions in I Zw 18 can be explained by an underlying stellar population not older than 500 Myr, when the effects of gaseous emission and dust on the colors are taken into account, and when a full set of colors, including , is incorporated in the modelling. This relatively young age is in disagreement with the findings of Östlin (2000) who found a number of red stars in the CMD obtained from HST/NICMOS images which he identified as AGB stars. Converting the HST F110W–F160W to using the analytical transformation described in §4.3.2, comparing with isochrones from Bertelli et al. (1994), and taking into account photometric errors, Östlin argued that an age of at least 1 Gyr for I Zw 18 is necessary to explain the NICMOS CMD. Moreover, an age of 125 Myr was attributed to the unresolved stars in the SE complex, with a younger age of 20 100 Myr in the NW region.
The old age of I Zw 18 inferred by Östlin (2000) is based on 23 stars in the NICMOS CMD with F110W–F160W (see his Fig. 3). While our model fits also suggest that the SE component is older than the NW one, in agreement with the findings of Aloisi et al. (1999) (see below), our data would not reveal such a small fraction of red stars. In the mean, each of these stars has a magnitude of 23.5 mag in the F110W filter, with the reddest stars being the faintest. Summing the luminosity of these red stars, we obtain a total F110W mag of 20.1 which, assuming F110W, is only 2% of the total luminosity in I Zw 18. Such a small fraction is below the detectability limits of our observations, because of the worse ground-based resolution as compared to that of HST , and because of the low impact on the colors over scales of 05.
The mass contribution from such stars is small. Assuming the ratio of an evolved population ( 1 Gyr) to be 1.1 in solar units (see, e.g., Moriondo et al. (1998)), and that of intermediate-age (100 – 500 Myr) and young stars ( 50 Myr) to be respectively 0.5 and 0.1, we calculate the fraction of the total stellar mass that can be in the form of old stars in the NICMOS CMD. To conservatively account for incompleteness, we assign 4% of the total stellar light to an old stellar population of age 1 Gyr, twice as large as the 2% fraction observed in the CMD. Using the fractions in Table 4, we then adjust the light of the intermediate-age population (by subtracting 0.04 from ), and calculate for each region the fraction of the stellar mass that could reside in old stars. We do not consider those regions where gas contributes more than 70% to the light. We find that the total stellar mass in I Zw 18 in old stars could be at most 22%; this high fraction is found in the SE1 and Inter. regions where half or more of the light comes from young stars. If we consider an extreme case (not supported by our data), with no gas and 70% of the light in young stars, the 4% light fraction in old stars would correspond to 18% of the stellar mass. Thus, even in the least favorable scenario, the stellar mass fraction in old stars does not exceed 20%.
With deep ground-based CCD and NIR images of I Zw 18, Kunth & Östlin (2000) find evidence for a color that increases with radius, reaching at = 10″. They attribute the red color to a stellar population with an age of more than 1 Gyr. While we confirm the color trend (see Figs. 4 and 5), we disagree with the interpretation. Our five-color fits are more consistent with a substantial (60-80%) contribution from ionized gas in the extended regions. As mentioned above, this is because we have included the color in our fits; without the color, the red color mimics stars of age 1 Gyr. A recent photometric analysis including optical colors by Papaderos et al. (2002) also finds the extended regions surrounding I Zw 18 to be highly contaminated by gas. Taking the gas emission into account, and with an independent analysis, they also derive an upper limit of 500 Myr for the age of I Zw 18.
We next compare our findings to those of Aloisi et al. (1999) who found, from their CMD study of HST/WFPC2 images, evidence for two bursts. The first, older episode, “started any time between 1 and 0.2 Gyr ago”, while the second, more recent, one has an age between 15 and 20 Myr. Given that they deliberately excluded the brightest Hii regions and unresolved star clusters from their analysis, their age estimate of the of the young burst and ours agree rather well. However, the older age estimate depends on the distance adopted for I Zw 18. The difference between our older age estimate of 500 Myr and their upper limit of 1 Gyr could be reduced if the distance to I Zw 18 were 12.6 Mpc (Östlin, 2000) instead of 10 Mpc as they assumed. Aloisi et al. (1999)’s derived age of 200 Myr for the C component (with large error bars as the data are of limited sensitivity) is in good agreement with our result.
Recent work on the chemical abundances and the star-formation history in I Zw 18 has also suggested that there were two bursts of star formation, one which occurred 300 Myr ago, and a young one with age of 4-7 Myr (Recchi et al., 2002). Our age estimates of the two stellar populations in I Zw 18 are in very good agreement with these ages. Considering the two radically different approaches, this is a strong confirmation of the young age ( 500 Myr) of the oldest major stellar population in I Zw 18.
5 Conclusions
We have presented deep UKIRT images of the Blue Compact Dwarf I Zw 18 and analyzed these images in conjunction with archival HST/WFPC2 optical images. By dividing the main body into eight different regions, and fitting five broadband colors with evolutionary synthesis models to these and the C component, we are able to set an upper limit to the age of the major component of the old stellar population in I Zw 18. We find the following:
-
1.
The oldest major stellar population in I Zw 18, contributing 78% of its mass, is at most 500 Myr old. Within the uncertainties of our data, by fitting the optical, NIR, and optical-NIR colors with evolutionary synthesis models of various star formation histories we are able to set an upper limit of 500 Myr for the age of the oldest stars in this major component. However, our data are insensitive to as much as a 22% contribution in mass (4% in light) from stars older than 500 Myr in I Zw 18.
-
2.
The young stellar populations in the main body of I Zw 18 and the C component range from 3 to 15 Myr in age. The largest fractions of older stars appear to be found in the C component and in the SE star cluster; in the remaining regions, young stars and gas contribute half or more of the observed light.
-
3.
The observed broadband colors in most regions of I Zw 18 are significantly affected by ionized gas emission and dust extinction. Red , , and are not reliable indicators of old stellar populations with red colors because ionized gas emission is also red. , on the other hand, reliably separates stars from gas because the color of stars is red ( 0.4) while that of gas is blue ( –0.4).
Thus the question of the age of I Zw 18 is not settled by our deep NIR observations. While we have shown that the oldest major stellar population in I Zw 18 is at most 500 Myr old, we cannot exclude the possibility that as much as 22% of the mass of I Zw 18 is contributed by stars older than 500 Myr. The advent of the Advanced Survey Camera (ACS) on HST will allow to settle definitively the debate. Deep ACS images with higher spatial resolution and sensitivity than WFPC2 will enable detection of or at least constrain the red giant branch (RGB) stellar population in I Zw 18. If RGB stars are not detected, then we can set an upper limit for the age of I Zw 18 to be less than 1 Gyr. If they are detected, I Zw 18 is not young, and the RGB tip can be used to derive its distance.
References
- Aller (1984) Aller, L. H. 1984, Physics of Thermal Gaseous Nebulae (Dordrecht: Reidel)
- Aloisi et al. (1999) Aloisi, A., Tosi, M., & Greggio, L. 1999, AJ, 118, 302
- Bertelli et al. (1994) Bertelli, G., Bressan, A., Chiosi, C., Fagotto, F., & Nasi, E. 1994, A&AS, 106, 275
- Bessell (1990) Bessell, M. S. 1990, PASP, 102, 1181
- Bessell & Brett (1988) Bessell, M. S., & Brett, J. M. 1988, PASP, 100, 1134
- Bessell, Castelli & Plez (1998) Bessell, M. S., Castelli, F., & Plez, B. 1998, A&A, 333, 231
- Calzetti et al. (1997) Calzetti, D., Meurer, G., Bohlin, R. C., Garnett, D. R., Kinney, A. L., Leitherer, C., & Storchi-Bergmann, T. 1997, AJ, 114, 1834
- Cannon et al. (2002) Cannon, J. M., Skillman, E. D., Garnett, D. R., & Dufour, R. J. 2002, ApJ, 565, 931
- Cardelli et al. (1989) Cardelli, J. A., Clayton, G. C., & Mathis, J. S. 1989, ApJ, 345, 245
- de Jong (1996) de Jong, R.S. 1996, A&A, 313, 45
- Dey et al. (1998) Dey, A., Spinrad, H., Stern, D., Graham, J. R., & Chaffee, F. H. 1998, ApJ, 498, 93
- Dufour et al. (1996a) Dufour, R. J., Esteban, C., & Castañeda, H. O. 1996a, ApJ, 471, L87
- Dufour et al. (1996b) Dufour, R. J., Garnett, D. R., Skillman, E. D., & Shields, G. A. 1996b, in ASP Conference Series 98, From Stars to Galaxies, ed. C. Leitherer, U. Fritze-v.Alvensleben, & J. Huchra (San Francisco: ASP), 358
- Fagotto et al. (1994) Fagotto, F., Bressan, A., Bertelli, G., & Chiosi, C. 1994, A&AS, 104, 365
- Ferland (1980) Ferland, G. J. 1980, PASP, 92, 596
- Fioc & Rocca-Volmerange (1997) Fioc, M., & Rocca-Volmerange, B. 1997, A&A, 326, 950
- Garnett et al. (1997) Garnett, D. R., Skillman, E. D., Dufour, R. J., & Shields, G. A. 1997, ApJ, 481, 174
- Girardi & Bertelli (1998) Girardi, L., & Bertelli, G. 1998, MNRAS, 300, 533
- Girardi et al. (2000) Girardi, L., Bressan, A., Bertelli, G., & Chiosi, C. 2000, A&AS, 141, 371
- Hawarden et al. (2001) Hawarden, T. G., Leggett, S. K., Letawsky, M. B., Ballantyne, D. R., & Casali, M. M. 2001, MNRAS, 325, 563
- Holtzman et al. (1995) Holtzman, J. A., Burrows, C. J., Casertano, S., Hester, J. J., Trauger, J. T., Watson, A. M., & Worthey, G. 1995, PASP, 107, 1065
- Hunter & Thronson (1995) Hunter, D. A., & Thronson, H. A., Jr. 1995, ApJ, 452, 238
- Izotov & Thuan (1998) Izotov, Y. I., & Thuan, T. X. 1998, ApJ, 497, 227
- Izotov & Thuan (1999) Izotov, Y. I., & Thuan, T. X. 1999, ApJ, 511, 639
- Izotov & Thuan (2002) Izotov, Y. I., & Thuan, T. X. 2002, ApJ, 567, 875
- Izotov et al. (1999) Izotov, Y. I., Chaffee, F. H., Foltz, C. B., et al. 1999, ApJ, 527, 757
- Izotov et al. (2001) Izotov, Y. I., Chaffee, F. H., Foltz, C. B., et al. 2001, ApJ, 566, 222
- Joy & Lester (1988) Joy, M., & Lester, D. F. 1988, ApJ, 331,145
- Kunth & Östlin (2000) Kunth, D., & Östlin, G. 2000, A&A Rev., 10, 1
- Kunth & Östlin (2001) Kunth, D., & Östlin, G. 2001, A&AS, 277, 281
- Legrand (2000) Legrand, F. 2000, A&A, 354, 504
- Legrand et al. (2000) Legrand, F., Kunth, D., Roy, J. R., Mas-Hesse, J. M., & Walsh, J. R., 2000, A&A, 355, 891
- Leitherer et al. (1999) Leitherer, C., Schaerer, D., Goldader, J. D., et al. 1999, ApJS, 123, 3
- Loose & Thuan (1986) Loose, H.-H., & Thuan, T. X. 1986, in Star Forming Dwarf Galaxies and Related Objects, ed. D. Kunth, T. X. Thuan & J. T. T. Van (Gif-sur-Yvette: Edition Frontières), 73
- Martin (1996) Martin, C. L. 1996, ApJ, 465, 680
- Moriondo et al. (1998) Moriondo, G., Giovanardi, C., & Hunt, L. K. 1998, A&A, 339, 409
- Origlia & Leitherer (2000) Origlia, L., & Leitherer, C. 2000, AJ, 119, 2018
- Östlin (2000) Östlin, G. 2000, ApJ, 535, L99
- Östlin et al. (1996) Östlin, G., Bergvall, N., & Rönnback, J. 1996, in The Interplay Between Massive Star Formation, the ISM and Galaxy Formation, ed. D. Kunth, B. Guiderdoni, M. Heydari-Malayeri, & T. X. Thuan (Gif-sur-Yvette: Edition Frontières), 605
- Papaderos et al. (1996) Papaderos, P., Loose, H.-H., Thuan, T. X., & Fricke, K. J. 1996, A&A, 120, 207
- Papaderos et al. (2002) Papaderos, P., Izotov, Y. I., Thuan, T. X., et al. 2002, A&A, 393, 461
- Papovich et al. (2001) Papovich, C., Dickinson, M., & Ferguson, H.C. 2001, ApJ, 559, 620
- Recchi et al. (2002) Recchi, S., Matteucci, F., D’Ercole, A., & Tosi, M. 2002, A&A, 384, 799
- Sargent & Searle (1970) Sargent, W. L. W., & Searle, L. 1970, ApJ, 162, 155
- Searle & Sargent (1972) Searle, L., & Sargent, W. L. W. 1972, ApJ, 173, 25
- Schlegel et al. (1998) Schlegel, D. J., Finkbeiner, D. P., & Davis, M. 1998, ApJ, 500, 525
- Steidel et al. (1996) Steidel, C. C., Giavalisco, M., Pettini, M., Dickinson, M., & Adelberger, K. L. 1996, ApJ, 462, 17
- Telles & Terlevich (1997) Telles, E., & Terlevich, R. 1997, MNRAS, 286, 183
- Thuan et al. (1997) Thuan, T. X., Izotov, Y. I., & Lipovetsky, V. A. 1997, ApJ, 477, 661
- Thuan et al. (1999) Thuan, T.X., Sauvage, M., & Madden, S. 1999, ApJ, 516, 783
- van Zee et al. (1998) van Zee, L., Westpfahl, D., Haynes, M., & Salzer, J. 1998, AJ, 115, 1000
- Vidal-Madjar et al. (2000) Vidal-Madjar, A., Kunth, D., Lecavelier des Etangs, A., et al. 2000, ApJ, 538, L77
- Zwicky (1966) Zwicky, F. 1966, ApJ, 143, 192

| Aperture | |||||||
|---|---|---|---|---|---|---|---|
| Region | (″) | F555WaaThe values of F555W, , and have not been transformed to ground-based photometry in this table; for reasons of brevity, has been used to denote F439W, for F555W, and for F814W. Colors here have not been corrected for Galactic extinction. | aaThe values of F555W, , and have not been transformed to ground-based photometry in this table; for reasons of brevity, has been used to denote F439W, for F555W, and for F814W. Colors here have not been corrected for Galactic extinction. | aaThe values of F555W, , and have not been transformed to ground-based photometry in this table; for reasons of brevity, has been used to denote F439W, for F555W, and for F814W. Colors here have not been corrected for Galactic extinction. | |||
| NW2 | 2 | 21.178 ( 0.003) | 21.124 ( 0.405) | 21.035 ( 0.481) | 20.258 ( 0.420) | -0.400 | 0.743 |
| 3 | 20.130 ( 0.002) | 20.055 ( 0.248) | 19.776 ( 0.269) | 19.270 ( 0.267) | -0.368 | 0.928 | |
| 4 | 19.252 ( 0.001) | 19.226 ( 0.169) | 18.949 ( 0.183) | 18.456 ( 0.183) | -0.316 | 0.821 | |
| NW1 | 2 | 19.316 ( 0.001) | 19.315 ( 0.176) | 18.970 ( 0.186) | 18.722 ( 0.208) | -0.128 | 0.635 |
| 3 | 18.382 ( 0.001) | 18.343 ( 0.113) | 17.969 ( 0.117) | 17.795 ( 0.135) | -0.026 | 0.645 | |
| 4 | 17.743 ( 0.001) | 17.662 ( 0.083) | 17.317 ( 0.087) | 17.143 ( 0.100) | -0.019 | 0.591 | |
| NW | 2 | 17.709 ( 0.001) | 17.681 ( 0.083) | 17.413 ( 0.091) | 17.318 ( 0.109) | 0.004 | 0.298 |
| 3 | 17.300 ( 0.001) | 17.179 ( 0.066) | 16.906 ( 0.072) | 16.778 ( 0.085) | -0.011 | 0.428 | |
| 4 | 17.049 ( 0.001) | 16.894 ( 0.058) | 16.618 ( 0.063) | 16.457 ( 0.073) | -0.033 | 0.506 | |
| 6 | 16.772 ( 0.001) | 16.568 ( 0.050) | 16.303 ( 0.055) | 16.054 ( 0.061) | -0.067 | 0.603 | |
| 8 | 16.611 ( 0.001) | 16.357 ( 0.045) | 16.080 ( 0.049) | 15.824 ( 0.055) | -0.058 | 0.696 | |
| 10 | 16.481 ( 0.001) | 16.190 ( 0.042) | 15.914 ( 0.045) | 15.643 ( 0.050) | -0.061 | 0.750 | |
| 16 | 16.244 ( 0.001) | 15.872 ( 0.036) | 15.578 ( 0.039) | 15.315 ( 0.043) | -0.067 | 0.894 | |
| 20 | 16.218 ( 0.001) | 15.815 ( 0.035) | 15.506 ( 0.038) | 15.271 ( 0.042) | -0.078 | 0.953 | |
| Int. | 2 | 19.125 ( 0.001) | 18.955 ( 0.150) | 18.720 ( 0.165) | 18.356 ( 0.175) | -0.154 | 0.592 |
| 3 | 18.238 ( 0.001) | 18.007 ( 0.096) | 17.766 ( 0.107) | 17.445 ( 0.115) | -0.098 | 0.592 | |
| 4 | 17.547 ( 0.001) | 17.331 ( 0.071) | 17.074 ( 0.078) | 16.812 ( 0.086) | -0.055 | 0.584 | |
| SE | 2 | 19.352 ( 0.001) | 18.723 ( 0.134) | 18.383 ( 0.142) | 18.223 ( 0.165) | 0.170 | 1.174 |
| 3 | 18.615 ( 0.001) | 18.074 ( 0.099) | 17.750 ( 0.106) | 17.532 ( 0.120) | 0.073 | 1.086 | |
| 4 | 18.041 ( 0.001) | 17.584 ( 0.079) | 17.301 ( 0.086) | 17.042 ( 0.096) | 0.012 | 0.975 | |
| 6 | 17.373 ( 0.001) | 16.910 ( 0.058) | 16.645 ( 0.063) | 16.352 ( 0.069) | -0.035 | 0.972 | |
| 8 | 16.808 ( 0.001) | 16.386 ( 0.046) | 16.110 ( 0.050) | 15.850 ( 0.055) | -0.030 | 0.864 | |
| 10 | 16.465 ( 0.001) | 16.077 ( 0.039) | 15.779 ( 0.042) | 15.550 ( 0.048) | -0.008 | 0.842 | |
| 16 | 16.246 ( 0.001) | 15.854 ( 0.036) | 15.547 ( 0.038) | 15.313 ( 0.043) | -0.047 | 0.910 | |
| 20 | 16.221 ( 0.001) | 15.815 ( 0.035) | 15.509 ( 0.038) | 15.275 ( 0.042) | -0.061 | 0.954 | |
| SE1 | 2 | 19.041 ( 0.001) | 18.837 ( 0.141) | 18.665 ( 0.161) | 18.359 ( 0.175) | -0.160 | 0.610 |
| 3 | 18.470 ( 0.001) | 18.163 ( 0.103) | 17.962 ( 0.117) | 17.632 ( 0.126) | -0.108 | 0.718 | |
| 4 | 18.137 ( 0.001) | 17.714 ( 0.084) | 17.459 ( 0.093) | 17.193 ( 0.103) | -0.053 | 0.901 | |
| SE2 | 2 | 21.439 ( 0.004) | 20.409 ( 0.291) | 20.141 ( 0.318) | 19.763 ( 0.334) | 0.145 | 1.183 |
| 3 | 20.118 ( 0.002) | 19.323 ( 0.177) | 19.020 ( 0.190) | 18.788 ( 0.213) | 0.121 | 1.149 | |
| 4 | 19.358 ( 0.001) | 18.645 ( 0.129) | 18.401 ( 0.143) | 18.137 ( 0.158) | 0.077 | 1.082 | |
| C component | |||||||
| C(SE) | 2 | 20.944 ( 0.062) | 20.792 ( 0.240) | 20.643 ( 0.334) | |||
| 3 | 20.475 ( 0.060) | 19.979 ( 0.169) | 20.046 ( 0.288) | ||||
| 4 | 20.072 ( 0.056) | 19.564 ( 0.154) | 19.365 ( 0.205) | ||||
| C(NW) | 2 | 21.414 ( 0.096) | 20.830 ( 0.248) | 20.745 ( 0.367) | |||
| 3 | 20.729 ( 0.076) | 20.059 ( 0.183) | 20.232 ( 0.342) | ||||
| 4 | 20.209 ( 0.063) | 19.560 ( 0.154) | 19.633 ( 0.263) | ||||
| C(Int.=Tot.) | 2 | 21.216 ( 0.080) | 20.888 ( 0.261) | 20.381 ( 0.263) | 0.328 | 0.507 | |
| 3 | 20.363 ( 0.055) | 19.872 ( 0.153) | 19.705 ( 0.211) | ||||
| 4 | 19.909 ( 0.048) | 19.457 ( 0.140) | 19.253 ( 0.186) | ||||
| 6 | 19.433 ( 0.046) | 18.999 ( 0.137) | 18.820 ( 0.186) | ||||
| 8 | 19.145 ( 0.047) | 18.568 ( 0.123) | 18.470 ( 0.239) | ||||
| 10 | 18.831 ( 0.044) | 18.313 ( 0.121) | 18.270 ( 0.304) | ||||
| 16 | 19.20bbFrom Papaderos et al. (2002). (0.100) | 18.311 ( 0.044) | 17.888 ( 0.132) | 17.971 ( 0.257) | 0.12bbFrom Papaderos et al. (2002). | 1.30 | |
| Old AgebbEvolved population colors assume a continuous star-formation scenario. | Young AgeccScenarios refer to the young population. | RMS (mag)ddRoot-mean-square residual (in mag) averaged over all five colors. | ||
|---|---|---|---|---|
| Young Instantaneous Burst (IB)ccScenarios refer to the young population. | ||||
| 100-200Myr | 15Myr | 0.6 | 16.7 | 0.21 |
| 20Myr | 0.5 | 17.3 | 0.19 | |
| 100-500Myr | 15Myr | 0.6 | 17.4 | 0.22 |
| 10-200Myr | 15Myr | 0.9 | 17.5 | 0.18 |
| 20Myr | 0.8 | 17.7 | 0.20 | |
| 100-500Myr | 20Myr | 0.5 | 17.8 | 0.19 |
| 10-500Myr | 15Myr | 0.7 | 17.8 | 0.22 |
| 3-500Myr | 15Myr | 0.8 | 17.9 | 0.19 |
| 10-500Myr | 20Myr | 0.6 | 18.1 | 0.20 |
| 3-500Myr | 20Myr | 0.7 | 18.2 | 0.19 |
| Young Continuous Burst (CB)ccScenarios refer to the young population. | ||||
| 100-200Myr | 10-20Myr | 0.6 | 17.0 | 0.23 |
| 10-20Myr | 0.7 | 17.4 | 0.16 | |
| 10-200Myr | 10-20Myr | 0.9 | 17.4 | 0.19 |
| 3-500Myr | 10-20Myr | 0.8 | 17.6 | 0.20 |
| 100-200Myr | 15-20Myr | 0.5 | 17.6 | 0.22 |
| 100-500Myr | 10-20Myr | 0.6 | 17.7 | 0.23 |
| 10-200Myr | 15-20Myr | 0.8 | 17.7 | 0.21 |
| 100-500Myr | 10-20Myr | 0.7 | 17.8 | 0.16 |
| 100-200Myr | 15-20Myr | 0.6 | 17.9 | 0.17 |
| 10-500Myr | 10-20Myr | 0.7 | 17.9 | 0.23 |
| Old AgebbAll evolved population colors assume a continuous star-formation scenario. | NW2 | NW1 | NW | Inter. | SE | SE1 | SE2 | Ext. | C Comp. | cc (over all five colors) summed over all regions. There may be small discrepancies with respect to the sum of the values in the second line, because of numerical round-off in the latter. |
|---|---|---|---|---|---|---|---|---|---|---|
| 100-200Myr (IB)ddThe scenarios refer to the young population. | 3Myr | 3Myr | 3Myr | 3Myr | 10Myr | 3Myr | 10Myr | 10Myr | 15Myr | 64.6 |
| 12.4 | 13.0 | 1.9 | 2.1 | 3.0 | 5.6 | 2.9 | 6.8 | 16.7 | ||
| 100-500Myr (IB) | 3Myr | 3Myr | 3Myr | 3Myr | 3Myr | 3Myr | 10Myr | 10Myr | 15Myr | 67.2 |
| 12.4 | 14.2 | 2.1 | 2.4 | 2.8 | 5.7 | 3.1 | 7.0 | 17.4 | ||
| 100-200Myr (CB) | 3Myr | 20Myr | 3Myr | 20Myr | 3-20Myr | 15Myr | 3-20Myr | 100Myr | 10-20Myr | 69.9 |
| 12.0 | 16.6 | 1.9 | 2.9 | 2.6 | 7.0 | 3.0 | 6.8 | 17.0 | ||
| 10-500Myr (IB) | 3Myr | 3Myr | 3Myr | 3Myr | 10Myr | 3Myr | 10Myr | 10Myr | 15Myr | 70.4 |
| 12.4 | 16.6 | 2.0 | 2.5 | 2.8 | 5.7 | 3.0 | 7.6 | 17.8 | ||
| 10-200Myr (IB) | 3Myr | 3Myr | 10Myr | 3Myr | 3Myr | 3Myr | 10Myr | 10Myr | 15Myr | 72.5 |
| 12.4 | 16.6 | 2.8 | 2.8 | 2.9 | 5.8 | 3.6 | 8.0 | 17.5 | ||
| 100-500Myr (CB) | 3Myr | 20Myr | 3Myr | 20Myr | 3-20Myr | 15Myr | 3-20Myr | 100Myr | 10-20Myr | 72.7 |
| 12.0 | 17.6 | 2.2 | 3.2 | 2.6 | 7.2 | 3.4 | 7.0 | 17.7 | ||
| 3-500Myr (IB) | 3Myr | 3Myr | 3Myr | 3Myr | 10Myr | 3Myr | 10Myr | 10Myr | 15Myr | 73.0 |
| 12.4 | 17.3 | 2.0 | 2.8 | 3.1 | 6.0 | 3.6 | 7.9 | 17.9 | ||
| 3Myr-1Gyr (IB) | 3Myr | 3Myr | 3Myr | 3Myr | 10Myr | 3Myr | 10Myr | 10Myr | 15Myr | 73.1 |
| 12.4 | 17.5 | 2.2 | 2.8 | 2.9 | 5.9 | 3.2 | 7.7 | 18.4 | ||
| 100Myr-1Gyr (IB) | 3Myr | 3Myr | 3Myr | 3Myr | 3Myr | 3Myr | 10Myr | 10Myr | 15Myr | 73.9 |
| 12.4 | 16.5 | 2.7 | 2.9 | 3.1 | 6.1 | 3.8 | 7.4 | 18.8 | ||
| 100Myr-2Gyr (IB) | 3Myr | 3Myr | 10Myr | 3Myr | 10Myr | 3Myr | 10Myr | 10Myr | 15Myr | 74.5 |
| 12.4 | 16.6 | 2.6 | 3.1 | 3.1 | 6.4 | 3.9 | 7.3 | 19.1 | ||
| 10-500Myr (CB) | 3Myr | 15Myr | 3Myr | 20Myr | 3-15Myr | 15Myr | 3-20Myr | 100Myr | 10-20Myr | 75.0 |
| 12.0 | 18.5 | 2.2 | 3.6 | 2.6 | 7.2 | 3.4 | 7.6 | 17.9 | ||
| 0-1Gyr (IB) | 3Myr | 3Myr | 3Myr | 3Myr | 10Myr | 3Myr | 10Myr | 10Myr | 15Myr | 75.1 |
| 12.4 | 18.1 | 2.4 | 3.0 | 3.0 | 6.0 | 3.4 | 7.8 | 18.8 | ||
| 10-200Myr (CB) | 3Myr | 15Myr | 3Myr | 3Myr-10Myr | 20Myr | 20Myr | 100Myr | 100Myr | 10Myr-20Myr | 75.9 |
| 12.0 | 18.7 | 2.3 | 4.0 | 2.9 | 7.4 | 3.3 | 8.0 | 17.4 | ||
| 3-500Myr (CB) | 3Myr | 15Myr | 3Myr | 20Myr | 3-20Myr | 15Myr | 3-20Myr | 100Myr | 10-20Myr | 76.3 |
| 12.0 | 18.8 | 2.4 | 3.8 | 3.0 | 7.4 | 3.4 | 7.9 | 17.6 | ||
| 100Myr-2Gyr (CB) | 3Myr | 20Myr | 3Myr | 20Myr | 20Myr | 15Myr | 3-20Myr | 100Myr | 10-20Myr | 77.8 |
| 12.0 | 19.7 | 2.1 | 3.8 | 2.8 | 7.8 | 3.8 | 7.3 | 18.5 | ||
| 3Myr-1Gyr (CB) | 3Myr | 15Myr | 3Myr | 20Myr | 3-10Myr | 15Myr | 3-20Myr | 100Myr | 10-20Myr | 77.9 |
| 12.0 | 19.5 | 2.3 | 3.8 | 3.0 | 7.5 | 3.9 | 7.7 | 18.3 | ||
| 100Myr-1Gyr (CB) | 3Myr | 20Myr | 3Myr | 20Myr | 3-20Myr | 15Myr | 3-20Myr | 100Myr | 10-20Myr | 78.7 |
| 12.0 | 19.4 | 2.4 | 3.7 | 3.2 | 7.7 | 4.1 | 7.4 | 18.8 | ||
| 0-1Gyr (CB) | 3Myr | 15Myr | 3Myr | 20Myr | 20Myr | 15Myr | 3-20Myr | 100Myr | 10-20Myr | 79.3 |
| 12.0 | 19.9 | 2.8 | 3.9 | 2.8 | 7.5 | 3.9 | 7.8 | 18.8 |
| Region | Young AgebbThe model colors of the young population include gas emission as described in text, and an IB since it gives the best fit. | ccModel colors of the evolved population assume a CB of age 100–200Myr. | RMSddRoot-mean-square residual (in mag) averaged over all five colors. | |||||||
|---|---|---|---|---|---|---|---|---|---|---|
| NW2 | 3Myr | 0.0 | 0.0 | 0.8 | 0.23 | 0.01 ( 1.71) | 0.60 (-0.52) | -0.26 (-2.63) | 1.15 (-1.36) | 0.60 ( 0.70) |
| 0.21 | 0.27 ( 0.15) | 0.49 ( 0.20) | -0.39 ( 0.05) | 0.78 ( 0.27) | 0.79 ( 0.27) | |||||
| NW1 | 3Myr | 0.0 | 0.4 | 0.3 | 0.14 | 0.21 ( 2.58) | 0.24 ( 0.01) | -0.05 (-2.18) | 0.67 (-0.79) | 0.32 ( 1.00) |
| 0.13 | 0.34 ( 0.05) | 0.24 ( 0.07) | -0.16 ( 0.05) | 0.50 ( 0.21) | 0.51 ( 0.19) | |||||
| NW | 3Myr | 0.1 | 0.5 | 0.0 | 0.05 | 0.25 ( 0.19) | 0.06 ( 0.56) | 0.00 (-0.98) | 0.38 (-0.75) | 0.16 ( 0.17) |
| 0.07 | 0.26 ( 0.05) | 0.09 ( 0.05) | -0.04 ( 0.05) | 0.29 ( 0.11) | 0.18 ( 0.09) | |||||
| Inter. | 3Myr | 0.0 | 0.3 | 0.3 | 0.06 | 0.17 ( 0.48) | 0.33 ( 0.17) | -0.13 (-1.20) | 0.77 (-0.47) | 0.39 ( 0.45) |
| 0.12 | 0.19 ( 0.05) | 0.34 ( 0.05) | -0.19 ( 0.05) | 0.68 ( 0.18) | 0.47 ( 0.17) | |||||
| SE | 10Myr | 0.1 | 0.6 | 0.2 | 0.08 | 0.33 ( 0.00) | 0.21 (-1.08) | 0.14 (-0.48) | 1.08 (-0.36) | 0.88 ( 1.22) |
| 0.10 | 0.33 ( 0.05) | 0.15 ( 0.05) | 0.12 ( 0.05) | 1.02 ( 0.16) | 1.05 ( 0.14) | |||||
| SE1 | 3Myr | 0.0 | 0.3 | 0.4 | 0.11 | 0.16 (-0.05) | 0.31 (-0.40) | -0.10 (-1.92) | 0.72 (-0.75) | 0.31 ( 1.10) |
| 0.11 | 0.16 ( 0.05) | 0.29 ( 0.05) | -0.19 ( 0.05) | 0.59 ( 0.17) | 0.49 ( 0.16) | |||||
| SE2 | 10Myr | 0.0 | 0.4 | 0.5 | 0.08 | 0.24 ( 0.88) | 0.36 (-1.22) | 0.10 (-0.52) | 1.27 (-0.18) | 0.93 ( 0.55) |
| 0.14 | 0.30 ( 0.07) | 0.22 ( 0.11) | 0.08 ( 0.05) | 1.23 ( 0.21) | 1.03 ( 0.19) | |||||
| Exten. | 10Myr | 0.2 | 0.4 | 0.6 | 0.31 | 0.26 ( 0.96) | 0.42 (-0.50) | 0.11 (-2.16) | 1.59 ( 0.26) | 1.39 ( 0.95) |
| 0.29 | 0.38 ( 0.13) | 0.32 ( 0.20) | -0.43 ( 0.25) | 1.69 ( 0.38) | 1.77 ( 0.40) | |||||
| C | 15Myr | 0.0 | 0.6 | 0.0 | 0.21 | 0.32 ( 0.70) | 0.09 (-0.67) | 0.22 (-2.89) | 0.90 ( 0.92) | 0.85 ( 2.56) |
| 0.19 | 0.41 ( 0.13) | -0.09 ( 0.27) | 0.08 ( 0.05) | 1.13 ( 0.26) | 1.18 ( 0.13) |