The origin of crystalline silicates in the Herbig Be star HD100546 and in comet Hale-Bopp
We have investigated the spatial distribution, and the properties and chemical composition of the dust orbiting HD 100546. This system is remarkably different from other isolated Herbig Ae/Be stars in both the strength of the mid-IR excess and the composition of the circumstellar dust. To explain spectral features and the amount of mid-IR dust emission the presence of a component of small ( 10 m) grains radiating at 200 K is required, which is not seen in other well investigated Herbig Ae/Be systems. This additional component is inconsistent with a uniform flaring disk model. The fraction of intercepted stellar light that is absorbed and re-emitted in the mid-IR is so large ( 70 %) that it requires the disk to be more ‘puffed up’ at about 10 AU, where the grains have K. This may occur if a proto-Jupiter clears out a gap at this distance allowing direct stellar light to produce an extended rim at the far side of the gap. The other remarkable difference with other isolated Herbig Ae/Be systems is the presence of a much larger mass fraction of the crystalline silicate forsterite in the circumstellar dust. We find that the mass fraction of crystalline silicates in HD 100546 increases with decreasing temperature, i.e. with larger radial distances from the central star. This distribution of crystalline dust is inconsistent with radial mixing models where the crystalline silicates are formed by thermal annealing above the glass temperature in the very inner parts of the disk, and are subsequently transported outwards and mixed with amorphous material. We speculate that the formation and spatial distribution of the crystalline dust may be linked to the formation of a proto-Jupiter in the disk around HD 100546. Such a proto-Jupiter could gravitationally stir the disk leading to a collisional cascade of asteroidal sized objects producing small crystalline grains, or it could cause shocks by tidal interaction with the disk which might produce crystalline dust grains through flash heating. As shown by Malfait et al. (1998), the infrared spectrum of HD 100546 is very similar to that of C/1995 O1 Hale-Bopp (Crovisier et al. 1997). Using an identical methodology, we have therefore also studied this solar system comet. Both objects have an almost identical grain composition, but with the important difference that the individual dust species in Hale-Bopp are in thermal contact with each other, while this is not the case in HD 100546. This suggests that if similar processes leading to the dust composition as seen in HD 100546 also occurred in our own solar system, that Hale-Bopp formed after the formation of one or more proto-gas giants.
Key Words.:
Circumstellar matter – Stars: formation – Stars: pre-main-sequence1 Introduction
Herbig Ae/Be stars (hereafter referred to as HAEBE stars) were first described as a group by Herbig (1960), in a study which was aimed at finding intermediate mass young stars. Many studies have since confirmed the young pre-main-sequence (PMS) nature of HAEBE stars. Hipparcos parallaxes (e.g. van den Ancker et al. 1998) allowed accurate positions in the HR diagram to be obtained, and from comparison to PMS evolutionary tracks masses of the order of 2 to 8 M⊙ and stellar ages measured relative to the birthline of typically 106 to 107 yrs were found. Direct imaging at millimeter wavelengths of several Herbig Ae stars revealed the presence of rotating flattened structures (Mannings & Sargent 1997, 2000), believed to be the remnant of the accretion disk and the site of on-going planet formation. It is not clear whether disks are also common around more massive Herbig Be stars.
At infra-red (IR) wavelengths, the Infrared Space Observatory (ISO Kessler et al. 1996) has obtained full 2-200 m spectra of the brightest HAEBE stars. These spectra show a wealth of detail concerning the thermal emission of dust in the circumstellar environment. In a series of papers, we have studied the dust emission from HAEBE stars (Waelkens et al. 1996; Malfait et al. 1998, 1999; van den Ancker et al. 2000, 2001; Bouwman et al. 2000, 2001; Meeus et al. 2001), focusing on the mineralogical composition of the dust. These studies indicate that a substantial modification of the dust composition from that in the interstellar medium (ISM) occurs on time scales that are still poorly constrained, but are generally less than 107 years. We mention grain growth, the formation of crystalline silicates and of crystalline H2O ice, and of hydro silicates. These modifications are important clues to the processes that eventually lead to planet formation, and which can be compared to the records of planet formation as found in solar system objects (meteorites, comets, interplanetary dust particles).
In this study we re-examine the ISO spectrum of HD 100546, first presented by Waelkens et al. (1996). This object has an exceptionally high fraction of crystalline silicates, and its ISO spectrum shows a remarkable resemblance to that of the solar system comet Hale-Bopp (Crovisier et al. 1997). Malfait et al. (1998) already suggested the exciting possibility that we are witnessing the birth of an Oort cloud with a multitude of cometary bodies being scattered by a (hypothesized) giant planet. Bouwman et al. (2001) analyzed the 10 m silicate band of 14 HAEBE stars including HD 100546, and found that its mineralogical composition deviates substantially from that of other HAEBE systems: in addition to a large fraction of forsterite, the average grain size of the particles causing the 10 m emission is larger. Also, a lack of silica compared to forsterite was found. The latter can be interpreted as a difference in the crystallization process leading to the formation of forsterite. We decided that a closer look at the distribution of the different mineralogical components in terms of mass and temperature is needed to better understand the nature of HD 100546. We also analyze the ISO spectrum of Hale-Bopp, using the same analysis method as for HD 100546. Previously, we have carried out a similar detailed analysis for AB Aurigae and HD 163296 (Bouwman et al. 2000) and we will compare these results with those obtained here for HD 100546. The observations of HD 100546 used in this paper are taken from Malfait et al. (1998) and Meeus et al. (2001). The observations of Hale-Bopp were secured when the comet had a heliocentric distance of 2.8 AU and are from Crovisier et al. (1997).
This paper is organized as follows: in Sect. 2 we discuss the difference in dust composition and spectral energy distribution of HD 100546 compared to other HAEBE systems. In Sect. 3 we explain the method to fit the spectrum. Sect. 4 describes our results for HD 100546 and for Hale-Bopp. In Sect. 5 we compare our results to those obtained for AB Aur and HD 163296, and discuss the implications for the formation process of the crystalline silicates in HD 100546. Sect. 6 summarizes the results of our study.
2 The deviating dust composition and spectral energy distribution of HD 100546
The spectral appearance and dust properties of HD 100546 differ from that of other HAEBE stars. We will start out with a summary of these differences:
First, the ISO-spectra of HD 100546 show strong and pronounced emission, identified with the crystalline silicate forsterite, which in abundance must be far in excess of that seen in other HAEBE systems (Malfait et al. 1998; Meeus et al. 2001).
Second, Bouwman et al. (2001) identified an emission component at 8.6 m in the spectra of a large sample of HAEBE stars which they attribute to silica (SiO2), and which seems to be correlated with forsterite. This correlation is interpreted as evidence that the crystalline silicates are formed by thermal annealing. However, the dust properties in HD 100546 – and in this respect also that of comet Hale-Bopp – does not comply with this correlation between silica and forsterite. This suggests that a different formation process is responsible for the large mass fraction of forsterite seen in both objects.
Third, from a detailed analysis of the 10 m spectral region (Bouwman et al. 2001), it was shown that the typical grain size of the silicate particles emitting at these wavelengths is larger compared to the sizes found in other HAEBE systems. This suggests the disk in HD 100546 is more evolved.
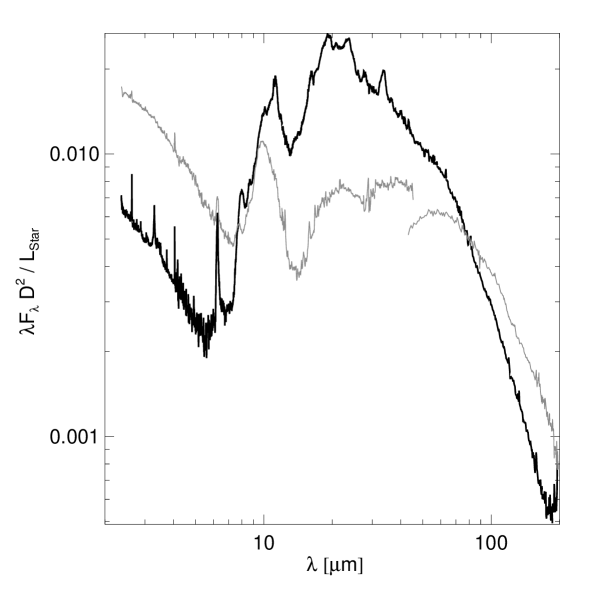
Fourth, the spectral energy distribution of HD 100546 shows remarkable differences when compared to other HAEBE stars. To illustrate the difference, we have plotted in Fig. 1 the SEDs of AB Aurigae (light line) and HD 100546 (dark line) normalized to the stellar luminosity. Both dust disks intercept about 50 % of the stellar light (see Table 1). It is easily seen that AB Aur re-emits a larger fraction of this intercepted light in the near-IR, while HD 100546 shows a larger emission at mid-IR wavelengths. The far-IR and sub-millimetre luminosities are comparable. The difference in the way radiation is redistributed by the dust essentially implies that the stellar flux is absorbed at different locations in the circumstellar disk. Dust grains dominating the near-IR emission have temperatures of at least 1000 K. For a grain to reach such a temperature it has to be within 1 AU of the central star. In the case of AB Aur it is within this region that about half of the intercepted light is reprocessed (see Table 1). HD 100546 emits a relatively modest amount of radiation in the near-IR, however, 70 % of the total dust luminosity comes out in the mid-IR. Grains emitting at these wavelengths have typical temperatures of 200 K. Assuming these grains receive direct stellar light this implies that the re-emitted mid-IR flux originates from about 10 AU from the central star.
In estimating the above emitting regions, we have assumed that the dust medium is optically thin. Let us, for the moment, hold on to this assumption. For the emission scales with dust mass, implying that the disk of HD 100546 is less massive in the inner parts compared to AB Aur. Given that the system is older (van den Ancker et al. 1998), it suggests that a larger fraction of the circumstellar matter has been removed from the disk (evaporated or accreted) and/or is incorporated into larger bodies, substantially reducing the near-IR emission. In an optically thick view, the emission scales not with the dust mass but with emitting surface. Dullemond et al. (2001) show that the near-IR excess may be due to a puffed-up inner rim surface. The height of this inner rim is a function of the stellar luminosity and of the surface density in the disk near the evaporation temperature of the dust. The low near-IR excess of HD100546 compared to AB Aur is then the combined effect of the smaller stellar luminosity, and a severe depletion of the inner disk.
| Ld/L⋆ | LNIR/Ld | LMIR/Ld | LFIR/Ld | |
|---|---|---|---|---|
| AB Aur | 0.46 | 0.51 | 0.34 | 0.15 |
| HD 100546 | 0.51 | 0.17 | 0.70 | 0.13 |
Concerning the mid-IR fluxes, similar considerations apply. Dullemond et al. (2001) show that the SED of AB Aur can be reproduced with a passive reprocessing flaring disk in hydrostatic equilibrium. As the mid-IR spectrum of this star is similar to that of many other HAEBE stars (Meeus et al. 2001), most likely this model has generic value. However, the model can not explain the SED of HD 100546. For a uniform flaring disk model to reproduce the strong mid-IR emission, the opening angle of the disk has to increase faster with radius in order to intercept more stellar light relatively close to the star. Given the comparable sizes of the systems (Augereau et al. 2001; Mannings & Sargent 1997), such a solution would lead to a much larger total covering fraction. However, these are about 50% in both systems.
A possible solution for this problem is to induce a sizable gap in the circumstellar disk. Such a gap would produce a large rim at the far side of the gap (when viewed from the direction of the central star), of which the largest part would be irradiated directly by the star (see Fig. 10). As a result, a larger absorbing surface is created and consequently the larger emitting surface that is required. Dullemond et al. (2001) show that in such a geometry indeed the disk scale height is increased substantially, increasing the emission from the region where the dust is 200 K. In Sect. 5.1 we will speculate that a massive planet, which has formed in the disk at 10 AU, may have created such a gap.
We conclude that HD 100546 differs considerably from other HAEBE systems in both dust composition and disk geometry. This implies that processes different from those observed in other HAEBE systems currently dominate the HD 100546 system. In this paper we will try to trace these processes.
3 Modelling
The diagnostic method adopted is identical for the Herbig Be star HD 100546 and comet Hale-Bopp. We use the radiative transfer program modust to model the circumstellar dust using the mode in which the material is assumed to be optically thin. This is correct for comet Hale-Bopp, but for the circumstellar disk of HD 100546 this may not be valid. However, in discussing dust properties we will focus on the mass over temperature distribution of the material responsible for the infrared emission. This diagnostic does not depend on the optical depth properties of the medium and therefore the simple approximation used here is still meaningful. For both objects the material is distributed in a spherical shell, which for Hale-Bopp is positioned at the distance from the sun corresponding to that of the location of the coma and tail at the time of observation. For recent applications and for descriptions of techniques used in modust, see e.g. Bouwman et al. (2000) and Kemper et al. (2001).
The grains are irradiated by the central star, for which we use Kurucz (1993) energy distributions. The Hipparcos distance to the B9Vne star HD 100546 is pc, yielding a luminosity (van den Ancker et al. 1998). Comparison with evolutionary tracks, using K, places the star on the main sequence having an age of Myr and mass of 2.4 M☉ . In modelling Hale-Bopp, we use Kurucz’s solar model with K.
The absorption of stellar radiation at mostly ultraviolet and optical wavelengths and re-emission in the infrared is consistently taken into account assuming the particles are in radiative equilibrium, yielding the spectral energy distribution. A key difference of this method compared to other often employed approaches in modelling circumstellar and cometary spectra is that both the spectral characteristics responsible for the distinct features as well as those responsible for the featureless continuum are modelled simultaneously. Other methods usually introduce an artificial separation between continuum and features, fitting the spectrum combining empirical temperatures with laboratory extinction efficiencies (e.g. Wooden et al. 1999; Mason et al. 2001) or with template extinctions based on measurements of interplanetary dust particles (IDP’s) (e.g. Wooden et al. 2000), complicating a reliable interpretation.
In the near- and mid-IR, typically carbon and large ( m) amorphous silicate grains are responsible for the overall continuum, while water ice is a dominant contributor in de far-IR and sub-millimetre range. At 10 m the molecular vibrational modes of Si-O bonds in small amorphous silicate grains ( m) produce a distinct feature, as do silicate crystals in the mid-IR part of the spectrum. These latter particles, however, also produce significant flux outside of their resonances, which one can not a priori distinguish from continuum only contributors. Continuum subtraction methods therefore are susceptible to (systematic) errors. This may significantly affect temperatures, abundances, and sizes derived for especially the crystalline material. Our method does not suffer from this problem. In fairness, we should mention that in other respects studies using ground based data have advantages over the interpretation of ISO data. For instance, the mid-IR observations analysed by Wooden al. (2000) – which have been obtained close in time to the ISO data – have much smaller beams, allowing one to study gradients in the particle properties as a function of distance to the cometary nucleus.
3.1 Size and shape properties of grains
Composition, size and shape properties of grains in proto-planetary disks may provide important constraints on the formation history of circumstellar dust.
We first focus on shape properties. Very little is known about the structure of grains in circumstellar disks. Particles may be compact or “fluffy” and may be chemically homogeneous or consist of a mix of different materials. Information may be obtained from measurements of grains sublimating from solar system comets nearing perihelion. From a comparison of measurements of the angle dependence of the scattering albedo of several bright comets with theoretical predictions Gehrz & Ney (1992) found the coma grains to be consistent with “fluffy” aggregates of smaller compact particles. Properties of the aggregate, such as temperature and spectroscopic signature, will be affected by the actual degree of fluffiness of the grain, often expressed in terms of the porosity factor of the particle (Lisse et al. 1998; Harker 1999). Large porous grains may heat to much higher temperatures than compact grains of the same mass and may show spectroscopic characteristics similar to the smaller compact particles constituting the fluffy aggregate. Theoretical considerations suggest cometary grains to be extremely fluffy with porosity factors (Greenberg & Hage 1990), effectively implying that some spectroscopically deduced properties relate to the smaller compact units making up the porous aggregate (e.g. Brucato et al. 1999, and references there in). In our modelling we will therefore concentrate on (small) compact particles, leaving open the possibility that they may be part of larger fluffy aggregates.
Regarding the chemical homogeneity of the small particles, Li & Greenberg (1998) pointed out that in situ mass spectra of comet P/Halley 1986 III dust showed that carbonaceous and silicate materials were mixed on fine scales, suggesting these two species are not physically separated. If this is the case, the components are likely in thermal contact. The question of thermal contact is especially relevant with respect to the magnesium over iron content of the silicate material, a major constituent of circumstellar dust, as the absorption properties of olivine (Mg2xFe2-2xSiO4, with between 0 and 1) and pyroxene (MgxFe1-xSiO3) sensitively depend on this ratio. The pure magnesium silicates forsterite (Mg2SiO4) and enstatite (MgSiO3) are optically much more transparent than iron rich silicates, implying that if Fe-rich and Fe-poor materials coexist as separate particles – with comparable shape and size – the Fe-rich dust will reach significantly higher temperatures.
We have opted to treat the different chemical species as physically separated. In the case of Hale-Bopp this allows to investigate whether the forsterite crystals, of which the spectroscopic signatures are prominently visible in the mid-IR spectrum, are in thermal contact with the bulk amorphous silicate material, which is likely to contain a significant fraction of iron, by determining the mass-averaged temperatures of both species. If significantly different, one may assume the components to be physically separated; if similar temperatures are found, it is likely they are in thermal contact.
For each particle, we calculate the extinction properties from optical constants determined in laboratory experiments, as listed in Table 2. We assume spherical grains, for which we use Mie calculations, or a continuous distribution of ellipsoidal grains, for which we use CDE calculations, to determine the absorption and scattering coefficients (see Bohren & Huffman (1983) for al full review on these methods).
As we treat the CDE particles in the Rayleigh limit, we can not study grain size effects. For spherical particles this assumption is not required. The spherical particles of our multi-component mixture of grains range between minimum size amin and maximum size amax and are distributed following a power-law, i.e.
| (1) |
Theoretical calculations predict this type of size distribution whenever there is shattering and coagulation of grains through grain-grain collisions (Biermann & Hartwit 1980). To get some feeling for the value of the power-law index, extinction observations imply a size distribution with = 3.5 for interstellar grains (Mathis et al. 1977).
3.2 Chemical composition of grains
The grain species used to model the spectra of both objects are listed in Table 2. The dust composition is similar to that used by Bouwman et al. (2000) to model the isolated Herbig Ae stars AB Aurigae and HD 163296, though more appropriate sources for the optical constants of crystalline silicates and water ice are used. Of the two isolated Herbig stars mentioned only in HD 163296 a small amount of forsterite could be identified, modeling of which did not sensitively depend on the adopted optical constants. However, for the two objects investigated here – which show prominent features of olivine – differences in laboratory measurements are important. To model the crystalline silicate features we tried three sets of data: Servoin & Piriou (1973) measured the optical properties of forsterite (Mg2SiO4; Fo100). Steyer (1974) used a natural olivine sample, which was estimated to contain a small amount of iron, i.e. (Fo91). The sample used by Mukai & Koike (1990) contains an almost equal amount of iron (; Fo90). These measurements only cover the IR wavelengths. To estimate the optical properties of the grains at visual and UV wavelengths, where most of the stellar light is absorbed, we used measurements of comparable materials from several other sources, referenced in Table 2.
Neither in AB Aur nor in HD 163296 the 44 m feature characteristic for crystalline H2O ice was found, prompting the use of amorphous water ice in modeling their circumstellar environment. In both HD 100546 and Hale Bopp, however, the 44 m feature appears to be visible, making it more appropriate to assume the water ice in these sources to be crystalline.
| Species | Latice | Wavelength | Tdestr | Ref. |
|---|---|---|---|---|
| Structure | [m] | [K] | ||
| [Mg,Fe]SiO4 | A | 0.2–500 | 1100 | (1) |
| FeO | C | 0.2–500 | 1000 | (2) |
| C | A | 0.1–800 | 1000 | (3) |
| H2O | C (ice) | 0.05–103 | 150 | (4) |
| Forsterite | C | 0.04–3 | 1400 | (5) |
| 3–250 | (6) | |||
| Olivine (Fo91) | C | 0.04–3 | 1400 | (5) |
| 3–250 | (7) | |||
| Olivine (Fo90) | C | 0.01–0.3 | 1400 | (8) |
| 0.3–2 | (9,10) | |||
| 7–200 | (11) | |||
| Fe | M | 0.1–105 | 1500 | (12) |
Abbreviations used to designate the latice structure: A = Amorphous; C = Crystalline; M = Metallic.
References: (1) Dorschner et al. (1995); (2) Henning et al. (1995); (3) Preibisch et al. (1993); (4) Bertie et al. (1969); (5) Scott & Duley (1996); (6) Servoin & Piriou (1973); (7) Steyer (1974); (8) Huffman & Stapp (1973); (9) Jones & Merrill (1976); (10) Rogers et al. (1983) (11) Mukai & Koike (1990); (12) Henning & Stognienko (1996).
4 Results
4.1 HD 100546

Plotted in Fig. 2 is our best model fit to the SED of HD 100546. The resulting model parameters are listed in Table 3. The top panel shows the entire SED. A dashed line represents the Kurucz model for the central star. The lower panel shows the ISO-SWS and LWS wavelength region. Indicated are the contributions to the spectrum of the individual dust components as listed in Table 3. To fit the SED a bi-modal grain size distribution is required, similar as to that found in previous analysis of HAEBE stars (Bouwman et al. 2000; Bouwman 2001). The small ( m) grains dominate the SED shortward of m, while the large (up to m) grains dominate at the longest wavelengths.
| Component: | Small grains | Large grains | ||||||||
| two component density structure | ||||||||||
| zone 1 | zone 2 | |||||||||
| Dust species | R [AU] | [gr cm-3] | R [AU] | [gr cm-3] | a [m] | a [m] | ||||
| ———————————— | ———————————— | |||||||||
| Amorph. silicate | 0.3–9.8 | 0.88 | 9.8–43 | 0.7 | 0.01–10 | 0.53 | 10–200 | |||
| Carbon | 0.3–9.8 | 0.09 | 9.8–43 | 0.08 | 0.01–10 | 0.05 | 10–200 | |||
| Metallic iron | 0.3–4.9 | 0.01 | – | – | – | 0.01–0.1 | – | – | ||
| Forsterite | 0.3–24 | 0.02 | 24–600 | 0.19 | – | – | – | |||
| Water ice | – | – | – | 9.8–43 | 0.03 | 0.01–10 | 0.42 | 10–25 | ||
4.1.1 The small grain component
Though the small grain component contains only a minor fraction of the total dust mass () it dominates the SED at near- and mid-IR wavelengths. To reproduce the observed fluxes in this wavelength range, a bi-model density structure is required. As can be seen from Table 3, the small grains are distributed between 0.3–9.8 AU, and between 9.8–43 AU, from here on referred to as zone 1 and zone 2, respectively. The contributions to the SED of zone 1 and 2 are plotted in Fig. 2. The inner boundary of zone 1 at 0.3 AU is determined by the grain destruction temperatures of the individual dust species as listed in Table 2. A similar dust component as that in zone 1 is also present in AB Aur, HD 163296 and HD 104247 (Bouwman et al. 2000; Bouwman 2001). The sudden increase in density at 9.8 AU, marking the onset of zone 2, is found only in HD 100546. It is this additional component that produces the much larger mid-IR luminosity compared to the other HAEBE systems as discussed in Sect. 2. As can be seen from Fig. 2, the emission from zone 2 completely dominates the SED between 20 to 50 m. The resulting total mass of M☉ in small grains is two to three orders of magnitude larger than found in the studies mentioned above.
A major fraction of the dust emission seen in HAEBE systems is due to amorphous silicates. Though it is difficult to determine the exact nature of the amorphous material, an excellent fit can be made if we use the optical properties of a silicate glass with an olivine stoichiometry (see also Table 2). The grain size of the amorphous silicate is well constrained by the shape and strength of the 10 m silicate feature, and the flux ratio between the 10 and 18 m bands. Apart from the amorphous silicates an additional source of continuum emission is required. We added this in the form of carbonaceous grains. Since this material has no distinct spectral features, the grain size and consequently, mass fraction, are less well established and are uncertain within a factor of two. In our best fit model we assumed an equal grain size distribution as for the amorphous silicate. The band at 43.3 m in the spectrum of HD 100546 indicates the presence of a population of small ice grains. Given the ice sublimation/evaporation temperature of 150 K, water ice can only be present in zone 2 outside of the “snow limit”. For the small ice grains we also assumed the same grain size distribution as for the amorphous material. Interesting to note is that Smith et al. (1994) showed that the ice band can only shift to the observed wavelength of 43.3 m if amorphous ice grains where heated to the crystallization temperature and then cooled to 50 K. One could interpret this as a local (i.e. within the “snow” regime) heating event or local radial mixing.
As one can see from the inset in Fig. 2, the near-IR flux shortward of 4 m is dominated by the emission from metallic iron grains. These grains are the only refractory dust species which are stable at the required high temperatures ( K), and that have sufficient opacity at near-IR wavelengths to emit in this spectral region. We had to constrain the spatial distribution of the metallic iron grains to within 4.9 AU. The grain temperature of the iron grains is between 1500 and 750 K. This suggests that metallic iron is formed at high temperatures, most likely by solid state reduction of iron bearing silicates heated above the glass temperature at the very inner parts of the circumstellar disk.
4.1.2 The crystalline silicate component
In the sample of isolated HAEBE stars presented in Meeus et al. (2001), HD 100546 shows the most prominent features of crystalline silicates. This enables one, at least in principle, to determine the exact chemical composition and crystalline structure of the silicates. We used three sets of laboratory data listed in Table 2, to determine the best fit to the crystalline silicate bands. Plotted in Fig. 3 are the 24 and 34 m silicate bands of HD 100546, compared with our best fit models for the three data sets. As one can clearly see, the model based on the measurements of Servoin & Piriou (1973) provides the best match with the observations. For this model and the model using the Steyer (1974) data set, the CDE shape distribution (see Sect. 3) gives a much better fit than do spherical grains. In the model using the Mukai & Koike (1990) data, MIE calculations produce the best match. We conclude that the crystalline silicate features seen in the ISO spectra of HD 100546 are due to non-spherical forsterite grains. In our best fit, presented in Fig. 2 and Table 3, we used this latter model for the crystalline silicate.

The forsterite grains also require a bi-modal density structure (zone 1 and zone 2). As can be seen from Table 3 the crystalline mass fraction is much higher in zone 2 than in zone 1, indicating that the abundance of crystalline material is increasing outwards. In our best fit model the forsterite grains are not co-spatial with the other dust species. The spatial distribution of forsterite grains has to extent out to 600 AU, well beyond the observed disk limit of 380 AU (Augereau et al. 2001). This, however, could be an artifact of the grain model we used for calculating the optical properties of the forsterite grains. The CDE approximation assumes the grains to be in the Rayleigh limit, and consequently the optical properties of the particles do not depend on grain size. However, outside the Rayleigh limit, particle size has a strong effect on grain temperature. Larger grains have to be placed much closer to the central star than smaller grains to reach the same equilibrium temperatures. The grains can however not be much larger than 1 m to be able to reproduce the observed spectral features. This is smaller than the typical grain size of the amorphous material. Our best estimate for the effect of grain size on the spatial distribution, using the measurements of Mukai & Koike (1990) indicates that the crystalline grains could be moved inwards to within the observed disk limits, but not far enough to be co-spatial with the amorphous silicate.
The grain size distribution also influences the mass fraction of the dust species. The model assuming a maximum grain size of 2 m for the forsterite grains would increase the mass in crystalline dust by a factor of five. This would imply that as much as 50 % of the total mass of the small grain component could be crystalline silicates.
4.1.3 The large grain component
To reproduce the observed slope and fluxes at mm wavelengths a dust component with a large grain size up to 200 m is required. Their contribution to the SED of HD 100546 can be seen in Fig. 2. Due to this large grain size, one can not determine its exact composition from ISO spectroscopy, since such large grains will radiate as black bodies at these wavelengths. We used the dust species found spectroscopically to model the large grain component and assumed their relative mass ratios to be identical to that of the small grain component. The mass fractions of the large amorphous silicate and carbonaceous grains, listed in Table 3, are therefore uncertain. Similarly, it is not possible to determine if these large grains contain crystalline material as this will also result in black body emission. We therefore did not use crystalline silicates in the large grain component. However, due to the presence of the emission band at 60 m attributed to crystalline water ice grains, the mass fraction of this dust species can be determined. The maximum size the ice grains can have and still produce a 60 m band, is 25 m. This is much smaller than the maximum size required to fit the slope of the SED at mm wavelengths. There are however some problems with the 60 m band as we will discuss in Sect. 4.1.5.
We have constrained the spatial extent of the large grains using the disk size observed by Augereau et al. (2001) with the HST/NICMOS2 instrument. To fit the observations, a gap of 28 AU is required between the central star and the dust shell containing the large grains. As noted in previous studies (Bouwman et al. 2000), this gap is most likely an artifact of the assumption made in this study that the medium is optically thin in the radial direction. In HD 100546 we see the disk fairly face on (51∘ Augereau et al. 2001), implying that in the line-of-sight the medium may well be optically thin. Therefore, the derived mass over temperature distribution remains meaningful (albeit not the structure). As suggested by Bouwman et al. (2000) the large grains have most likely settled to the disk mid-plane, extending all the way to the disk inner edge. Recent full 2D radiative transfer calculations (Bouwman 2001) confirm this qualitative picture. These calculations also show that the of the hot small grains, residing in the optically thin surface layer of the disk, is in agreement with the simple spherical optically thin model adopted in this paper.
4.1.4 The mass temperature distribution
The SED as presented in Fig. 2 is determined by the mass-temperature distribution of the circumstellar dust. Irrespective of the assumed model geometry, this distribution has to be reproduced for dust that is contributing to the observed emission features. Plotted in Fig. 5 is the derived mass over temperature distribution of the best fit model. The upper two panels show the mass-temperature distribution of the small grain component, the lower panel shows the same for the large grains. Indicated in the figure are the individual contributions of each species. The vertical axis unit is chosen in such a way that the integral of the cumulative mass-temperature distribution equals the total dust mass. We have plotted in Fig. 4 the relative contribution to the SED of the individual dust species to get a feeling of their importants to the overall fit. Plotted in Fig. 6 for comparison is the mass-temperature distribution of AB Aur as derived by Bouwman et al. (2000). The first panel shows the mass-temperature distribution of the small grains, the second panel that of the large grain component.

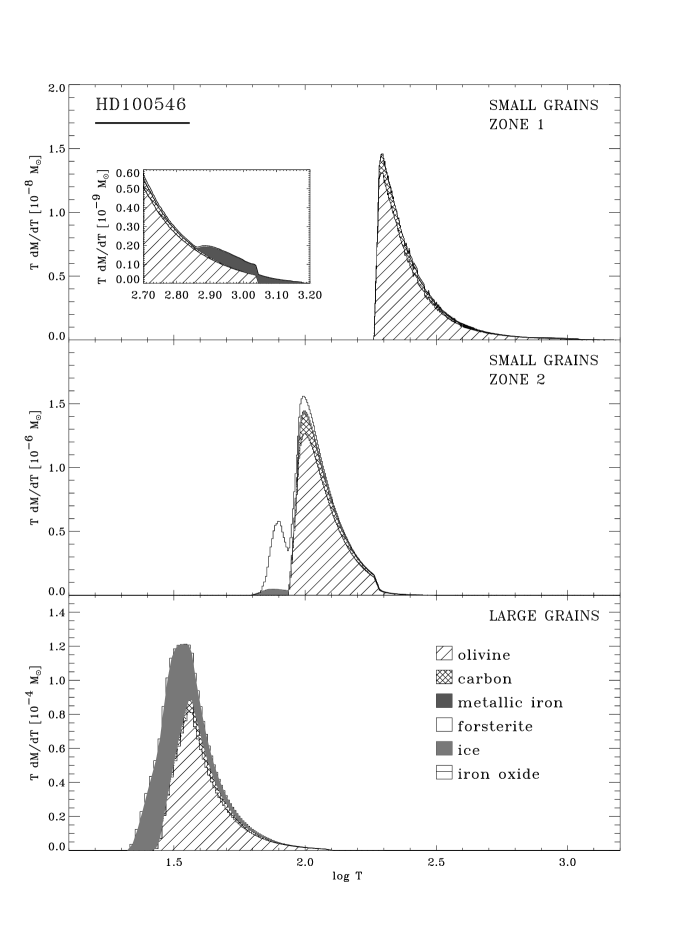
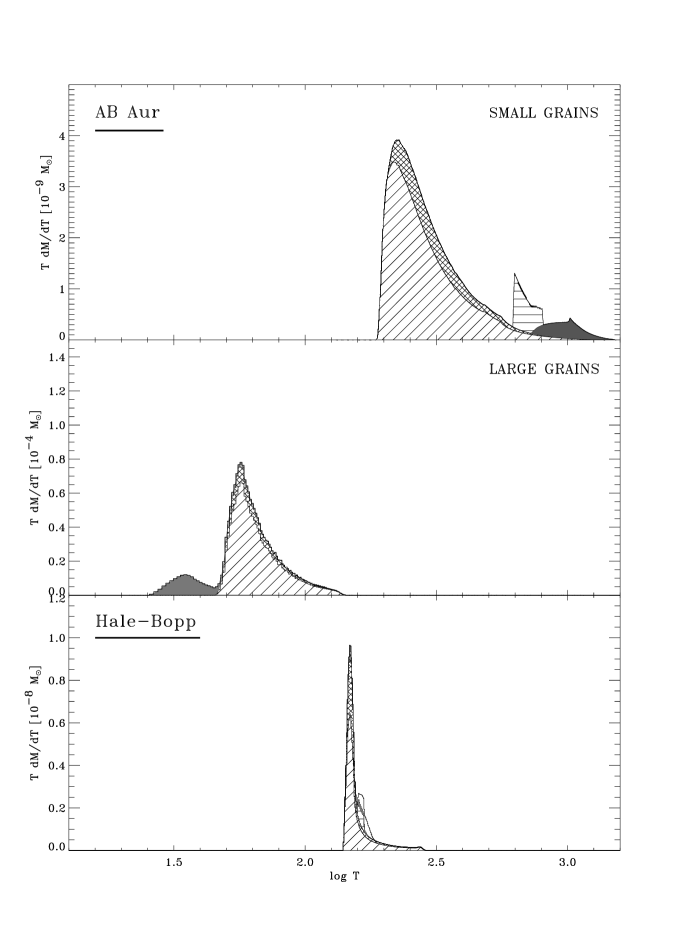
A comparison between Figs. 5 and 6 shows that the dust in HD 100546 is characterized by a bi-modal mass-temperature distribution, similar to that in the AB Aur system. The inset in the top panel of Fig. 5 shows the mass distribution at temperatures above 500 K, producing the near-IR emission. This component, dominated by hot iron or iron oxide grains, is very similar for both objects. Meeus et al. (2001) have shown that the near-IR spectrum of HAEBE systems is generic, suggesting a similar geometry and/or dust composition at the very inner parts of the circumstellar dust region. However, the total mass contained in the small grains in HD 100546 is almost three orders of magnitude larger. This excess mass is located in zone 2 (see Table 3) of the small grain component, which is not present in AB Aur and is the cause for the much larger mid-IR excess as observed in HD 100546.
Focusing on the mass-temperature distribution of the small grains, one notices the difference in the distribution between the amorphous dust and the forsterite grains. To fit the SED, the crystalline silicate must have a much lower temperature than the amorphous grains. This result holds irrespective of the adopted laboratory measurements of the crystalline silicate. This mass-temperature distribution imposes the small forsterite grains to have a larger radial extent compared to the amorphous dust.
The large grain component of HD 100546 has a distribution similar to that of AB Aur. The total mass contained in this component is the same within a factor of two. The small difference in dust mass between both systems is due to a grain size difference, where in AB Aur the maximum grain size is smaller by a factor of two.
4.1.5 The residual spectrum
Plotted in Fig. 7 is the residual spectrum of HD 100546, after subtraction of the best fit model to the ISO-SWS and LWS spectra. Shown in the top panel is the 2 to 15 m region in which the emission bands from polycyclic aromatic hydrocarbons (PAHs; marked with the vertical lines) are clearly visible. For comparison we also plotted the PAH spectrum of the [WC] star BD+30 3639, which may serve as a template of a generic PAH spectrum. Apart from the bands at 6.25, 7.9 and 11.3 m, also PAH features at longer wavelengths can be observed (see also Hony et al. 2001).
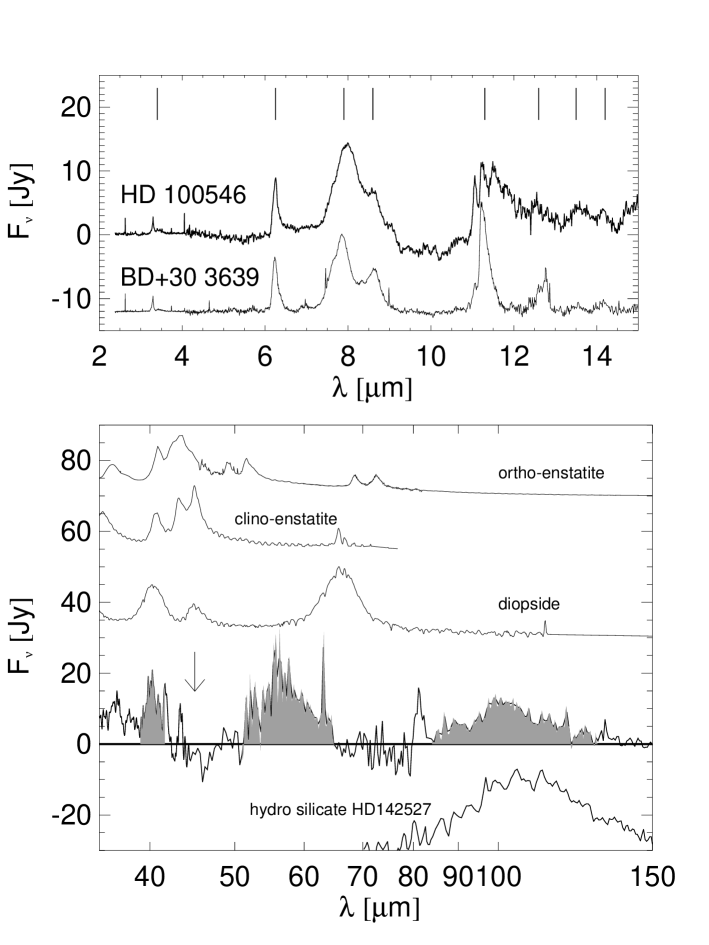
The lower panel shows the 35 to 150 m region. Marked with shaded areas are residual emission bands. The band at 100 m has been interpreted as evidence for the presence of hydro silicates (Malfait et al. 1998). If correct, this can be seen as evidence for the presence of larger bodies on which the hydro silicates are believed to have formed by aqueous alteration of liquid water. For comparison we plotted the solid-state band of HD 142527 which is identified with hydro silicates (Malfait et al. 1999). As one can see the width and position are similar for both bands. However, a secure identification of this rather broad feature strongly depends on the exact run of the underlying continuum. A small change in the location of this continuum may change both the strength and width of the feature or may even cause it to disappear.
The residual at 55 m could indicate the presence of an emission band of a species not treated in our models. It is, however, more likely that this residual originates from the poor fits of the ice bands at 43 and 60 m. Though the positions of the observed ice features coincide well with our ice model, the width and relative strength of the 43 and 60 m bands do not. This could reflect limitations of our simple ice model, e.g. the assumptions of homogeneous spherical grains. Also the temperature of the material at which the optical properties where measured (100 K for our data) will influence the strength and width of the features. The observed position of the ice band at 43.3 m indicates that the ice is 50 K (Smith et al. 1994). An additional problem is that the ice features appear in two separate instruments, LWS and SWS. These instruments connect at 45 m(indicated with an arrow in Fig. 7). The error in the absolute flux calibration between both instruments is 10–15 %. Lowering the LWS spectrum with this percentage would enable us to fit the ice bands without the residue at 55 m. Interesting to note is that the LWS spectrum would then also agree better with the IRAS photometry which is now below the LWS spectrum, as can be seen from Fig. 2. However, we stress that from the ISO observations there is no strong evidence for a jump between the ISO-SWS and LWS spectra at 45 m.
A third feature in our residual spectrum appears at 40.3 m. This band could be due to crystalline dust species other than forsterite. Plotted in Fig. 7 are the spectra of diopside and ortho- and clino-enstatite (Koike et al. 2000). All these species show bands in the 40 m region. The 40 m band of diopside coincides nicely with the residual spectrum but would also produce a band at 65 m at the location of the water ice band, making the problem at 55 m even more severe. If one of the suggested materials is responsible for the 40 m band, it has to be cold, i.e. 70 K, as at shorter wavelengths no evidence for crystalline silicates other than forsterite can be found. Finally we mention that the bands at 40.3 and 43.3 m, coinciding with the ice band, may be due to forsterite. This suggestion is based on mass absorption spectra taken by Jäger et al. (1998), which show evidence for bands at these wavelengths. Though these features are weak, given the overall strength of the forsterite bands this could be a possibility.
4.2 Hale-Bopp
Plotted in Fig. 8 is the ISO-SWS spectrum of comet Hale-Bopp, together with our best fit model. Also shown are the contributions to the spectrum of the individual dust species. The parameters of the model fit are listed in Table 4. As has been discussed by previous authors (e.g. Malfait et al. 1998), the ISO spectrum of Hale-Bopp bears a striking resemblance to that of HD 100546. Our modeling efforts of the spectrum of Hale-Bopp will focus on establishing the similarities and differences in dust properties between the comet and HD 100546.

4.2.1 Grain composition and properties
In general we find that the dust composition of Hale-Bopp is similar to HD 100546, with a few exceptions. We find no evidence in the spectrum of Hale-Bopp for emission from metallic iron grains as in the case of HAEBE systems. This could be a spurious result as in the cold (160 K) dust of Hale-Bopp iron grains have no distinct spectroscopic feature and their emission could blend with that of other smooth continuum sources, for instance from carbonaceous grains. However, it could also imply that metallic iron grains are really absent, given the suggested high temperature formation mechanism of this grain species (see Sect. 4.1.1). At lower temperatures metallic iron can also react to form iron sulfides or oxides (e.g Gail 1998). Indeed, we find evidence for emission from these latter components, in this paper modeled with thermal emission from iron oxide grains, similar to that found in AB Aur and HD 163296 (Bouwman et al. 2000), though less abundant. The possibility, however, exists that the emission component here attributed to iron oxide is (partially) due to iron sulfide which has similar emission properties in this wavelength region (Keller et al. 2000).
| kg | ||||
|---|---|---|---|---|
| Dust species | R [AU] | [gr cm-3] | a [m] | |
| Amorph. silicate | 2.8–3.0 | 0.64 | 0.01–10 | |
| Carbon | 2.8–3.0 | 0.23 | 0.5–10 | |
| Water Ice | 0.6–0.8 | 0.03 | 15 | |
| Iron oxide | 12.6–12.8 | 0.03 | – | |
| Forsterite | 0.9–1.1 | 0.07 | – | |
A component of amorphous silicates and carbonaceous grains similar as in HD 100546, constituting a major fraction of the dust mass, is seen in Hale-Bopp. Interesting to note is the typical grain size of the cometary dust, which follows a power-law slope , much larger than in HD 100546 (). Note that for the forsterite and iron oxide grains we used a CDE shape distribution which does not allow for the determination of grain size. Spectroscopically, the best fit to the forsterite bands is, like for HD 100546, achieved by using the measurements of Servoin & Piriou (1973). Similar uncertainties apply for the derived forsterite mass fraction as for HD 100546, discussed in Sect. 4.1.2. Our best estimates for the effects of a grain size distribution on the derived mass indicates that the maximum mass fraction of forsterite could be about 40 %, i.e. six times higher than in HD 100546. A grain size distribution would also result in a higher continuum contribution of the forsterite grains, which eliminates the requirement for an additional component in the form of iron oxide. From the ISO-SWS spectrum it is difficult to determine the characteristics of the water ice component. We therefore used the results of Lellouch et al. (1998), who found from an analysis of the ISO-LWS spectrum that the average water ice grain is 15 m. The mass fraction of the ice is similar to what Lellouch et al. (1998) find, however, they infer a total dust mass of kg, almost two orders of magnitude larger than we derive. They however, assumed a grain size of 100 m in deriving the total dust mass. Lowering this to the sizes we find would scale their total dust mass to a similar value as found here.
Previous studies (e.g. Wooden et al. 1999) have also used pyroxenes to model the observations of Hale-Bopp. However, from the ISO spectrum no evidence can be found for the precence of such a component. We have therefore not used these dust species in our modeling.
4.3 Thermal contact of grain species
The lower panel of Fig. 6 shows the mass-temperature distribution of Hale-Bopp. Contrary to the HD 100546 system, the dust species in Hale-Bopp all have the same mass averaged temperature of approximately 160 K. The difference in the width of the distribution of the individual dust species results from the assumption of a grain size distribution for the amorphous dust, giving a broader distribution than for the other dust species (forsterite, iron oxide) where a CDE shape distribution is assumed. In order to model the spectrum of comet Hale-Bopp, we found, as expected, that the bulk of the dust material (i.e. the amorphous silicates and the carbon, together accounting for 87 percent of the dust mass) has to be placed at the proper heliocentric distance at the time of observation (2.8 AU and distributed over 0.2 AU), giving it the required mass averaged temperature of 160 K. To fit the near-IR wavelength range, positioning the iron oxide at the correct distance resulted in a temperature for this species too high to properly fit the spectrum. We determined the best fit temperature for this material by positioning it at a larger distance. This yields T K. The same approach was followed to determine the temperature of the water ice and the crystalline silicate. Here it was found that due to their relatively poor light absorption properties both materials had to be placed closer to the star, but again at such a distance that their bulk mass averaged temperature is 160 K. A co-spatial distribution of all grain species, complying with the derived mass-temperature distribution and the observational constrains on the heliocentric distance, can only be obtained if thermal contact between the grains is imposed. This result implies that all dust particles are in thermal contact with one another and that their temperature is essentially determined by the materials dominating the thermal energy content of the dust. The latter are the amorphous silicates and the carbonaceous material. The typical dust temperature we find is much lower than that addopted in previous studies by Wooden et al. (1999). They find a typical temperature for the amorphous silicates and crystalline olivine of 245 K, which is 85 K higher than what we find. Also, they suggest a temperature differnce between crystalline pyroxene grains and other dust species which is contradictory to our findings.
Though the dust species are the same as in HD 100546, Fig. 6 shows the fundamental difference between the dust in Hale-Bopp and that in the Herbig Be system: The grains in Hale-Bopp are in thermal contact, those in HD 100546 are not. Forcing the grain species in HD 100546 to be in thermal contact, the observed difference in the mass-temperature distribution between the amorphous and crystalline dust can not be reproduced. This leads to the conclusion that the grains in HD 100546 are homogeneous, separate entities.
5 Discussion
To summarize, the main results from the analysis of the SED of HD 100546 are the following: (1) The SED of HD 100546 stands out compared to other well studied isolated HAEBE systems in the sense that it has a much weaker near-IR excess, but a much stronger mid-IR excess. (2) An additional component of small (10 m) dust grains is present in the circumstellar material surrounding HD 100546, not seen in other systems. (3) HD 100546 has by far the largest crystalline silicate mass fraction of all HAEBE stars studied with the ISO satellite. (4) A comparison of the mass-temperature distribution of the small, spectroscopically identifiable amorphous and crystalline silicates shows that the bulk of the crystalline silicates has a much lower temperature than that of the amorphous material. From these results several conclusion concerning the disk geometry and the origin of the crystalline silicates can be drawn, as we will discuss below.
5.1 Disk Geometry
As we showed in Sect. 2, the SED of HD 100546 deviates considerably from that of AB Aur. The SED of the latter can be reproduced with a hydrostatic radiative equilibrium disk model (Dullemond et al. 2001). The unusual luminosity distribution of the circumstellar material as listed in Table 1, however, can not be reproduced with a model having a similar disk geometry as used to model AB Aur. For dust grains to efficiently re-radiate the absorbed stellar light in the mid-IR, the typical dust temperature must be in the order of 200 K, which is the equilibrium temperature of grains in the disk surface layer at a radial distance of about 10 AU. To reproduce the observed mid-IR luminosity of 0.35 L⋆ the relative scale height of the disk surface at the radial distance of 10 AU has to be 0.35 in order to “capture” this amount of starlight. This is a factor of two higher than the derived scale height at this radius of the disk surface in the AB Aur system (Dullemond et al. 2001).
However, as Dullemond et al. (2001) show, if a hole forms in the disk, the inner edge of the disk will “puff up” as a consequence of the direct irradiation by the central star. The scale height at the edge will typically increase by a factor of two over the height of a normal flaring disk without inner hole. Using the same model parameters as derived for AB Aur, but with a hole of 10 AU would reproduce the required disk scale height and consequently the observed mid-IR excess of HD 100546. However, the region inside 10 AU cannot be free of dust since there is still excess emission in the near infrared. The material producing this excess must be located at distances of 1 AU. Instead of an inner hole, the disk should therefore have a gap starting outside of AU and extending to about 10 AU. The question is then, whether enough stellar radiation can reach the inner boundary of the outer disk in order to still cause the increased scale height there. In the Dullemond et al. (2001) model, the material in the inner regions casts a shadow over parts of the disk. However, as we have shown in Sect. 2, the near-IR excess of HD100546 caused by the inner part of the disk is relatively small, a disk surface height of is geometrically sufficient to absorb the required 8.5% of the stellar radiation. Therefore the blocking of light by the hot dust is only a small effect in HD100546. We can now identify the mid-IR component in the ISO spectra with a “wall”, being the far side of a disk gap directly illuminated by the star. The additional dust component of small grains (zone 2, see Table 3), unique to HD 100546, should then be the dust being present in this “wall” at 10 AU.
5.2 Minearology: the origin of the crystalline silicates
As was already noted in previous studies, HD 100546 has the highest known fraction of crystalline silicates of all HAEBE stars (Malfait et al. 1998; Meeus et al. 2001; Bouwman et al. 2001). More puzzling, the bulk of the crystalline silicates is at low temperatures ( 100 K, see Fig. 5). The question is how to explain both the high mass fraction as well as the mass-temperature distribution of the crystalline silicates. Fig. 9 shows the relative forsterite mass fraction, as plotted in Fig. 5, relative to the total mass in silicates as a function of temperature. Clearly visible is the rise in the crystalline mass fraction at lower temperatures. A crucial question is which mechanism is responsible for this outward increase of the crystalline dust fraction. This question is closely related to the formation processes of the crystalline silicate. Forsterite will form by annealing of amorphous silicate at temperatures above the glass temperature. At temperatures above 1100 K the annealing time-scale become much smaller than any dynamical time-scale (e.g. Hallenbeck et al. 2000), and a fast transformation into crystalline silicates follows. This implies that the dust in the very inner parts of the circumstellar disk, with temperatures above 1100 K, will be entirely crystalline up to the evaporation temperature of silicate grains at about 1400 K. Several radial mixing models have been proposed to transport material outwards to the regime where crystalline silicates are observed well below the glass temperature. Stevenson (1990) predicted that the mass fraction of the mixed material would decline outwards following a power law. Prinn (1990) argued that the neglect of nonlinear momentum terms in the Stevenson model could underestimate the radial mixing. He predicts that the mass fraction of the mixed material could almost be constant as a function of radius. Similar results are found in recent models by Bockelée-Morvan et al. (2000) and Gail (2001). Plotted in Fig. 9 (dotted line) is a model with a constant relative mass fraction of forsterite over amorphous silicate as a function of radial distance, representing the case of the most effective radial mixing predicted. As can be seen from this figure, outward radial mixing of material from the inner parts of the proto-planetary disk can not be the explanation for the observed distribution of crystalline silicates.

Also, Bouwman et al. (2001) show that the dust composition producing the 10m silicate feature, probing grains at the inner parts of the proto-planetary disk, is inconsistent with thermal annealing. Clearly a different mechanism for the formation of the observed crystalline dust fraction and distribution must be formulated. Having ruled out radial mixing, this implies that the crystalline silicates must have formed locally, i.e. further out in the disk where they are presently observed. What could have caused this crystallization in the cool outer regions of the disk? One way of providing enough energy for the silicates to crystallize is to incorporate them into larger bodies. Radioactive decay of species like 26Al could cause the (partial) melting and consequently crystallization of silicates in sufficiently large parent bodies (e.g. Huss et al. 2001). Afterwards, small crystalline dust grains can be produced by collisions between the processed parent bodies. If the parent body was large enough to fully melt during its accretional phase, it will be differentiated. The crust will be deprived of siderophile elements like Fe/Co/Ni. The composition of the crust will therefore largely be a magnesium-rich silicate, very similar to what is indicated by observations. For a collisional cascade of initially large objects to proceed, the orbits must be sufficiently non-circular to produce large relative velocities. For this one needs many Pluto sized objects or a large Jupiter type planet (e.g. Charnoz et al. 2001; Kenyon & Bromley 2001).
An other possible mechanism for in situ production of crystalline silicates has been proposed by Harker & Desch (2002). They put forward the possibility that shock waves triggered by gravitational instabilities could heat small amorphous grains to sufficiently high temperatures to crystallize. However, this mechanism still implies thermal annealing of small dust grains, and the 8.6 m feature of silica should still be produced in this case.
5.3 Proposed scenario
As we have discussed in the previous two subsections, there are two things that set HD 100546 apart from other HAEBE stars, being its disk geometry and its mineralogy. We propose a scenario which can explain and connect both deviations. In this section we will speculate that a massive planet has formed in the disk at a distance of about 10 AU from the star, and that this planet is responsible for the striking difference in both the mass-temperature distribution and in the chemical composition and crystallographic structure of the dust around HD 100546.
A massive planet will be able to strongly influence planetesimals and the structure of the gas disk within its Hill sphere which is given by (Hill 1878)
| (2) |
where is the semi-major axis of the planets orbit, is the mass of the planet and is the mass of the star. Lin & Papaloizou (1993) showed that a planet will open a gap in the disk if its Hill sphere equals or exceeds the vertical disk scale height. Assuming that before the formation of a planet the disk was very similar to that of AB Aur, the relative disk scale height at 10 AU would have been (Dullemond et al. 2001). Substituting this into Eq. (2), taking into account that the far side of the gap is “puffed up” by a factor of about two (see Sect. 2 and Sect. 5.1), would yield a planetary mass of , indicating a Jupiter type planet. A formation distance of 10 AU for a gas giant seems reasonable to assume, in particular since the temperatures in the disk around a late type B star will be similar at 10 AU to the conditions at 5 AU in the early solar system. It has been suggested that the snow-line, i.e. the line where water ice can condense and remain stable in the disk, has enhanced the densities in the solar disk locally to speed up the accretion of Jupiter (Stevenson & Lunine 1988). This ice condensation zone for the HD 100546 system is located at about 10 AU. Also, the time scale for the formation of a giant planet in the disk region is a few Myrs (Pollack et al. 1996; Hersant et al. 2001), which can easily be accounted for given the estimated age of HD 100546 of 10 Myr (van den Ancker et al. 1998). A planet opening a gap in the disk would also be a natural explanation for the lower near-IR excess of HD 100546 compared to AB Aur. Such a gap could cause the depletion of the inner disk by starvation of material from the outer disk, though Lubow et al. (1999) argue that for planets of MJ still a net flow through the gap can exist not completely clearing the inner region.

As briefly mentioned in Sect. 5.2, the formation mechanism for the crystalline silicates could be a collisional cascade of planetesimals. A Jupiter mass planet can easily “heat up” the orbital elements of a swarm of planetesimals through gravitational stirring, causing sufficiently high relative velocities for collisions to be destructive. Indeed, Stern & Weissman (2001) show that local collisional erosion of planetesimals may be a more important process for planetesimals near a giant planet than ejection to the Oort cloud. An important question is now, how much reprocessed dust can be expected from a collisional cascade of such bodies. Dohnanyi (1969) has shown that the collisional cascade leads to a size distribution or in which the mass is dominated by the largest particles. If the observations measure all particles up to a certain size limit m and the maximum size of planetesimals involved in the collisional cascade is km, then one finds . For the measured amount of crystalline dust of M⊙, one finds a total mass of M⊙. This is more than there is available in the disk. Therefore, the observed dust cannot be the steady state solution of a collisional cascade.
However, the steady state solution assumes that small particles are constantly removed at the low end of the size distribution. If the disk around the star were already gas-free, particles smaller than about 10 m in size would be blown away by radiation pressure (e.g. Artymowicz 1988). However, the disk around HD 100546 very likely is not gas free. Even if large bodies can move around freely on purely Keplerian orbits, the motions of small grains will be slowed down. This will keep small grains in the disk, and it will also drastically reduce the collision velocities between small grains. Therefore, small grains are no longer destroyed in collisions. Grains which are small enough will accumulate in the disk. The density of these grains will not be in collisional equilibrium. It will instead mirror the entire mass of larger bodies destroyed earlier. This greatly softens the mass constraint we derived above. If the small grains accumulate, only of order 1 of crystalline material has to be set free in collisions, a number we can comfortably account for.
We note that the crystalline dust in zone 2 of the small grain component is distributed in the model fit over a larger range than the amorphous dust. One way in which this could be realized is that small dust grains produced by the collisional cascade will be driven out by radiation pressure. Because the disk is flared, the grains will not be able to leave the system, but will “land” further out on the disk surface. There they will enrich the super-heated disk surface layer which is known to be responsible for the features in the spectra of irradiated flaring disks (Chiang & Goldreich 1997). This redistribution of processed dust is similar to the model proposed by Shu et al. (1996) for the origin of Chondrules and calcium-aluminum rich inclusions (CAIs) in meteorites. In the Shu et al. model, grains are lifted off the disk by the jet which is leaving the disk very close to the star in the active accretion phase of the disk. The grains then are heated up to melting temperatures by the stellar light and transported to larger distances by radiation pressure. In what we propose, the grains are produced by fragmentation of larger bodies, and are scattered out of the disk. Small grains for which radiation pressure is dynamically important will be driven away from the star and by a combination of gravity and disk geometry land further out on the disk surface. This is the location where we see these grains today. A schematic representation of the above sketched disk structure and processes is plotted in Fig. 10.
An alternative scenario for the in situ formation of the crystalline silicates is annealing by nebular shocks. Harker & Desch (2002) argue that local gravitational instabilities, likely to exist in protoplanetary disk beyond 5 to 10 AU, could cause shocks. These shocks could sufficiently heat small (m) amorphous grains in order to crystallize them. Interestingly, a developing planet, opening a gap in the disk, would produce shock waves through tidal interaction with the disk (e.g. Lin & Papaloizou 1980, 1993). However, the thus generated shocks should radially extend over the very wide observed region of the forsterite grains. It remains to be seen whether the gas densities are high enough in regions extending far beyond 10 AU for this mechanism to be effective.
The consequence of the above proposed scenario is that Hale-Bopp, given the very similar dust composition, may contain material formed by collisions of bodies formed earlier on in the history of the Solar system. The thermal contact of the dust species in Hale-Bopp implies that we are not witnessing the destruction of Hale-Bopp type objects in the HD 100546 system, but the creation of the material similar to that which formed Hale-Bopp before the dust grains coagulated. Interestingly this would place the formation of Hale-Bopp after the formation of one or more of the gas planets in our solar system.
6 Summary
We can summarize the results of our analysis of the ISO-spectra of HD 100546 and comet Hale-Bopp as follows:
-
1.
The ISO/SWS spectra of HD 100546 and comet Hale-Bopp can be fitted with very similar dust compositions and properties. In both cases, the bulk of the material is dominated by amorphous silicates with carbonaceous grains as the second most important constituent. In addition, significant amounts of forsterite, crystalline water ice, metallic iron and iron sulfide are present.
-
2.
There is one major difference in the dust properties of the two investigated objects. The chemical constituents of the dust in Hale-Bopp are found to be in thermal contact while this is not the case for HD 100546.
-
3.
The fraction of crystalline silicates, i.e. forsterite and/or very iron poor olivine, in HD 100546 increases with decreasing temperature, i.e. with increasing radial distance from the central star. Such a distribution is not in agreement with predictions by radial mixing models. In such models the crystals are formed by thermal annealing in the very inner parts of the disk and are subsequently transported out and mixed with amorphous material.
-
4.
HD 100546 shows a component of small grains ( 10 m) with temperatures of about 200 K that emits in the mid-IR and that is not present in the spectra of other Herbig Ae/Be stars.
-
5.
At about the distance where the bulk dust temperature is 200 K, i.e. at 10 AU, the vertical extent of the disk must be in excess of that expected in a standard flaring disk model. This is required to explain the large fraction of stellar light intercepted and re-emitted by grains emitting in the mid-IR.
-
6.
On the basis of the above three results, we propose the following scenario: the crystalline dust is produced by collisional destruction of differentiated objects. These collisions are probably induced by gravitational interaction with a proto-Jupiter. The grain component emitting at 200 K may be identified by the dust expected to be produced in the collisional cascade that is thought to occur when large bodies collide. This predominantly crystalline material may be driven out by radiation pressure and “land” further out on the (flaring) disk surface. The gap cleared out by the proto-Jupiter allows direct stellar light to produce an extended rim or wall at the far side of the gap. It is thought to be this rim that intercepts the radiation responsible for the strong mid-IR component in the spectrum of HD 100546.
-
7.
The similarity in spectral appearance between HD 100546 and Hale-Bopp implies that similar processes in the early history of our solar system may have been relevant for the formation of Hale-Bopp. The comet may have assembled from debris dust produced through collisions of differentiated objects.
References
- Artymowicz (1988) Artymowicz, P. 1988, ApJ, 355, L79
- Augereau et al. (2001) Augereau, J. C., Lagrange, A. M., Mouillet, D., & Ménard, F. 2001, A&A, 365, 78
- Bertie et al. (1969) Bertie, J. E., Labbé, H. J., & Whalley, E. 1969, JChPh, 50, 4501
- Bockelée-Morvan et al. (2000) Bockelée-Morvan, D., Gautier, D., Hersant, F., Huré, J. M., & Robert, F. 2000, in AAS/Division of Planetary Sciences Meeting, Vol. 32, 4407
- Bohren & Huffman (1983) Bohren, C. F. & Huffman, D. R. 1983, Absorption and scattering of light by small particles (New York: Wiley, 1983)
- Bouwman (2001) Bouwman, J. 2001, PhD thesis, AA (Astronomical Institute “Anton Pannekoek”, University of Amsterdam, Kruislaan 403, 1098 SJ Amsterdam, The Netherlands)
- Bouwman et al. (2000) Bouwman, J., de Koter, A., van den Ancker, M., & Waters, L. 2000, A&A, 360, 213
- Bouwman et al. (2001) Bouwman, J., Meeus, G., de Koter, A., et al. 2001, A&A, 375, 950
- Brucato et al. (1999) Brucato, J. R., Colangeli, L., Mennella, V., Palumbo, P., & Bussoletti, E. 1999, Planet. Space Sci., 47, 773
- Charnoz et al. (2001) Charnoz, S., Thébault, P., & Brahic, A. 2001, A&A, 373, 683
- Chiang & Goldreich (1997) Chiang, E. & Goldreich, P. 1997, ApJ, 490, 368
- Crovisier et al. (1997) Crovisier, J., Leech, K., Bockelee-Morvan, D., et al. 1997, Science, 275, 1904
- Dohnanyi (1969) Dohnanyi, J. W. 1969, J. Geophys. Res., 2531
- Dorschner et al. (1995) Dorschner, J., Begemann, B., Henning, T., Jäger, C., & Mutschke, H. 1995, A&A, 300, 503
- Dullemond et al. (2001) Dullemond, C. P., Dominik, C., & Natta, A. 2001, A&A, in press
- Gail (1998) Gail, H. P. 1998, A&A, 332, 1099
- Gail (2001) Gail, H.-P. 2001, A&A, 378, 192
- Gehrz & Ney (1992) Gehrz, R. D. & Ney, E. P. 1992, Icarus, 100, 162
- Greenberg & Hage (1990) Greenberg, J. M. & Hage, J. I. 1990, ApJ, 361, 260
- Hallenbeck et al. (2000) Hallenbeck, S. L., Nuth, J. A., & Nelson, R. N. 2000, ApJ, 535, 247
- Harker (1999) Harker, D. E. 1999, PhD thesis, , U. Wyoming, (1999)
- Harker & Desch (2002) Harker, D. E. & Desch, S. J. 2002, ApJ, 565, L109
- Henning et al. (1995) Henning, T., Begemann, B., Mutschke, H., & Dorschner, J. 1995, A&AS, 112, 143
- Henning & Stognienko (1996) Henning, T. & Stognienko, R. 1996, A&A, 311, 291
- Herbig (1960) Herbig, G. H. 1960, ApJS, 4, 337
- Hersant et al. (2001) Hersant, F., Gautier, D., & Huré, J. 2001, ApJ, 554, 391
- Hill (1878) Hill, G. 1878, American J. Math., 1, 5
- Hony et al. (2001) Hony, S., van Kerckhoven, C., Peeters, E., et al. 2001, A&A, 370, 1030
- Huffman & Stapp (1973) Huffman, D. R. & Stapp, J. L. 1973, in IAU Symp. 52: Interstellar dust and related topics, Vol. 52, 297
- Huss et al. (2001) Huss, G. R., MacPherson, G. J., Wasserburg, G. J., Russell, S. S., & Srinivasan, G. 2001, Meteoritics and Planetary Science, 36, 975
- Jäger et al. (1998) Jäger, C., Molster, F. J., Dorschner, J., et al. 1998, A&A, 339, 904
- Jones & Merrill (1976) Jones, T. W. & Merrill, K. M. 1976, ApJ, 209, 509
- Keller et al. (2000) Keller, L., Bradley, J., Bouwman, J., et al. 2000, in Lunar and Planetary Science Conference, Vol. 31, 1860+
- Kemper et al. (2001) Kemper, F., Waters, L. B. F. M., de Koter, A., & Tielens, A. G. G. M. 2001, A&A, 369, 132
- Kenyon & Bromley (2001) Kenyon, S. J. & Bromley, B. C. 2001, AJ, 121, 538
- Kessler et al. (1996) Kessler, M. F., Steinz, J. A., Anderegg, M. E., et al. 1996, A&A, 315, L27
- Koike et al. (2000) Koike, C., Tsuchiyama, A., Shibai, H., et al. 2000, A&A, 363, 1115
- Kurucz (1993) Kurucz, R. 1993, CD-ROM Nos. 1-18, Cambridge, Mass.: Smithsonian Astrophysical Observatory
- Lellouch et al. (1998) Lellouch, E., Crovisier, J., Lim, T., et al. 1998, A&A, 339, L9
- Li & Greenberg (1998) Li, A. & Greenberg, J. M. 1998, ApJ, 498, L83
- Lin & Papaloizou (1980) Lin, D. N. C. & Papaloizou, J. 1980, MNRAS, 191, 37
- Lin & Papaloizou (1993) Lin, D. N. C. & Papaloizou, J. C. B. 1993, in Protostars and Planets III, 749–835
- Lisse et al. (1998) Lisse, C. M., A’Hearn, M. F., Hauser, M. G., et al. 1998, ApJ, 496, 971
- Lubow et al. (1999) Lubow, S. H., Seibert, M., & Artymowicz, P. 1999, ApJ, 526, 1001
- Malfait et al. (1999) Malfait, K., Waelkens, C., Bouwman, J., de Koter, A., & Waters, L. 1999, A&A, 345, 181
- Malfait et al. (1998) Malfait, K., Waelkens, C., Waters, L., et al. 1998, A&A, 332, L25
- Mannings & Sargent (1997) Mannings, V. & Sargent, A. I. 1997, ApJ, 490, 792
- Mannings & Sargent (2000) —. 2000, ApJ, 529, 391
- Mason et al. (2001) Mason, C. G., Gehrz, R. D., Jones, T. J., et al. 2001, ApJ, 549, 635
- Mathis et al. (1977) Mathis, J. S., Rumpl, W., & Nordsieck, K. H. 1977, ApJ, 217, 425
- Meeus et al. (2001) Meeus, G., Waters, L., Bouwman, J., et al. 2001, A&A, 365, 476
- Mukai & Koike (1990) Mukai, T. & Koike, C. 1990, Icarus, 87, 180
- Pollack et al. (1996) Pollack, J. B., Hubickyj, O., Bodenheimer, P., et al. 1996, Icarus, 124, 62
- Preibisch et al. (1993) Preibisch, T., Ossenkopf, V., Yorke, H. W., & Henning, T. 1993, A&A, 279, 577
- Prinn (1990) Prinn, R. G. 1990, ApJ, 348, 725
- Rogers et al. (1983) Rogers, C., Martin, P. G., & Crabtree, D. R. 1983, ApJ, 272, 175
- Scott & Duley (1996) Scott, A. & Duley, W. W. 1996, ApJS, 105, 401
- Servoin & Piriou (1973) Servoin, J. L. & Piriou, B. 1973, phys. stat. sol., 55, 677
- Shu et al. (1996) Shu, F. H., Shang, H., & Lee, T. 1996, Science, 271, 1545
- Smith et al. (1994) Smith, R. G., Robinson, G., Hyland, A. R., & Carpenter, G. L. 1994, MNRAS, 271, 481
- Stern & Weissman (2001) Stern, S. A. & Weissman, P. R. 2001, Nature, 409, 589
- Stevenson (1990) Stevenson, D. J. 1990, ApJ, 348, 730
- Stevenson & Lunine (1988) Stevenson, D. J. & Lunine, J. I. 1988, Icarus, 75, 146
- Steyer (1974) Steyer, T. R. 1974, PhD thesis, The university of Arizona.
- van den Ancker et al. (2000) van den Ancker, M., Bouwman, J., Wesselius, P., et al. 2000, A&A, 357, 325
- van den Ancker et al. (1998) van den Ancker, M. E., de Winter, D., & Tjin A Djie, H. R. E. 1998, A&A, 330, 145
- van den Ancker et al. (2001) van den Ancker, M. E., Meeus, G., Cami, J., Waters, L. B. F. M., & Waelkens, C. 2001, A&A, 369, L17
- Waelkens et al. (1996) Waelkens, C., Waters, L. B. F. M., de Graauw, M. S., et al. 1996, A&A, 315, L245
- Wooden et al. (2000) Wooden, D. H., Butner, H. M., Harker, D. E., & Woodward, C. E. 2000, Icarus, 143, 126
- Wooden et al. (1999) Wooden, D. H., Harker, D. E., Woodward, C. E., et al. 1999, ApJ, 517, 1034