Luminous Supersoft X-Ray Sources in External Galaxies
Abstract
We use a set of conservative criteria to identify luminous supersoft X-ray sources (SSSs) in external galaxies. We test this approach on blackbody models, and then apply it to Chandra data from galaxies: an elliptical (NGC 4967), face-on spirals (M101 and M83), and an interacting galaxy (M51). We find SSSs in every galaxy, and estimate that the total SSS population of sources with erg s-1 in each galaxy is at least several hundred and could be significantly larger. In addition, we discover two intriguing features of galactic populations of SSSs. First, there are significant subpopulations of high-luminosity sources; the bolometric luminosities can exceed erg s Second, in the spiral galaxies M101, M83 and M51, SSSs appear to be associated with the spiral arms. This may indicate that some SSSs are young systems, possibly younger than years.
1 Introduction
Luminous supersoft X-ray sources (SSSs) are characterized by values of on the order of tens of eV, and luminosities greater than erg s-1. The corresponding effective radii are comparable to those of white dwarfs (WDs). Indeed, some hot WDs and pre-WDs have been observed as SSSs (see Greiner 2000), including several recent novae, symbiotic systems, and a planetary nebula (PN). More than half of all SSSs with optical IDs, however, do not seem to be examples of systems of known types. It is the mysterious nature of these other systems that has excited much of the interest in SSSs. A promising model is one in which matter from a Roche-lobe-filling companion accretes onto the WD at rates so high ( yr-1) that it can undergo quasi-steady nuclear burning (van den Heuvel et al. 1992; Rappaport, Di Stefano & Smith 1992; Hachisu, Kato & Nomoto 1996, Di Stefano & Nelson 1996). Because matter that is burned can be retained by the WD, some SSS binaries may be progenitors of Type Ia supernovae.
There is indirect evidence that nuclear-burning WDs (NBWDs) with a Roche-lobe-filling donor exist in nature. The majority of the SSS binaries whose nature has not yet been determined are considered to be candidates for the “close-binary SSS” (CBSS) model, in which mass transfer is driven on the thermal time scale of a donor whose Roche lobe shrinks as mass transfer proceeds. Nevertheless, studies of the Magellanic Cloud and Milky Way candidates for this or other NBWD models have not yet found direct evidence for the presence of a WD or of a donor. We do know, however, that an X-ray pulsar may present itself an SSS. RX J0059.2-7138 has a non-pulsed luminous ( ergs s-1), soft ( eV) component (Hughes 1994). Observers outside of the beam of the hard pulsed radiation would classify the source as an SSS. This example serves to illustrate the danger of assuming that all SSSs whose natures we do not yet understand are NBWDs. We also note that the stripped cores of giant stars that have been tidally disrupted by massive black holes are expected to appear as SSSs for times ranging from to years (Di Stefano et al. 2001). Several such stripped cores could be present within kpc of the nuclei of galaxies harboring high-mass black holes.
Because gas obscures of the Milky Way’s SSSs, studies of the size and characteristics of galactic populations of SSSs can be carried out only in external galaxies. Here we apply a single set of conservative criteria, applicable to both Chandra and XMM data, to identify SSSs in galaxies, allowing direct comparisons of their SSS populations.
1.1 A Phenomenological Definition of SSSs
Most SSS spectra are similar to blackbody spectra, although the inclusion of WD atmosphere effects has produced some improved fits. Early definitions of the class assumed eV, but this upper limit is unrealistic, since even the flagship SSS CAL 87, has eV eV (Greiner 2000). In total, of the CBSS candidates have estimated upper limits on larger than eV, and also have lower limits above eV, as does the Galactic recurrent nova U Sco, a system which has almost certainly experienced an episode of nuclear burning. There are also theoretical arguments for an upper limit above eV. For example, WDs with masses close to the Chandrasekhar limit are expected to have near eV. To derive an extreme upper limit, we note that a WD with Eddington-luminosity nuclear burning on its surface would have eV. Because the effective radius is likely to be larger than the radius of the WD, expected temperatures are lower, unless some of these systems can circumvent the Eddington limit.
There is an independent reason to place the division between SSSs and and other X-ray sources at eV (Di Stefano & Kong 2003). This is that Chandra’s detector response (which is similar to that of XMM in the soft energy regime), is such that sources below this temperature do not contribute to radiation in the “hard” waveband above keV, while sources with eV do exhibit a hard X-ray component (see Di Stefano & Kong 2003).
If there are sources with temperatures greater than eV but less than eV, these are interesting in any case. They could represent (1) an extension of the class of SSSs, (2) low-T supernova remnants (SNRs); these can be distinguished from X-ray binaries through variability studies, or (3) a new class of intermediate temperature X-ray binaries.
The following phenomenological definition selects from the pool of all X-ray sources detected in an external galaxy, the majority of those sources which are SSSs, regardless of their physical nature. An X-ray source is an SSS if either of the following conditions are met. (1) The spectrum is well-fit by a blackbody model with eV, or (2) Whatever the best fit model, fewer than of the energy is carried by photons with energy greater than keV. The reason for this condition is that, even if the spectrum starts out as a pure blackbody spectrum, interactions of the radiation with matter near the source, or wind interactions (expected for many SSSs that are quasi-steady NBWDs) can add a small harder component. 111The choice of is rather arbitrary; future studies of larger numbers of SSSs may suggest that this criterion be altered. For now we allow as much as of the energy to come in at energies above keV, because this is roughly consistent with efficient reprocessing or with, e.g., the presence of a companion emitting a strong shocked wind. We do not allow higher values, simply because we want to reserve the SSS classification for sources whose spectrum is clearly dominated by the soft component.
Most sources in external galaxies provide too few photons for a meaningful spectral fit. In M101, e.g., of sources provide fewer than photons, sources provide fewer than photons, and provide fewer than photons. It is therefore important to design a uniform procedure to identify those SSSs (the majority) providing fewer than photons. The selection procedure introduced and applied in this paper preferentially selects sources with eV.
2 Selection Criteria
2.1 The HR Conditions
In this paper we will employ strict hardness ratio (HR) criteria to identify SSSs. We use energy bins to define hardness ratios: S: 0.1-1.1 keV, M: 1.1-2 keV, H: 2-7 keV. We consider hardness ratios, HR1 and HR2, demanding that
| (1) |
and
| (2) |
These conditions imply that , and .
We also introduce additional hardness ratios that include uncertainties.
| (3) |
and
| (4) |
where , , and are the one- uncertainties in , , and respectively. Conditions (3) and (4) strengthen the criteria, implying that , and . Sources satisfying these conditions are denoted “SSS-HRs”.
For sources that do not provide many photons, the precise definitions of and play a crucial role in determining which X-ray sources are tagged as SSS-HRs. There are sources of uncertainty: background, and counting statistics. For each of the bins, we use where is the number of counts extracted from a background region of area equal to that of the source region, is the background-subtracted number of photons extracted from the source region, and is the one- uncertainty in . Since, for Chandra observations, the background is generally negligible, the sizes of and can depend primarily on the value of for each bin. For small values of ; for large values of we have We have chosen to represent by a function that (1) is exactly equal to the appropriate small- values for (2) approaches , for large and (3) interpolates between the two at intermediate values. The interpolation formula gives a value of near 2 for and closely approximates for
Given these prescriptions, the designation SSS-HR requires that the band receive more than photons if no photons arrive in either the or bands, while must receive more than photons if there is even a single photon in either or
2.2 Selected Sources
In cases in which is below cm-2, and in which the count rate is high enough that photon statistics do not significantly alter the values of the hardness ratios, the HR conditions will select most SSSs with spectral profiles like those of the nearby SSSs (Greiner 2000). For example, a eV source behind a column of cm-2 will easily satisfy the HR conditions if it provides enough counts. Several circumstances can, however, make this or other true SSSs fail to fulfill the HR criteria. For example, a low count rate, combined with the vagaries of photon statistics will sometimes cause a large enough deficit of photons below keV, and a also a large enough excess of photons with energies above keV, to cause a true SSS to fail the HR conditions. Thus, as the tests described below illustrate, the HR conditions will select only the strongest candidates SSSs.
2.3 Tests
We performed a set of simulations, applying the HR criteria to each of a large number of blackbody sources used to seed galaxies similar to those we will study in §3. Each seeded source was characterized by physical parameters: ( eV keV), ( erg s-1), and ( erg s cm-2). We used the PIMMS software (AO3 release) to compute the counts that would be detected in a ksec ACIS-S observation if each physical source were located in a galaxy Mpc, Mpc, and Mpc away. Using PIMMS in ACIS-S mode is equivalent to assuming that each source is located near the center of the backside illuminated S3 chip.
For each physical source and for each energy bin we used values of a random variable to choose the number of photons detected: etc. Choosing uniformly over the interval slightly overestimates the effects of the uncertainties.
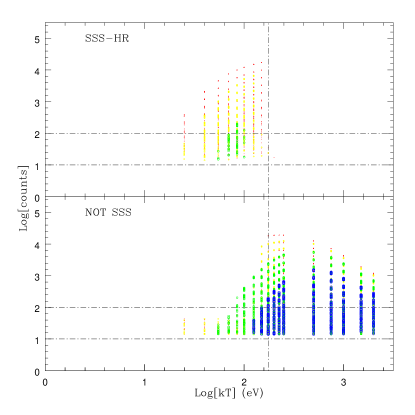
Each galaxy was seeded with 12920 X-ray sources, of which 6080 were SSSs. We applied the HR conditions only to sources that provided more than photons. Figure 1 is a graphical representation of the results for a galaxy located at Mpc, seeded with sources with a maximum luminosity, of erg s-1. The region for which the selection criteria are most relevant is the one located between the horizontal lines. (The upper horizontal line corresponds to counts. Sources providing more counts can be fit by spectral models, so a selection procedure is less crucial.) Examination of this region reveals that the HR conditions work very well for eV eV. For low to moderate absorption they select a fair fraction of sources at eV, and eV, and eV, and only a few unabsorbed sources with eV.
As Figure 1 indicates, the HR conditions can successfully identify high-count ( count) SSSs with little contamination from non-SSSs. Since, however, the conditions are not strictly needed for these high-count cases, we present in Table 1 test results only for those cases in which the selection procedure can work ( counts) and in which it is needed ( counts). The numbers of SSSs providing between and counts were for the galaxy at Mpc, for the galaxy at Mpc, and for the galaxy at Mpc. In each galaxy, approximately of all the seeded SSSs with counts in the range were selected as SSSs by the HR conditions. (See Table 1.) Furthermore, among the sources identified as SSS-HRs, the level of contamination was minimal. With more than true SSSs identified as SSS-HRs, there were , , and , outliers mistakenly identified as SSSs in the galaxies at , and Mpc, respectively. All of these outliers were located behind small gas columns ( cm-2), had small count rates, and satisfied the HR conditions only because of the effects of limited photon statistics. Most of the outliers had eV, while of the had eV; thus, even the outliers were remarkably soft X-ray sources.
Examination of both Figure 1 and Table 1 reveal that the HR conditions do have a weakness: they fail to identify a significant fraction of true SSSs. For large values of ( erg s-1), roughly half of all SSSs sources yielding between and counts were not identified as SSS-HRs. Although the most heavily absorbed sources were most likely to be missed (particularly if was near eV), sources with less absorption and low-temperature sources were also missed by the HR criteria. The simulation carried out with a smaller value of ( erg s-1), demonstrates that the fraction of SSSs not selected is larger for low-luminosity sources, particularly in more distant galaxies, even though only sources providing more than counts were considered.
| erg s-1 | erg s-1 | ||||
|---|---|---|---|---|---|
| Distance | (a) | (b) | (a) | (b) | |
| D=5 Mpc | 598 (4)(c) | 627 | 310 (4) | 337 | |
| D=10 Mpc | 554 (7) | 552 | 147 (3) | 212 | |
| D=15 Mpc | 513 (3) | 508 | 52 (3) | 133 | |
For each galaxy distance (rows: Mpc, Mpc, Mpc), two sets of simulations were carried out. In one set of simulations, erg s-1, where is the maximum luminosity of any seeded source. In the second set of simulations, erg s-1.
(a) is the number of SSS-HRs with between and counts.
(b) is the number of SSSs with between and counts not identified as SSS-HRs.
(c) The numbers in parentheses are the numbers of sources that are not SSSs, but which are identified as SSS-HRs. All such mis-identified sources have eV and lie behind small ( cm-2) hydrogen columns.
2.4 Real Chandra Data
Chandra’s ACIS detectors have suffered degradation at low ( 1 keV) energies. This degradation is time dependent and, as it is presently understood, it was not included in the PIMMS AO3 simulations. In the next section, we apply the selection algorithm to real Chandra ACIS-S data taken at different times since 1999. For some of the observations, the AO3 release of PIMMS provides an adequate guide to the flux as a function of temperature and . The progressive low-energy degradation has the effect, however, of making our selection procedures more and more strict when applied to galaxy data taken later and later into Chandra’s mission. For example, when the effects of the low-energy degradation cause there to be only as many counts in the bin as there would have been in the simulated data, while and are relatively unaffected, imposing the requirement that , will be the same as if we had imposed in the simulations. That is, the low-energy degradation makes it more difficult for a true SSS to be identified as such. There is no direct cure for this problem, because we cannot assume that a lack of low-energy photons is due to a lack of sensitivity. Fortunately, even with the degradation, we are able to identify a significant population of SSSs in each galaxy.
Many distant galaxies are large enough that studies of the X-ray source population must analyze the data taken in all of the chips, not just the backside illuminated chip. For example, a galaxy of diameter kpc, located Mpc away, has dimensions of about , and is therefore spread out over at least chips. Even if the galaxy is smaller or more distant, halo studies would include chips in addition to S3. Unfortunately, however, the soft X-ray sensitivity (which varies somewhat even within S3), is dramatically smaller outside of the backside-illuminated chip. An AO3 ACIS-I observation of a eV ( eV) source located behind a column of cm-2, e.g., will collect only () as many photons as if the sources were located on-axis in S3. This inevitably implies that some low-flux SSSs will fail to produce a significant detection in the band. Such sources are lost to any reasonable selection algorithm.
2.5 XMM Observations
The HR criteria were designed to optimize the selection of SSSs as simulated by PIMMS for Chandra ACIS-S observations. As presently formulated, they will have almost the same effect on data from XMM, which offers similar energy coverage but with larger effective area. We compared the sensitivity of XMM/PN (with a thin filter) and Chandra ACIS-S. For SSSs we found that, in the S, M, and H bands, XMM collects , , and times as many photons as Chandra, respectively. This suggests that the primary difference between XMM/PN and Chandra ACIS-S is that the former has somewhat smaller relative sensitivity to photons in the band. XMM observations of distant galaxies do suffer from significantly more background than Chandra observations of the same galaxies. Nevertheless, because of its larger effective area, and also because of the degradation in Chandra’s low-energy sensitivity, XMM may do better in searching for SSSs in regions where source confusion and diffuse gas emission are not problems.
2.6 Foreground and background objects
The field of each galaxy contains X-ray sources unrelated to the galaxy, such as background AGN, and X-ray active foreground stars. Given the exposure times of the galaxies we study in §3, we may expect foreground/background objects in M51, M83, and NGC 4697 (see, e.g., Soria & Wu 2002; Sarazin, Irwin, & Bregman 2001), and close to in the field of M101 (Pence et al. 2001). For the purposes of this paper, we must estimate the fraction of the foreground and background objects likely to be identified by the HR conditions as SSSs. To make this estimate, we have investigated data from the ChaMP (Chandra Multiwavelength Project 222http://hea-www.harvard.edu/CHAMP) archives (P. Green, private communication). In 5 ACIS-S observations with durations ks, no sources satisfied the HR conditions. Therefore, even though there are soft AGN, and even though many X-ray active stars emit soft X-rays, such sources appear unlikely to significantly contaminate the pool of SSS-HR sources.
3 Application to Galaxies
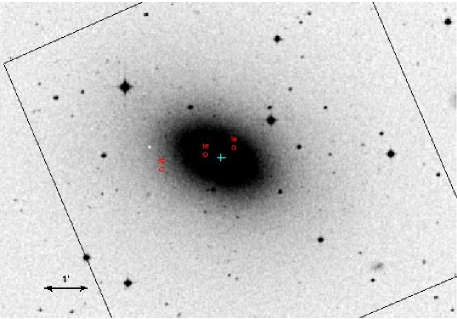
We applied the HR conditions to the X-ray sources in galaxies: spirals and an elliptical. Table 2 summarizes key properties of the galaxies, and of the Chandra observations. M101 lies along a direction with little Galactic absorption and our view of the galaxy is almost face on; it is therefore an ideal place to search for SSSs. M83 is almost face-on and has experienced recent star bursts. M51 is more inclined, and is interacting with another galaxy. For M101 and M51 we generated our own source lists with the CIAO tool WAVDETECT. For M83 we used a source list provided by R. Soria, and for NGC 4697 we used the source list of Sarazin, Irwin, & Bregman (2001). If the lower limit of the energy range that had originally been used by WAVDETECT was higher than keV, we carried out a visual inspection to search for any sources with reliable detections but with few photons detected above keV. Details, and complete source lists can be found in Di Stefano & Kong (2003b). We found SSS-HR sources in the galaxies: of the sources detected in NGC 4697 are SSS-HRs, while the comparable fraction for M101 is (see Table 3).
| Name | Type | Distance | Inclination | Chandra | a | |||
|---|---|---|---|---|---|---|---|---|
| (Mpc) | (arcmin) | (cm-2) | exposure (ks) | |||||
| M101 | Sc | 5.4, 6.71 | 23.8 | 1.2 | 94.4, 9.6b | 2 | 16/118 | |
| M51 | Scc | 7.7, 8.43 | 13.6 | 1.6 | 14.9, 26.8b | 0.1 4 | 3/71; 2/92 | |
| M83 | Sc | 4.575, 4.7 | 11.5 | 3.8 | 49.5 | 0.1 6 | 10/128 | |
| NGC 4697 | E | 11.77, 15.98, 23.3 | 7.1 | d | 2.1 | 39.3 | 1.29 | 3/91 |
NOTE. — All data are from Nearby Galaxies Catalogue (Tully 1988) unless specified. M101 was observed on 2000 March 26 and 2000 October 29b; M51 was observed on 2000 June 20 and 2001 June 23b; M83 was observed on 2000 April 29; NGC 4697 was observed on 2000 January 15.
a Ratio of number of SSSs to total number of X-ray sources.
b The second observation.
c Seyfert 2 galaxy.
d For elliptical galaxies the inclination is given by + acos , where d/D is the axial ratio of minor to major diameter (Tully 1988). This inclination angle is generally unrelated to the value of .
REFERENCES. — 1: Freedman et al. 2001; 2: Moody et al. 1995; 3: Feldmeier et al. 1997; 4: Hagiwara et al. 2001; 5: Karachentsev et al. 2002; 6: Thatte et al. 2000; 7: Tonry et al. 2001; 8: Faber et al. 1989; 9: Ho 2002
| Object | R.A. | Dec. | Soft | Medium | Hard | HR1a | HR2b | |||
|---|---|---|---|---|---|---|---|---|---|---|
| (h:m:s) | Counts | S/N | Counts | S/N | Counts | S/N | ||||
| M101-15(10) | 14:02:59.4 | +54:20:42 | 31.3 | 5.3 | 1.3 | 0.9 | 0.0 | 0.0 | -0.9(-0.9) | -1.0(-0.9) |
| M101-18(13*) | 14:03:01.1 | +54:23:41 | 169.6 | 12.9 | 0.0 | 0.0 | 0.1 | 0.1 | -1.0(-1.0) | -1.0(-1.0) |
| M101-21(16*) | 14:03:02.5 | +54:24:16 | 74.2 | 8.4 | 0.0 | 0.0 | 0.0 | 0.0 | -1.0(-1.0) | -1.0(-1.0) |
| M101-34(27) | 14:03:07.9 | +54:21:23 | 35.7 | 5.8 | 1.8 | 1.2 | 0.0 | 0.0 | -0.9(-0.9) | -1.0(-1.0) |
| M101-37(30*) | 14:03:08.5 | +54:20:57 | 29.3 | 5.1 | 1.0 | 1.0 | 0.0 | 0.0 | -0.9(-0.9) | -1.0(-0.9) |
| M101-38(31) | 14:03:08.6 | +54:23:36 | 20.7 | 4.1 | 0.0 | 0.0 | 0.0 | 0.0 | -1.0(-1.0) | -1.0(-1.0) |
| M101-43(36) | 14:03:10.6 | +54:21:26 | 18.2 | 3.8 | 0.0 | 0.0 | 0.0 | 0.0 | -1.0(-1.0) | -1.0(-0.9) |
| M101-50(43) | 14:03:13.2 | +54:21:57 | 31.3 | 5.3 | 0.0 | 0.0 | 0.4 | 0.3 | -1.0(-1.0) | -1.0(-0.9) |
| M101-51(45*) | 14:03:13.6 | +54:20:09 | 219.1 | 14.6 | 0.3 | 0.2 | 0.0 | 0.0 | -1.0(-1.0) | -1.0(-1.0) |
| M101-55(48) | 14:03:13.9 | +54:18:11 | 34.3 | 5.6 | 1.4 | 1.0 | 0.0 | 0.0 | -0.9(-0.9) | -1.0(-0.9) |
| M101-78(73) | 14:03:22.6 | +54:20:38 | 34.3 | 5.3 | 1.5 | 1.0 | 1.0 | 0.5 | -0.9(-0.9) | -0.9(-0.9) |
| M101-80(75) | 14:03:24.0 | +54:23:37 | 68.7 | 8.0 | 0.8 | 0.5 | 0.0 | 0.0 | -1.0(-0.9) | -1.0(-1.0) |
| M101-97(92) | 14:03:29.8 | +54:20:58 | 71.9 | 7.7 | 0.0 | 0.0 | 0.0 | 0.0 | -1.0(-1.0) | -1.0(-0.9) |
| M101-101(96*) | 14:03:31.9 | +54:23:23 | 30.9 | 5.0 | 0.0 | 0.0 | 0.0 | 0.0 | -1.0(-1.0) | -1.0(-1.0) |
| M101-102(98) | 14:03:32.3 | +54:21:03 | 8512.0 | 92.2 | 658.4 | 25.6 | 68.0 | 8.0 | -0.9(-0.9) | -1.0(-1.0) |
| M101-102 (2nd obs) | 290.2 | 17 | 4.7 | 2.1 | 0.5 | 0.5 | -1.0 (-1.0) | -1.0 (-1.0) | ||
| M101-104(99*) | 14:03:33.3 | +54:18:00 | 227.8 | 14.5 | 0.3 | 0.1 | 1.1 | 0.3 | -1.0(-1.0) | -1.0(-1.0) |
| M83-20 | 13:36:53.9 | -29:48:48 | 43.0 | 5.6 | 2.6 | 1.2 | 2.6 | 1.0 | -0.9(-0.8) | -0.9(-0.8) |
| M83-42 | 13:36:59.1 | -29:53:36 | 30.5 | 5.3 | 0.0 | 0.0 | 0.0 | 0.0 | -1.0(-1.0) | -1.0(-1.0) |
| M83-50 | 13:37:00.4 | -29:50:54 | 105.1 | 10.0 | 0.8 | 0.7 | 0.0 | 0.0 | -1.0(-1.0) | -1.0(-1.0) |
| M83-54 | 13:37:01.1 | -29:54:49 | 132.6 | 11.4 | 1.8 | 1.3 | 0.7 | 0.7 | -1.0(-1.0) | -1.0(-1.0) |
| M83-79 | 13:37:06.1 | -29:52:32 | 108.6 | 10.3 | 1.9 | 1.3 | 0.0 | 0.0 | -1.0(-0.9) | -1.0(-1.0) |
| M83-81 | 13:37:06.5 | -29:54:16 | 15.7 | 3.7 | 0.0 | 0.0 | 0.0 | 0.0 | -1.0(-1.0) | -1.0(-1.0) |
| M83-88 | 13:37:07.4 | -29:51:33 | 17.5 | 3.9 | 0.0 | 0.0 | 0.0 | 0.0 | -1.0(-1.0) | -1.0(-0.9) |
| M83-98 | 13:37:12.8 | -29:50:12 | 35.9 | 5.8 | 2.1 | 1.4 | 1.6 | 1.1 | -0.9(-0.8) | -0.9(-0.9) |
| M83-111 | 13:36:59.5 | -29:52:03 | 78.2 | 8.4 | 5.9 | 2.2 | 2.0 | 1.3 | -0.9(-0.8) | -0.9(-0.9) |
| M83-128 | 13:36:57.7 | -29:53:53 | 29.6 | 5.3 | 1.6 | 1.1 | 0.0 | 0.0 | -1.0(-1.0) | -0.9(-0.8) |
| M51-12 | 13:29:43.3 | +47:11:34 | 272.7 | 16.5 | 5.2 | 2.1 | 1.0 | 1.0 | -1.0(-0.9) | -1.0(-1.0) |
| M51-12 (2nd obs) | 366.0 | 19.1 | 11.4 | 3.4 | 0.0 | 0.0 | -0.9(-0.9) | -1.0(-1.0) | ||
| M51-42 | 13:29:55.4 | +47:11:43 | 14.7 | 3.6 | 0.0 | 0.0 | 0.0 | 0.0 | -1.0(-0.9) | -1.0(-1.0) |
| M51-58 | 13:30:02.3 | +47:12:38 | 20.4 | 4.4 | 0.0 | 0.0 | 0.0 | 0.0 | -1.0(-1.0) | -1.0(-1.0) |
| M51-51 (2nd obs) | 13:29:55.3 | +47:11:26 | 14.6 | 3.4 | 0.0 | 0.0 | 0.0 | 0.0 | -1.0(-1.0) | -1.0(-1.0) |
| NGC4697-16 | 12:48:37.1 | -05:47:58 | 63.0 | 7.9 | 0.0 | 0.0 | 0.0 | 0.0 | -1.0(-1.0) | -1.0(-1.0) |
| NGC4697-19 | 12:48:34.5 | -05:47:49 | 73.7 | 8.5 | 0.9 | 0.9 | 0.0 | 0.0 | -1.0(-1.0) | -1.0(-1.0) |
| NGC4697-52 | 12:48:41.2 | -05:48:19 | 58.6 | 7.5 | 0.0 | 0.0 | 0.7 | 0.7 | -1.0(-1.0) | -1.0(-0.9) |
NOTE.— The object ID in parentheses is from Pence et al. (2001); SSSs selected by Pence et al. (2001) are noted by “*”.
a ; value in parentheses is HR1Δ. b ; value in parentheses is HR2Δ.
3.1 Spectra
Eight sources provided enough photons to allow spectral fits. (Two of these sources permitted spectral fits in each of separate observations.) In NGC 4697, the most distant galaxy, we considered a composite of all SSS-HRs, which happened to have similar spectral profiles in bins of keV from to keV.
Before presenting the results, we note that there is likely to be more systematic uncertainty in fits of SSS spectra than in the fits of spectra associated with any other class of sources. Calibration issues have not been resolved at the softest energies, introducing obvious anomalies into the spectra of bright nearby SSSs. Most SSSs in distant galaxies provide too few photons for these anomalies to be obvious, yet the calibration problems may influence the derived values of and in ways yet to be understood. We proceed anyway, with the caveat that all SSS spectra will need to be revisited once the calibration is complete.
With one exception, blackbody models provided acceptable fits; all values of lie between eV and eV, with cm cm (See Table 4.) Thus, applied to real data, the conditions acted as the simulations predict. The single source that required a 2-component fit was M101-102, as observed in its high state during the long observation, yielding photons. Even in this state, only of the energy was received in photons with energy keV, validating the selection procedure. Three SSS-HR spectra are shown in Figure 2.
It seems fair to assume that those SSS-HRs which provided fewer counts are good SSS candidates. Indeed, the hardness ratios of all of the SSS-HR sources are well within the limits set by Eqns. 1 through 4; roughly of them have HR1HR2
3.2 Connections to Previous Work
SSSs have been selected in of these galaxies by other groups. Sarazin et al. (2001) identified as SSSs all SSS-HRs. Comparison with the work of Pence et al. (2001) on M101 is more difficult. They selected SSSs, but only of them satisfy the HR conditions. While it is not clear why of the SSSs identified by Pence et al. (2001) do not satisfy the HR conditions, it is likely that the SSS-HR sources not selected by Pence et al. (2001) are slightly harder than the sources they targeted. Indeed, the criteria used by Pence et al. (2001) required SSSs to provide of their counts at energies below 0.8 keV, and more than of their counts at energies below 0.5 keV (Pence, private communication). The sources in Pence et al. (2001), should therefore preferentially have near or below eV. Indeed, the first three sources in Table 2 are M101 sources that were also identified as SSSs by Pence et al. (2001), and all have estimated values of below eV. The fourth source in Table 2 is an M101 source that was not identified as supersoft by Pence et al. 2001, presumably because it emits some high-energy photons, in spite of the fact that HR1 and HR2 are and respectively.
| ID | kTa | kTRSb | /dof | Flux c | d | e | |
|---|---|---|---|---|---|---|---|
| (cm-2) | (eV) | (keV) | |||||
| M101-104 | 1.39/9 | 2.11 | 0.74, 1.13 | 3.62, 5.57 | |||
| M101-51 | 0.57/7 | 6.19 | 2.16, 3.32 | 33.53, 51.62 | |||
| M101-18 | 1 (fixed) | 0.96/13 | 1.02 | 0.35, 0.55 | 1.61, 2.47 | ||
| M101-102 (1st) | 1.18/75 | 82.67 | 28.8, 44.4 | 67.94, 104.59 | |||
| M101-102 (2nd) | 0.75/8 | 20.7 | 7.22, 11.11 | 35.0, 53.8 | |||
| M83-50 | 1.24/5 | 1.14 | 0.28, 0.30 | 0.98, 1.03 | |||
| M83-54 | 0.66/7 | 2 | 0.50, 0.53 | 2.26, 2.39 | |||
| M83-79 | 0.33/5 | 4 | 1, 1.1 | 2.69, 2.85 | |||
| M51-12 (1st) | 1.12/15 | 6.17 | 4.38, 5.20 | 11.86, 14.11 | |||
| M51-12 (2nd) | 0.63/9 | 4.82 | 3.42, 4.07 | 9.13, 10.87 | |||
| NGC4697 (3 sources) | 0.66/6 | 1.89 | 3.10, 12.28 | 10.72, 42.51 |
NOTE.— All quoted uncertainties are at the 90% confidence level. The ACISABS model was applied to correct for the low-energy degradation of ACIS (see Kong et al. 2002).
a Blackbody temperature.
b Raymond-Smith temperature.
c Unabsorbed flux ( erg cm-2 s-1) in 0.3–7 keV.
d Luminosity ( erg s-1) in 0.3–7 keV. The upper and lower limits quoted here are based on the farthest and nearest distances, respectively, shown in Table 2.
e Bolometric luminosity ( erg s-1).


3.3 Variability
If the SSSs we discover in other galaxies are X-ray binaries, it is possible for them to exhibit variability on short time scales. Although not every X-ray binary is highly variable, evidence of variability on month-to-year time scales can immediately rule out the hypothesis that the source of the SSS emission is a region as large as pc. Note that variability within an observation can be observed for only the brightest SSSs, such as M101-102. In most cases, the detection of variability can best be accomplished by repeated observations of the same galaxy.
Three of the galaxies considered here have been observed twice. M101 (M83) was observed for ksec ( ksec) and then again for ksec ( ksec). M51 was observed for ksec and ksec. (See Table 2 for the dates of the observations)
3.3.1 M51
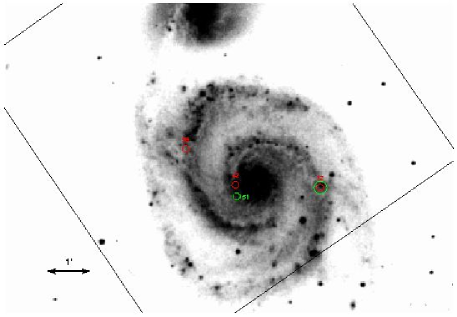
Because the relative observing times are most similar for the M51 observations, we have created source lists for both observations in order to study the variability of the SSSs. The combination of the observations identified SSS-HR sources, each of which was variable at some level.
One SSS-HR from the ksec observation (M51-58-1) was not detected in the ksec observation; based on the detection of photons in the short observation, we would predict photons in the second observation; none were detected. One SSSs from the longer observation (M51-51-2) was not detected in the shorter observation; counts were predicted in the short observation. M51-42-1 (14.7 counts; all in ) exhibits a clear change; it is detected (49.5 counts; M51-52-2) and is soft in the second observation, but is not an SSS-HR. The brightest SSS in M51, M51-12-1/M51-13-2, decreased in flux by between the observations, and became slightly harder (see Figure 3 and Table 2).
The fact that some level of variability is exhibited by all of M51’s SSS-HRs suggests that the majority of SSSs in M51 are not SNRs or other extended emitters.
3.3.2 M101
In both M83 and M101, the shorter observation had a duration only that of the longer observation; we can therefore check for the variability of only the brightest sources. For the purposes of this paper we have checked the position of each SSS-HR identified in the long observation of M101 to determine if a soft source was detected during the ksec observation. Seven of the SSS-HR sources were detected and were soft during the ksec observation (M101-18, 34, 51, 97, 101, 102, 104). We have not determined whether these sources satisfied the HR condition during the short observation, but we do find that the observed count rates during the short observation were consistent with those taken during the long observation in all but one case. Among the long-observation sources that were not detected in the short observation, the predicted numbers of counts range from to . In most cases there were no photons within the PSF. It is very likely that some or even most of the non-detection indicate genuine variability. We can write the probability of the source having the same luminosity as in the long observation but not being detected in the short observation as with in most cases The probability, that all of thirteen sources actually had similar fluxes to those observed in the first observation is therefore Additional observations of long duration are required to quantify the level of variability among M101’s SSS-HR sources.
One of the most exceptional examples of SSS variability found to date is provided by M101-102. In the long observation it is clearly ultraluminous (see also Mukai et al. 2002). In the short observation the flux has declined by a factor of due to a combination of changes in and Furthermore, this source is clearly variable within each observation.
3.3.3 M83
The two brightest SSS-HR sources (M83-54 and M83-79) were not detected in the 2001 short observation. Scaling for the exposure time, we would have expected 12-15 counts from each source. The lack of detection does not prove the sources are transient, but does indicate a significant decrease in flux. We note that two non-SSS sources nearby each had a similar number of counts in the long observation, and are detected again in the short exposure. See Soria & Wu (2003) for a more detailed discussion of variability in M83.
3.4 Spatial Distribution
With our sample of SSSs in external galaxies, it is becoming possible to search for patterns in their spatial distribution within the galaxies; such studies could shed light on the nature and evolution of the sources. Determinations of the relative numbers of SSSs in galactic bulges may allow to us to test the hypothesis that tidal disruption events should produce SSSs that are the hot cores of stripped giants (Di Stefano et al. 2001) There are, however, too few SSS-HRs in the central regions of the spirals studied here to permit meaningful statistical tests at present. Instead we focus on the disk regions, and find an unexpected pattern.
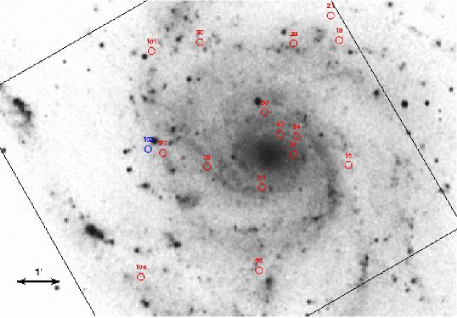
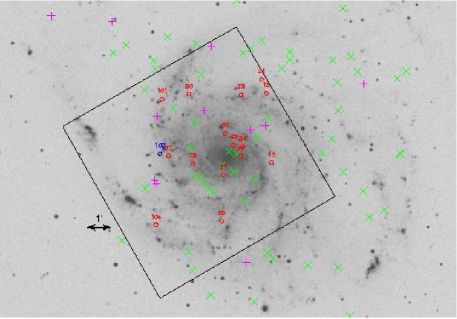
Superposing the positions of the SSSs on optical images of each of the spiral galaxies (Figure ) produces an impression that a large fraction of the SSSs are in the spiral arms. In most cases, populations found in the spiral arms are young populations, with maximum ages on the order of years.
The expected pattern was based on a clear expectation for the nature of the SSSs themselves. Specifically, a large portion of the SSS population was expected to be composed of hot WDs. Since recent novae, hot central stars of PNe and symbiotics have all been observed as SSSs, and in fact comprise nearly half of all SSSs with optical IDs, we expected that at least a fraction of the SSSs in other galaxies should be associated with such systems. In novae and symbiotics, the donor stars are not typically high-mass stars, and they should therefore not presently be associated with young stellar populations. Furthermore, the most popular model for the remainder of the SSSs also invokes a binary with a slightly evolved donor star with a mass between approximately and . SSSs described by these models should therefore also be largely associated with populations of old or intermediate-age stars, and should therefore be spread across the face of spiral galaxies, and not found primarily near concentrations of young stars.
In Figure 4 we show the spatial distribution of novae (red circles marked with dates), PNe (yellow crosses) and SSS-HRs (marked red circles) in M101. As expected, the novae and PNe cover the disk of the galaxy. For example, even though there are only 11 novae, several are located away from the arms and also away from regions with bright blue clumps. The same is true of PNe. In contrast, the SSS-HRs are largely absent from these open spaces, and tend to be located within of bright blue clumps.
At the distance of M101, corresponds to roughly pc, which is the distance a star traveling at km s-1 can cross in yrs. If SSS-HRs are young systems, we would therefore expect to find them within of markers of recent star formation, including bright stars, SNRs, HII regions, and OB associations. Therefore, more convincing than a visual impression of an association between the locations of SSSs and the spiral arms, would be a meaningful statistical correlation between the positions of the SSSs and the positions of markers of young populations. Work is underway to study these correlations in M101 and M83. Below we mention some specific cases in which SSSs are close to optical markers in M101 and M83. The results of a statistical analysis will be reported elsewhere. In M101, one of the SSSs lies within ( pc) of an SNR. Astrometric study is underway to assess the likelihood of a genuine identification. Because the source has a relatively low count rate, we do not have a spectrum.
In addition, distinct SSS-HRs (M101-51,78,80,104), are within of an HII region. We have spectra for of these sources: M101-104 and M101-51 are among the softest sources in our sample, with of eV and eV, respectively.
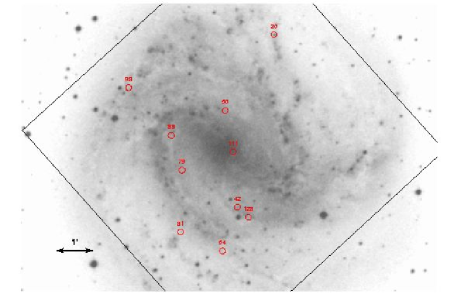
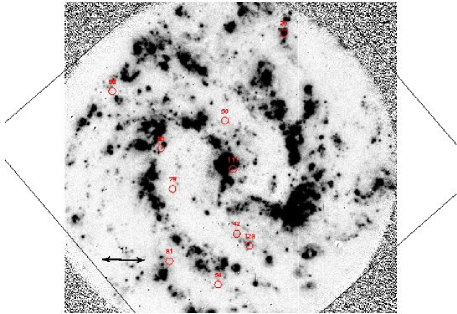
In M83 one of the SSS-HRs (M83-88) is located within of an SNR (R. Soria 2002, private communication). The impression that the SSS-HRs are associated with young objects is reinforced by examining their positions relative to clumps in an Hα image of M83 (Figure .)
We note that our results are consistent with the only other map of SSSs in a spiral galaxy that we are aware of (Swartz et al. 2002). While we cannot verify that the SSSs on their map satisfy the HR conditions, it is interesting to note that or of these sources appear to be located in the spiral arms.
If indeed we can establish a spatial correlation between SSSs and markers of young stellar populations, and if this correlation is significantly larger than the correlations between PNe (and novae) and markers of young stellar populations, then we will be forced to conclude that a substantial fraction of SSSs are members of relatively young stellar populations. The data so far clearly indicate that the SSSs we are viewing in other galaxies are not primarily members of old or intermediate-age populations.


3.5 Luminosities
In most X-ray studies of galaxies, luminosities are estimated for all sources by using a standard spectral model, generally a power law model, to convert the measured count rate to a luminosity. For SSSs, the count rate depends so strongly on the source temperature and on the size of the intervening gas column, that such a simple procedure does not produce meaningful results. We have therefore made luminosity estimates only for the sources for which we have spectral fits (Table 4).
In general, meaningful spectral fits are possible for just a small fraction of all sources in galaxies more distant than Mpc. In NGC 4697, for example, () of all sources provide more than roughly () counts; in M101, () of all sources provide more than roughly () counts. For SSSs, the effects of absorption can compound those of distance, with low-T sources most affected. A eV, erg s-1 source, located 8 Mpc away, and observed for ksec by Chandra’s ACIS-S, will yield approximately and photons if is cm cm and cm respectively. The corresponding numbers of counts for a eV source are and respectively. Given these numbers, which were computed with the AO3 release of PIMMS, , it is clear that it will not be possible to obtain spectra for many extragalactic SSSs with Even higher-temperature SSSs must be very luminous if we are to collect a large number of photons: for an eV erg s-1 source located Mpc from us, the numbers of counts expected for the values of given above are and respectively.
It is therefore remarkable that we were able to extract spectra for of the SSSs found in the galaxies.
3.5.1 ULSs: Ultraluminous SSSs
The most luminous SSS in the galaxies we have studied is M101-102. It’s luminosity during the long exposure was clearly erg s-1; thus, by most definitions, it qualified as an ultraluminous X-ray source. M101-102 is an ultraluminous SSS (ULS), and it is the only source in this data set whose X-ray luminosity alone is erg s
Other sources with bolometric luminosities larger than ergs s-1 are M101-51, M51-12 and, the SSS-HRs in NGC 4697 (if the true distance to that galaxy is close to the maximum estimated distance). These sources must, however, be viewed as weaker ULS candidates, since (a) the number of photons received from them was typically more than an order of magnitude smaller than from M101-102, making the spectral fits less certain, and (b) the derived value of the bolometric luminosity is model-dependent.
Even if the estimates of the bolometric luminosities are too high by an order of magnitude (unlikely to be the case for all of the sources), M101-51, M51-12 and the SSS-HRs in NGC 4697 have luminosities near or above the Eddington limit for a star.
3.5.2 Sources Near the Eddington Limit
The estimated bolometric luminosity of additional sources lies near the Eddington limit for a star. If any of these are NBWDs (whether or not the donor fills its Roche lobe), they are particularly interesting, because they could be Type Ia supernova progenitors with masses near the Chandrasekhar limit.
3.5.3 Sources of Moderate Luminosity
Two-thirds of the SSS-HRs provided only between and counts, with almost half of them providing fewer than counts. Scaling from the high-L systems, and taking the detection limit for each galaxy into account, it is likely that typical SSS-HRs in our sample have luminosities in the range of a few times to erg s-1. That is, unless their temperatures are considerably lower than eV, or the intervening column is large, their luminosities are similar to the luminosities of the local SSSs discovered during the early years of ROSAT.333There are a subset of local SSSs that are associated with CVs; these, like the nova-like variable V751 Cyg (Greiner et al. 1999), are less luminous. Such sources, recognized as SSSs only in recent years, are below our detection threshold.
3.6 Total galactic populations
Based on a small number of ROSAT-identified SSSs, galactic populations of SSSs were estimated to be large, with ergs s-1 sources in spiral galaxies such as the Milky Way and M31 (Di Stefano & Rappaport 1994; Motch, Hasinger & Pietsch 1994). In addition, populations numbering in the hundreds had been conjectured to explain the diffuse soft X-ray emission in some elliptical galaxies (Fabbiano, Kim, & Trinchieri 1994).
Because of the effects of absorption, the SSS-HRs we have detected in each galaxy comprise a small fraction of all of the SSSs within the galaxy. We detect primarily the hottest, brightest SSSs. This effect becomes even more pronounced for distant galaxies and/or for (a) galaxies located along lines of sight with large values of (b) galaxies with large internal gas components, or (c) spiral galaxies with large inclination angles.
To estimate the size of the total population, we must determine what fraction of all the sources we can (1) detect and (2) identify as SSSs. The second requirement is more restrictive, as typically more than photons are needed. Assuming that at least photons are needed we can compute, for each temperature and each value of the minimum luminosity of a detectable SSS in each galaxy. We have done these computations for each value of and used in the PIMMS simulations described in §2.
We have then seeded each of the galaxies with the populations of SSSs used by Di Stefano & Rappaport (1994) to estimate the fraction of SSSs that the ROSAT All-Sky Survey had discovered in the Galaxy, M31, and the Magellanic Clouds. This tells us the fraction of all “classical” SSSs ( eV, erg s erg s-1), that can be detected and identified as SSSs in each galaxy. We have assumed that, if we receive photons from a true SSS, there is a probability of that it will identify the source as an SSS-HR, hence as an SSS.
M101 and M83: The fraction of sources we would detect and identify as an SSS ranged from to , with a median value of . This implies that each “classical” SSS detected represents between and M101 SSSs, with a median expectation value of . If we assume that roughly half of the SSS-HR sources in each of these two galaxies represent “classical” SSSs, then the number of “classical” SSSs in each galaxy must lie between and
M51 and NCG 4697: Because of the greater distance to these two galaxies (particularly for NGC 4697), and because of the relatively high inclination of M51, we can detect a much smaller fraction of all “classical” SSSs in these galaxies. We compute that the fraction of detectable SSSs lies between and for M51 and between and for NCG 4697. If, therefore, even one of the SSS-HRs in each galaxy corresponds to a “classical” SSS, the underlying population of SSSs in these galaxies is large, likely to be on the order of We note that, especially for these galaxies, it is difficult to judge whether the few SSS-HRs we have identified are similar to the classical systems, or if they belong to a hotter and more luminous subclass of SSSs. Even in the latter case, however, it is unlikely that the entire population of SSSs happens to have luminosities and temperatures high enough to bring them over the detection limit. It is therefore all but certain that the SSS population consists of a significantly larger number of sources than we have been able to detect.
In all cases, a large portion of the population of SSSs, the portion corresponding to low luminosities ( erg s-1) and/or low-temperatures ( eV), is unconstrained. It is therefore worth noting that, in our galaxy, some CV systems have been identified as low-L SSSs; the numbers of such systems in our own Galaxy may be ten times larger than the numbers of “classical” SSSs. In galaxies beyond the Local Group, we can only hope to detect such sources indirectly, e.g., by observations of diffuse soft emission.
In order to improve the estimates for that portion of the SSS population (the hotter and more luminous sources) that can be directly detected and/or constrained through Chandra and XMM observations, several steps, including the following, can be taken: (1) more sensitive sampling of the values of in the simulations, (2) measurements of in the galaxies, tying the location of the detected sources to the local values of .
At present it seems likely that each of the galaxies we have studied houses a population of SSSs that consists of at least a few hundred sources with erg s-1. . Additional observations and more sophisticated analyses will improve this estimate.
4 Interpretation
4.1 The HR Conditions
Supersoft X-ray sources form a large and intriguing component of galactic X-ray source populations. As Chandra and XMM discover more SSSs in external galaxies, comparative studies will provide important clues to the natures and physical characteristics of the sources. Such studies require a uniform selection procedure. In this paper we take a first step toward developing a systematic procedure to select SSSs from a galactic population of X-ray sources.
In the absence of a single well-tested physical model, we start with an empirical spectral definition of SSSs. Our definition (§1.1) includes all X-ray sources emitting of their flux in photons with energies keV.
To identify SSSs in external galaxies, selection criteria are needed to assess sources providing too few counts for meaningful spectral fits–i.e., the vast majority of all sources. In this paper we have introduced a strict set of criteria, the “HR conditions”, which preferentially select SSSs with eV. Indeed, SSS-HR’s, i.e., sources satisfying the HR conditions, should have spectral characteristics most similar to those of the SSSs discovered locally (in the Magellanic Clouds and Milky Way), with limited contributions from sources with eV and virtually no contamination from sources with eV.
The clear advantage of the HR conditions is that they are conservative. We therefore expect that applying them will provide insight into the nature of sources with spectra like those of the flagship sources discovered so far in the Magellanic Clouds and Milky Way. In some ways, the study of SSS-HRs in galaxies has verified expectations based on the local sample of SSSs, but this study has also produced some surprises.
4.2 Results from galaxies
Applying these conservative conditions to Chandra data from galaxies allows us to establish that SSSs are an important component of galactic X-ray binary populations. Based on observations of SSS-HRs in each of the galaxies we studied, we estimate that the minimum number of SSSs with erg s-1 in typical galaxies is likely to be in the hundreds. The numbers of lower- sources remain unconstrained by the observations carried out to date. In addition we appear to have discovered a sub-population of more luminous SSSs that are not present in the Magellanic Clouds and Milky Way.
4.2.1 The most luminous SSSs
The spiral galaxies in our sample, and perhaps the elliptical as well, appear to house small populations of SSSs that are ultraluminous. These ULSs could very well be accreting intermediate-mass BHs. Their luminosities and temperatures are consistent with what is predicted for accreting BHs with masses between roughly and .
Others of the sources appear not to be ultraluminous, but do have luminosities that are near-Eddington or super-Eddington for a object. Some of these could be accreting WDs with masses approaching the Chandrasekhar mass (Di Stefano 2003, in preparation).
4.2.2 Young SSSs?
The spatial distribution of SSS-HRs is not consistent with a population dominated by old stellar systems. At present it seems likely that, at least in spiral galaxies, the population of SSSs includes some systems with ages years. While some SNRs may exhibit SSS-like emission, the SSS-HRs which we have been able to test for variability appear not to be SNRs. At least a significant fraction are therefore likely to be X-ray binaries.
The age of a binary when it emits X-rays is generally determined by the age of the donor star when it either fills its Roche lobe or emits a large enough stellar wind that its compact companion can receive mass at rates in the range yr-1. A Roche-lobe filling donor can transfer mass at these rates to a WD in a dynamically stable way only if it is not too much more massive than the WD. Masses of are allowed. Such systems should not be primarily associated with the spiral arms. In order for such rates to be achieved when the mass transfer occurs through a stellar wind, the donor must be very evolved. Only stars with masses greater than can become so evolved in times shorter than years. If the accretor is a WD, the system would be a symbiotic; symbiotics typically have donors of lower mass (see Kenyon 1986). On the other hand, high-mass X-ray binaries (HMXBs) in which the donor is a high-mass star and the accretor is a neutron star or BH are well known. Indeed, the X-ray pulsar with the luminous soft component, RX J0059.2-7138, has been conjectured to be an HMXB (Hughes 1994). It is very likely, therefore, that at least some SSSs found near star-forming regions have BH or neutron star accretors.
4.3 Status of the WD Models
Although the spatial distribution of SSSs in the galaxies we have studied so far appears to be indicative of a younger population than we expected to find, it would be premature to conclude that the WD models of SSSs are not correct. It seems more likely that we have discovered new populations that supplement those we had hoped to find.
For example, within our own Galaxy, we would be unable to discover soft sources, even luminous soft sources, located in star forming regions. This study of M101, M83, and M51, which are all located behind relatively small gas columns, and which are less inclined than M31, has provided the first opportunity to systematically search for SSSs among young stellar populations.
Even if our conjecture is correct, i.e., some of the SSSs we have discovered are not hot WDs, some SSSs in these 4 galaxies could be hot WDs. Further observations and even work with existing data may be able to determine the relative contributions of SSSs in young and old stellar systems. (See §5.2.)
5 Prospects
5.1 Selection Criteria
If the fact that the HR conditions are conservative selectors of SSSs is their strength, it is also a weakness that prevents them from identifying a significant fraction of all SSSs. In tests based on simulations, the HR conditions fail to select about of all SSSs. (See Table 1 and Figure 1.) The fraction of missed SSSs could be larger, and in fact is almost certainly progressively larger in Chandra observations taken progressively later than the time of launch. The number of photons in the S band will, by 2004, be a factor of smaller for some sources than predicted in the simulations we have used. (See the recent AO5 PIMMS release: for a hydrogen column of cm-2, the S counts predicted for AO5 are , , and of what they were in the AO3 predictions for a eV, eV, and eV source, respectively.) Clearly a more comprehensive set of criteria are needed. We will return to this issue in a separate paper (Di Stefano & Kong 2003).
5.2 The Physical Nature of SSSs
This first comparative look at SSSs in external galaxies raises intriguing questions about the nature of the sources. The following observations will help determine the answers.
(1) Repeated X-ray observations. These will allow us to (a) test the hypothesis that some of the SSSs are SNRs, (b) identify SSSs which are recent novae, (c) determine the duty cycles of SSSs which are X-ray binaries, and to (d) discover SSSs of lower luminosity by merging multiple images. We note that Chandra observations should be conducted as soon as possible to avoid the worst effects of the degradation in low-energy sensitivity.
(2) Repeated observations at optical and UV wavelengths. These could identify novae and any other events associated with SSS behavior. They also provide the data necessary to study the stellar populations with which SSSs are associated.
(3) Correlation studies. It is difficult to establish optical IDs at distances of several Mpc, since corresponds to roughly pc, where is the distance to the galaxy, expressed in units of Mpc. Nevertheless, we can hope to establish the types of stellar populations that tend to be associated with SSSs. Preliminary studies of M101 and M83, for example, seem to indicate that the positions of SSSs are more strongly correlated with markers of young stellar populations than are the positions of recent novae, but that they are less correlated with some markers of young stellar populations than the markers among themselves (e.g., the correlation between SNR and HII regions may be stronger than the correlation between SSSs and HII regions). While these effects have yet to be quantified, they might suggest that some SSSs are members of young populations, while others are, as expected, members of older stellar populations. Furthermore, if SSSs tend to be associated with objects that have special optical properties (e.g., if SSSs are bright in UV), then it might be possible to establish some IDs. If, for example, SSSs in one galaxy are associated with UV bright regions, the probability that this is a chance occurrence can be assessed. If it is small, then it is likely that some of the associations are real. We can then compare with IDs that have been established for local SSSs, to determine if the types of objects with which SSSs in distant galaxies are associated are similar to those associated with local and better studied SSSs.
The combination of these steps taken over an interval of years will help us to understand the physical nature of the various sub-populations that comprise the class of luminous supersoft X-ray sources.
References
- (1) Di Stefano, R., Greiner, J., Murray, S., Garcia, M. 2001, ApJ, 51, L37
- (2) Di Stefano, R., Nelson, L.A. 1996, in Supersoft X-Ray Sources, Proceedings of the International Workshop Held in Garching, Germany, 28 February - 1 March 1996. Lecture Notes in Physics, Vol. 472, edited by Jochen Greiner. Springer-Verlag, Berlin Heidelberg New York, 1996., p.3
- (3) Di Stefano, R., Rappaport, S. 1994, ApJ, 437, 733
- (4) Di Stefano, R. & Kong A.K.H. 2003, ApJ, in preparation
- (5) Fabbiano, G., Kim, D.-W., Trinchieri, G 1994, ApJ, 428, 555
- (6) Faber, S.M., Wegner, G., Burstein, D., Davies, R.L., Dressler, A., Lynden-Bell, D., Terlevich, R. J. 1989, ApJS, 71, 173
- (7) Feldmeier, J.J., Ciardullo, R., Jacoby, G.H. 1997, ApJ, 479, 231
- (8) Freedman, W.L., et al. 2001, ApJ, 553, 47
- (9) Greiner, J. 2000, New Astronomy, 5, 137.
- (10) Greiner, J., Tovmassian, G.H., Di Stefano, R., Prestwich, A., Gonzalez-Riestra, R., Szentasko, L., & Chavarr a, C. 1999, A&A, 343, 183
- (11) Hachisu, I., Kato, M., & Nomoto, K. 1996, ApJ, 470, L97
- (12) Hagiwara, Y, Henkel, C, Menten, K.M., Nakai, N. 2001 ApJ, 560, L37
- (13) Ho, L.C. 2002, ApJ, 564, 120
- (14) Hughes, J.P. 1994, ApJ, 427
- (15) Karachentsev, I.D., et al. 2002, A&A, 385, 21
- (16) Kenyon, S.J. 1986, The Symbiotic Stars, Cambridge University Press
- (17) Kong, A.K.H., Garcia, M.R., Primini, F.A., & Murray, S.S. 2002, ApJ, 580, L125
- (18) Moody, J. W., Roming, P.W.A., Joner, M.D., Hintz, E.G., Geisler, D., Durrell, P.R., Scowen, P.A., Jee, R.O. 1995, AJ, 110, 2088
- (19) Mukai, K., Pence, W.D., Snowden S.L., & Kuntz, K.D. 2002, ApJ, in press (astro-ph/0209166).
- (20) Motch, C., Hasinger, G., & Pietsch, W. 1994, A&A, 284, 827
- (21) Pence, W. D., Snowden, S. L., Mukai, K., & Kuntz, K. D. 2001, ApJ, 561, 189
- (22) Rappaport, S., Di Stefano, R., Smith, J.D. 1994, ApJ, 426, 692
- (23) Sarazin, C.L., Irwin, J.A., Bregman, J.N, 2001, ApJ, 556, 533
- (24) Swartz, D.A., Ghosh, K.K., Suleimanov, V., Tennant, A.F., & Wu, K. 2002, ApJ, 574, 382
- (25) Soria, R. & Wu, K. 2002, A&A, 384,99
- (26) Soria, R. & Wu, K. 2003, A&A, submitted
- (27) Thatte, N., Tecza, M., & Genzel, R. 2000, A&A, 364, L47
- (28) Tonry, J.L., Dressler, A., Blakeslee, J.P., Ajhar, E.A., Fletcher, A.B., Luppino, G.A., Metzger, M.R., & Moore, C.B. 2001, ApJ, 546, 681
- (29) Tully, R.B. 1988, in Nearby Galaxies Catalog, Cambridge and New York, Cambridge University Press,
- (30) van den Heuvel, E.P.J., Bhattacharya, D., Nomoto, K., & Rappaport, S.A. 1992, A&A, 262, 97
- (31)