INTEGRAL
spectroscopy of three powerful radio galaxies:
Jet-cloud
interactions seen in 3-D
Abstract
Integral-field spectroscopic observations are presented for three powerful radio galaxies, namely 3C277.3 (Coma A; z=0.0857), 3C171 (z=0.2384) and 3C265 (z=0.811), which are known to be undergoing jet-cloud interactions. The morphology, kinematics and ionization of the gas in the emission-line structure of these sources are mapped and analysed. One-dimensional spectra are also extracted and integrated over the different emission-line regions in each galaxy.
In two of the galaxies (3C277.3 and 3C171) the radio sizes are of similar extent to the emission-line structure. For these, enhanced emission-line regions are found associated with the radio structures, in addition to complex kinematics and low ionization states close to the radio hotspots, indicating that jet-induced shocks disturb and ionize the gas. Interestingly, the bright — presumably shock-ionized — emission-line region coincident with the radio jet knot in 3C277.3 shows quiescent kinematics and high ionization state. Possible explanations for this puzzling result are proposed.
The images of 3C171 and 3C265 indicate that the lateral expansion of the cocoon has a significant effect on the kinematics and ionization of the gas, showing for the first time that the effects of the radio source are felt far from the jet axis.
In addition, the presence of a stellar-photoionized HII region is detected in the extended emission-line nebula of the radio galaxy 3C277.3.
keywords:
galaxies: active — galaxies: structure — galaxies: jets — galaxies: kinematics and dynamics.1 Introduction
| Source | Redshift | P178MHz | Ang. scale | Radio size | Neb. size | Radio PA | References |
|---|---|---|---|---|---|---|---|
| (W Hz-1) | (kpc/arcsec) | (kpc) | (kpc) | (deg.) | |||
| 3C277.3 | 0.0857 | 2.861026 | 2.15 | 96 | 96 | 155 | bri81,vbre85 |
| 3C171 | 0.2384 | 5.151027 | 4.76 | 55 | 67 | 100 | cla98 |
| 3C265 | 0.8110 | 7.101028 | 8.25 | 643 | 289 | 107 | fer93,sol02 |
Radio galaxies are amongst the most massive galaxies in the early Universe (e.g. ?; ?; ?; ?), and as such are unique cosmological probes of the formation and evolution of these giant ellipticals. Further, because the active galactic nuclei (AGN) of radio galaxies are obscured, the host galaxies can be studied directly.
In the currently popular hierarchical growth models, galaxies are built up through mergers of smaller sub-units (?), and such galaxy mergers have been proposed to trigger the radio source activity (e.g. ?; ?). This merger theory is supported by the fact that many powerful low-redshift radio galaxies present peculiarities in their morphology, such as tails, shells, etc. (?). The importance of mergers in triggering high-redshift radio galaxies remains unclear, however.
A remarkable feature of some powerful radio galaxies is that they possess luminous extended emission-line regions (EELR), which can extend up to 150 kpc from their nuclei, and are usually aligned along the radio axis (e.g. ?). The ionization of these EELR is thought to be due to a combination of photoionization by the central AGN and shocks induced by interactions with the radio source, with AGN-photoionization dominating near the nucleus, and jet-cloud interactions becoming more important at larger radii (e.g. ?). By investigating the properties of these EELR we can learn about the interactions between the radio source and its environment. Moreover, the properties of the intrinsic (pre-shocked) gas can provide important clues about the origin of this extended gas, and hence also about the formation and evolution of these massive galaxies and the triggering of the AGN.
The great majority of the spectroscopic studies carried out to investigate the kinematics and physical conditions of the emission-line gas in radio galaxies are based on long-slit observations, which usually concentrate on the jet-induced shocked structures along the radio axis. These studies give a very limited view of the EELR properties due to the lack of knowledge away from the radio axis. In order to learn about the origin of the extended gas and the triggering of the nuclear activity, as well as the evolution of the host galaxies, the properties of the intrinsic gas also need to be studied. Full maps of both kinematics and ionization of the extended haloes are required in order to separate the intrinsic gas properties from those resulting from the interactions with the radio source.
In this paper integral-field spectroscopic observations are presented of a pilot sample of three powerful radio galaxies at different redshifts, all of which are known to be undergoing jet-cloud interactions at some level. These are 3C277.3 (z=0.0857), 3C171 (z=0.2384) and 3C265 (z=0.811). Properties of each source are listed in Table 1. With these observations the velocity field, linewidth and ionization structures of the emission-line gas in these sources are studied in two spatial dimensions, allowing the AGN phenomenon to be further understood.
The paper is arranged as follows. In Section 2, a summary is provided of previous observations of the three sources in the sample. Section 3 contains details of the new observations, data reduction and analysis. The results are presented in Section 4 and discussed in Section 5. Conclusions are summarised in Section 6.
Throughout this paper a Hubble constant of H0 = 50 km s-1 Mpc-1 and a density parameter of = 1 are assumed. The resulting angular scales of the galaxies in the sample are given in Table 1.
2 Previous observations
| Source | texp | CCD | Grat. | Range (∗) | Pix. scale | Resolution | Airm. | Seeing |
|---|---|---|---|---|---|---|---|---|
| (s) | (Å) | (Å) | (Å) | (arcsec) | ||||
| 3C277.3 – Central | 3 1800 | Tek6 | R600B | 4596 – 7591 | 2.98 | 4.5 – 6.2 | 1.02 | 1.5 |
| 3C277.3 – Northern | 3 2000 | Tek6 | R1200B | 6324 – 7713 | 1.40 | 2.2 – 2.7 | 1.38 | 1.4 |
| 3C171 | 6 1800 | Tek6 | R600B | 4596 – 7591 | 2.98 | 4.5 – 6.2 | 1.23 | 1.5 |
| 3C265 | 3 1800 | Tek6 | R600B | 4596 – 7591 | 2.98 | 4.5 – 6.2 | 1.02 | 1.5 |
2.1 3C277.3 (Coma A)
The radio source 3C277.3, at a redshift z=0.0857, has an intermediate morphology between FRI and FRII (?) structures (see radio map in ?, reproduced in Fig. 1). The radio emission, mainly consisting of two wide, diffuse lobes, has an extent of 45 arcsec (96 kpc) along the radio axis. Whilst the northern radio lobe contains a resolved bright hot spot at its outer northern edge, the southern lobe presents two bright jet knots extending southward from the radio core.
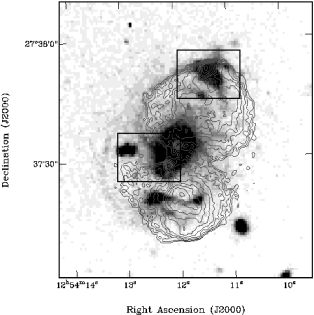
Detailed radio and optical studies of 3C277.3 by ? show evidence for an interaction between the radio source and the ambient gas. There is a strong morphological association between the emission-line gas and radio structures, and the emission-line kinematics appear to be influenced by the radio source. Moreover, the deflection and lighting up of the southern radio jet near a region of bright line emission suggests that the radio jet has collided with a massive cloud which decollimates the jet and is partially entrained in it (?). This is clearly seen in Hubble Space Telescope (HST) images of this galaxy (?; ?) which show a filamentary structure at the location of the bright knots.
Deep narrow-band H images of 3C277.3 (see Fig. 1) reveal a spectacular system of interlocking emission-line arcs and filaments, which extend almost as far perpendicular as parallel to the radio axis (?). These authors suggest that the close match between the radio and emission-line morphologies in 3C277.3 may indicate that not only do direct interactions with the radio jet ionize the gas, but also the expansion of the radio lobes into the halo plays an important role. Recently, ? have detected HI absorption against both radio lobes of 3C277.3, at large distances from the nucleus ( 30 kpc), suggesting that the radio lobes are expanding into a large gas disk. This is supported by the morphology of the ionized gas and by the good match between the velocities of the neutral hydrogen and those of the extended ionized gas, which indicates that they are two phases of the same disk-like structure of at least 60 kpc in diameter.
2.2 3C171
3C171 is a powerful radio source at a redshift z=0.2384. Its radio emission has an unusual morphology. While at high surface brightness levels the source has a normal FRII (?) structure, with an extent of 11.5 arcsec (55 kpc), at lower surface brightness levels (see Fig. 2) long plumes are seen associated with each hotspot and extending up to 20 arcsec north and south perpendicular to the radio axis (see radio maps in ? and ?).
Optical images show line emission extending along the radio axis of 3C171, with an spatial extent similar to that of the high-surface-brightness radio emission structure (?; ?). The first detailed study of 3C171 (Heckman et al. 1984) provided evidence for an interaction between the radio source and the ambient gas of the host galaxy: complex emission-line kinematics along the radio axis were revealed by the long-slit spectra, showing the highly perturbed state of the gas. These results are supported by a more recent detailed study of this source, based on high-resolution long-slit spectroscopic observations (?). These data reveal close radio-optical associations, strong line splittings and underlying broad kinematics components in the extended gas along the radio axis, a general low ionization state of the line-emitting gas, ionization minima coincident with the radio hotspots, and an anticorrelation between linewidth and ionization state in the extended gas. These all provide strong evidence that the morphology, kinematics and physical conditions of the emission-line gas in 3C171 are defined by jet-induced shocks. In addition, integral-field studies of this galaxy over a short wavelength range containing H and [OIII]5007 show emission-line ratios and kinematics which are consistent with a jet-cloud interaction scenario in the extended gas of 3C171 near the radio hotspots (?).
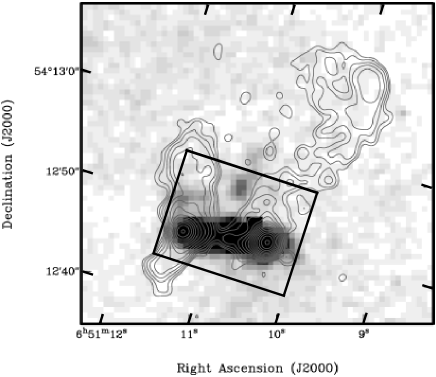
Whilst the brightest emission-line structures in 3C171 are closely aligned with the radio axis, the existence of low-surface-brightness features in the direction perpendicular to the radio axis is revealed by a deep narrow-band imaging study of 3C171 (Fig. 2; ?). These authors argue that these fainter emission-line regions lying away from the radio axis represent intrinsic structures of the gas, whose association with the extended radio structures provide evidence that they are ionized by their interaction with the radio lobes.
2.3 3C265
3C265 is a large (78 arcsec; 643 kpc) FRII (?) radio source, at a redshift z=0.811 (see radio map in ?). It has an extreme emission-line luminosity (?), which makes 3C265 ideal for the study of emission-line properties in distant radio galaxies. Its continuum structure extends over more than 10 arcsec and [OII]3727 images show emission over more than 30 arcsec (?; ?; Solórzano-Iñarrea et al. 2002). HST images reveal the bizarre optical morphology of this object, with the nucleus surrounded (in projection) by emission regions or companion galaxies (?).
Spectroscopic and polarimetric studies of 3C265 (?; ?; ?) clearly indicate that the extended gas is being illuminated by an obscured powerful quasar in the centre of the galaxy. In addition, the near-UV emission-line ratios of the extended gas in 3C265 are consistent with AGN-photoionization (?). These results are supported by recent deep narrow-band images of 3C265 (Solórzano-Iñarrea et al. 2002), shown in Fig. 3, which reveal the existence of a 60∘ half-opening angle illumination bicone near the nucleus (r60 kpc). This is predicted by the unified schemes for radio sources (?), whereby the AGN in radio galaxies is obscured by a surrounding dusty torus which defines the opening angle of the ionization cones. This result indicates that anisotropic illumination from the central AGN dominates on a small scale in 3C265. By contrast, the close alignment with the radio axis of low-ionization material at larger distances from the nucleus (r80 kpc), suggests that jet-cloud interactions may become the dominant mechanism of the emission-line gas on larger scales. Further, the presence of high-velocity gas close to the radio axis, at 20 kpc from the nucleus (?; Solórzano-Iñarrea et al. 2002), shows that the kinematic effects of jet-induced shocks are still important in the near-nuclear regions.
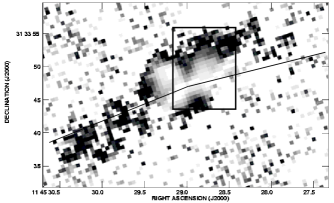
Although on a larger scale the emission-line structures in 3C265 appear to be closely aligned along the radio axis, near the nucleus the highest-surface brightness structure is elongated and aligned with the closest companion galaxy, and misaligned by approximately 35∘ relative to the radio axis, which is still consistent with the large half-opening angle of the ionization bicone. This indicates that much of the emission-line structure reflects the intrinsic distribution of the gas, and suggests that the material present along the direction of the optical/UV elongation is associated with an interaction/merger involving 3C265 and this companion (Solórzano-Iñarrea et al. 2002).
3 Observations, reduction and analysis
Integral-field spectroscopic observations were carried out on the night of 2001 January 16 for the northern region of 3C277.3, in service mode, and on the night of 2001 January 21 for 3C265, 3C171 and the ‘central’ region of 3C277.3, using the INTEGRAL spectrograph on the 4.2-m William Herschel Telescope (WHT) on La Palma (Spain). The fibre bundle SB2 was used, which has a fibre core diameter of 0.9 arcsec, and provides an effective field of view of 14.6 11.3 arcsec2. Only in the case of 3C171 could the entire emission-line nebula be covered in a single field exposure. The regions observed for each source are indicated with boxes in Figs. 1, 2 and 3. The central region observed in 3C277.3 is offset from the core so as to cover in the same exposure the eastern filament 12 arcsec east of the nucleus and the emission-line knot 6 arcsec to the south of the nucleus, in addition to the nucleus itself. Details of the observations are presented in Table 2.
3.1 Data reduction
The reduction of the multi-spectra was carried out using standard tasks and specific integral tasks within the IRAF software package and was performed in several stages, as explained in the INTEGRAL data reduction manual. After the bias subtraction, the apertures corresponding to each fibre were defined and traced, using a flat-field image. Following this, all frames were corrected for scattered light from the spectrograph and flat-fielded. The apertures in each frame were then extracted into one-dimensional spectra, one per optical fibre. Using sky flat-fields, the spectra were corrected for the fibre throughput. The different exposures of each galaxy were then combined, improving the signal-to-noise and removing the cosmic rays. After that, the wavelength calibration was performed using both sky lines and comparison lamps (CuAr and CuNe). The data were corrected for atmospheric extinction and then flux calibrated (see below) using observations of the spectrophotometric standard stars SP0804+751 and SP1036+433, which were obtained on the service night and second run night, respectively. Following the flux calibration, the galaxy data were sky-subtracted by using the sky fibres and emission-free regions of the frames.
3.1.1 Flux calibration
| Source | Line | Surf. Bright. cutoff |
|---|---|---|
| (erg cm-2 s-1 arcsec-2) | ||
| 3C277.3 – Central | OIII5007 | |
| 3C277.3 – Central | H | |
| 3C277.3 – Northern | H | |
| 3C171 | OII3727 | |
| 3C171 | H | |
| 3C171 | OIII5007 | |
| 3C265 | OII3727 |
The images of the standard stars were taken greatly out of focus in order to spread the flux of the star over several fibres, and thus allow to better estimate the flux loss between fibres. The sky-subtracted multi-spectra of each standard star were first added up to form a 1-D spectrum for each star. These were used to correct for the instrumental sensitivity at each wavelength and to obtain a rough absolute flux calibration. Given that some flux is lost between the fibres, an accurate absolute flux calibration is difficult to obtain. This effect was accounted for in the following way. Firstly, images of each (flux calibrated) star in several wavelength ranges were reconstructed (using the task imarec). The measured total flux in those wavelength ranges was then compared to the tabulated flux of each star within those ranges. The fraction of overestimated flux, due to the loss of flux between fibres, was determined for each star, and the corresponding galaxy frames of either night were then corrected. Since only one standard star was observed per night, errors in the absolute flux calibration could not be derived directly from our INTEGRAL data. To estimate the uncertainty in the flux calibration, we compared our data with the existing long-slit spectroscopic observations of the same objects. It was found that the absolute fluxes obtained from the INTEGRAL data agreed with those derived from the long-slit spectra to within 20 %. Likewise, by comparing the emission-line ratios derived from our data with those derived from existing long-slit spectra, we estimate that the relative fluxes are accurate to well within 10%.
3.2 Data analysis
3.2.1 Emission-line intensity and line-ratio maps
Intensity maps for the different emission lines were reconstructed from the reduced multi-spectra frames, by using the task imarec. The resulting images were continuum-subtracted in the following way: two images of the continuum emission in two line-free regions adjacent to the emission line on either side, were reconstructed and added together. The resulting continuum image was scaled to the emission-line image, so both images had the same wavelength bandpass. The scaled continuum image was then subtracted from the emission-line image.
All pixels with values less than approximately 5, where is the root-mean-squared variation in the source-free regions of the image, were blanked in the continuum-subtracted emission-line images. The surface brightness corresponding to the cutoff values are listed in Table 3. Line-ratio maps were then obtained by dividing the relevant emission-line intensity maps by each other. As a checking procedure, the line ratios were also derived from Gaussian fits of spectra in individual fibres.
The data have not been corrected for Galactic reddening given that none of the objects in our sample have low Galactic latitude, and thus the extinction due to dust in our Galaxy is not large [0.012 E(B-V) 0.054 mag; taken from NASA/IPAC Extragalactic Database (NED)].
3.2.2 Velocity field and linewidth maps
Velocity shifts and linewidths (FWHM) were obtained by both Fourier cross-correlation and Gaussian fitting111Although the emission-line profiles are likely to be complex in some objects (e.g. 3C171), the lines were fitted with single Gaussians because the S/N was not sufficiently high in all fibres for a multiple Gaussian fit. of the emission-line profiles (1-D spectra, one per fibre, were extracted from the reduced multi-spectra frames of the galaxies, and then analysed using the IRAF and DIPSO packages). Results from both methods were consistent with each other. The velocity shifts are referred to the velocity of the line-emitting gas at the continuum centroid of each galaxy. The measured linewidths were corrected for the spectral resolution of the instrument, which was derived by using the night-sky emission lines. The instrumental widths were measured for each fibre individually, since the spectral resolution changes over the CCD due to the variation of the spectrograph focus over the detector. The ranges of variation of the instrumental resolution are listed in Table 2. Velocity fields and linewidths were then mapped for each galaxy. The spatial distributions of these parameters were reconstructed, by using the task int-map, from ASCII files containing the values of the parameters for each fibre. Those pixels blanked in the emission-line intensity maps, because they had a S/N 5 (see above), were also blanked in the velocity and linewidth maps.
3.2.3 Comparison with previous long-slit spectroscopic studies
As a test, the results obtained from the INTEGRAL data were compared with those obtained from existing long-slit spectra of the three galaxies in the sample, in the regions of the images with the same PA as the long-slit spectra. Taking into account the different resolutions and S/N (e.g. the current data fail to detect the high-velocity cloud in 3C265 probably due to a lower S/N), the results in the overlapping region are completely consistent with previous studies. Moreover, these INTEGRAL studies provide a fuller view of the sources, and also in some cases allow the results to be interpreted in a way that is impossible with long-slit studies.
4 Results
4.1 3C277.3 (Coma A)
4.1.1 Emission-line structure
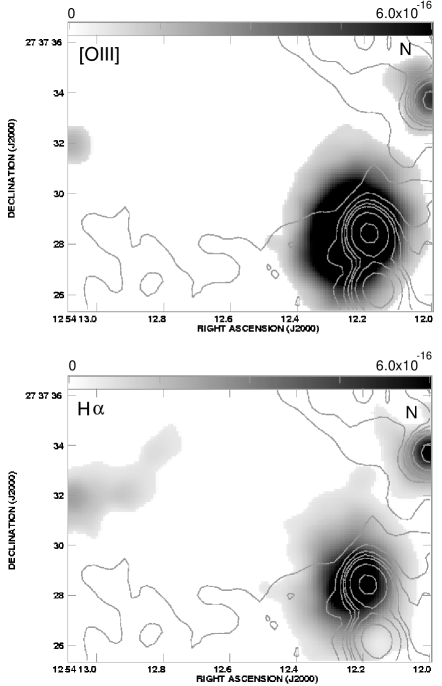
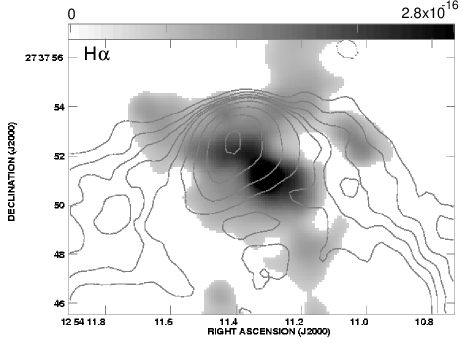
Fig. 4 presents the continuum-subtracted [OIII]5007 and H INTEGRAL images for the ‘central’ region of 3C277.3, with the contours of the 1.4 GHz radio map of ? superimposed. The radio and optical maps were aligned by assuming that the continuum centroid of the optical emission coincides with the radio core.
From Fig. 4 it can be seen that, apart from the bright region in the nucleus (N), a bright, more extended emission-line region is located at 6 arcsec (13 kpc) to the south of the nucleus and is coincident with the radio jet knot. The close spatial association between this bright region and the radio knot, together with the morphology of the radio source in the southern half (see Fig.1), suggests that the southern radio jet has been deflected by a massive ambient cloud (2106 M⊙; ?). This emission-line region is brighter in [OIII] with respect to the nucleus than in H, indicating that its ionization state is higher than that of the nucleus.
In addition to the bright regions, a fainter emission-line structure is detected at 12 arcsec (26 kpc) to the east of the nucleus. This fainter region, however, does not appear to be associated with any radio structure; it is located near the end of a low-surface brightness structure of radio emission, and it probably represents emission from the intrinsic ambient gas, which has not yet interacted with the radio source. This region appears to be better detected in H than in [OIII], suggesting that it has a low ionization state.
Unfortunately, the images of the central region of 3C277.3 (Fig. 4) are not deep enough to have detected the emission-line arc structure reported by ?, which partially lies in the region we have observed with INTEGRAL (see Fig. 1).
Fig. 5 presents the continuum-subtracted H INTEGRAL image for the northern region of 3C277.3, with the contours of the 1.4 GHz radio map of ? superimposed. The figure shows a bright H structure in the north of the galaxy ( 20 arcsec north from the nucleus), which is much more extended than those observed in the central region. This region is coincident with the northern radio hotspot and seems to be partially located along the boundaries of the radio source. This close association between the bright emission-line and radio structures suggests that the radio source is interacting with the environment at this location.
4.1.2 Emission-line kinematics
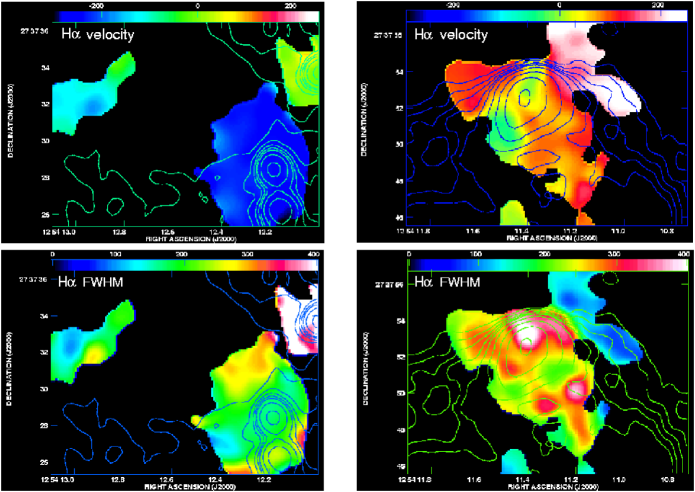
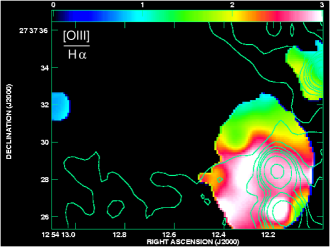
Fig. 6 presents the H velocity field and (instrumentally-corrected) linewidth colour maps for the two regions observed in 3C277.3. Contours of the radio emission at 1.4 GHz (from ?) are superimposed on the colour maps.
The velocity shifts of the emission-line structures in the central region (Fig. 6, top left) have an overall amplitude of 200 km s-1. Of particular interest is the fact that the bright region to the south of the nucleus, and coincident with the radio knot, is uniformly moving as a whole at a projected velocity of –200 km s-1 relative to the nucleus. On the other hand, the velocity of the fainter structure to the east of the nucleus varies smoothly with an average velocity of –100 km s-1 relative to the nucleus.
The northern region (Fig. 6, top right) is, on average, redshifted with respect to the nucleus, with velocities increasing up to +250 km s-1 to the north of the radio lobe. Two small regions, however, located just north and south of the hotspot, appear to be slightly blueshifted, with velocities of –10 and –50 km s-1, respectively.
The H linewidth map of the central region (Fig. 6, bottom left) shows that the nucleus presents the broadest emission lines with FWHM 400 km s-1. The fainter structure to the east of the nucleus has an average FWHM of 200 km s-1. Of particular interest is that the bright emission-line region to the south of the nucleus, which is thought to be undergoing a jet-cloud interaction (?), presents narrow lines with FWHM 200 – 300 km s-1; the larger values in this range being found in regions away from the radio jet knot.
On the other hand, the H linewidth map of the northern region (Fig. 6, bottom right) shows that the broadest emission line region (FWHM 430 km s-1), with indications of line splitting in some fibres, is coincident with the radio hotspot. This may indicate that the gas at this location is perturbed by the radio source. Moreover, it is striking how the linewidth suddenly decreases just beyond the hotspot, reaching values of FWHM 100 km s-1, suggesting that this is undisturbed gas that has not yet interacted with the radio-emitting structures.
4.1.3 Emission-line ionization state
| 3C277.3 | Nucleus | Radio jet knot | Eastern Filament | Northern Hotspot | ||||||||
|---|---|---|---|---|---|---|---|---|---|---|---|---|
| Flux abs. | Flux ratio | Flux abs. | Flux ratio | Flux abs. | Flux ratio | Flux abs. | Flux ratio | |||||
| Line | to H | to H | to H | to H | ||||||||
| H | — | — | 1.390.15 | 0.500.06 | — | — | — | — | ||||
| OIII4363 | — | — | 0.670.13 | 0.240.05 | — | — | — | — | ||||
| HeII 4686 | — | — | 0.730.10 | 0.270.04 | — | — | — | — | ||||
| H | — | 1.00 (*) | 2.760.10 | 1.000.04 | 0.350.03 | 1.000.10 | — | 1.00 (*) | ||||
| OIII4959 | 0.730.07 | 1.860.19 | 7.470.08 | 2.700.10 | 0.260.03 | 0.770.11 | — | — | ||||
| OIII5007 | 1.720.07 | 4.410.27 | 21.250.10 | 7.690.28 | 0.810.03 | 2.320.24 | — | — | ||||
| OIII6300 | 0.830.15 | 2.090.41 | — | — | — | — | 0.370.12 | 0.250.10 | ||||
| NII6548 | 0.400.03 | 1.030.12 | 1.020.15 | 0.370.06 | 0.100.05 | 0.280.12 | 0.620.15 | 0.400.14 | ||||
| H | 1.200.05 | 3.10 (*) | 8.300.15 | 3.000.12 | 1.110.05 | 3.140.33 | 4.720.12 | 3.10 (*) | ||||
| NII6583 | 1.020.05 | 2.610.17 | 2.520.18 | 0.910.07 | 0.170.05 | 0.470.13 | 1.080.13 | 0.710.20 | ||||
Fig. 7 shows the colour map of the [OIII]5007/H line ratio for the central region of 3C277.3, with the 1.4 GHz radio contours superimposed. As discussed earlier, the emission-line region coincident with the radio knot to the south of the nucleus has higher ionization than other regions of the galaxy, including the nucleus, which is in agreement with previous studies by ? and ?. Its ionization state is found to vary in the range 1.5 [OIII]/H 3.0, with the highest values corresponding to the regions closest to the radio knots. On the other hand, the faint emission-line region to the east of the nucleus presents lower ionization than the nucleus, with [OIII]/H 0.5.
Unfortunately, the ionization state of the northern region of 3C277.3 could not be studied because of the narrower spectral range observed and the low S/N of the [NII]6583 emission line.
4.1.4 Emission-line spectra
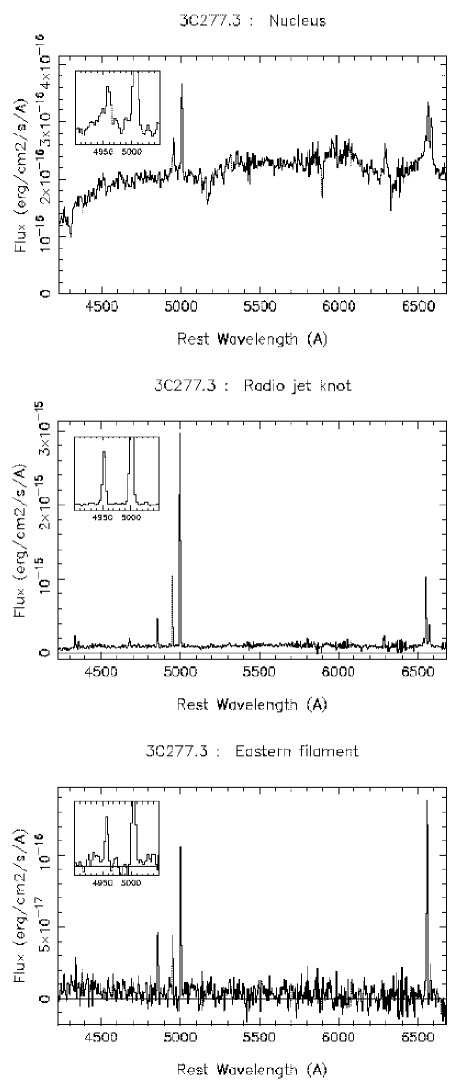
Integrated 1-D spectra for the different emission-line regions detected in the INTEGRAL images of 3C277.3 are presented in Fig. 8 and 9 (see the captions of the figures for details of the apertures).
The spectrum of the radio jet knot [Fig. 8 (middle)] clearly shows the narrow emission lines of this region, a sign of undisturbed line-emitting gas, which is surprising if a strong jet-cloud interaction is taking place in this region. Note also the strength of the [OIII]5007 line relative to the Balmer lines in this region, indicating the high ionization state of the gas, not expected if the emission-line gas was ionized by jet-induced shocks.
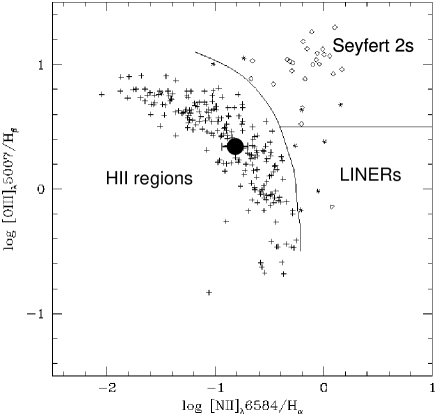
The spectrum of the eastern filament [Fig. 8 (bottom)] shows narrow emission lines and strong Balmer lines relative to the high-ionization [OIII]5007 line, indicating that this filament is probably an HII region. This can be clearly seen in Fig. 10, which shows a diagnostic diagram taken from ?, with the line ratio measurement of the eastern filament (black filled circle) superimposed. This region falls in the middle of the HII galaxies region, far away from that of the AGNs, demonstrating that there is ongoing star formation in the immediate environment of 3C277.3.
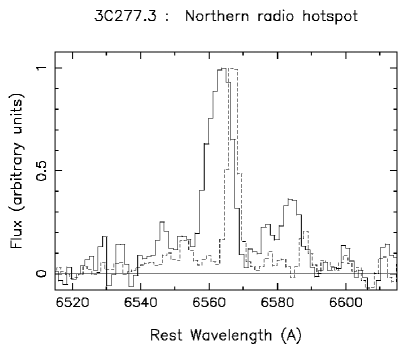
Fig. 9 shows the H and [NII] profiles for the region with the broadest lines (solid line) within the northern EELR of 3C277.3. Superimposed is the spectrum of the northernmost region (dashed line), which is located beyond the radio hotspot. It is clear from this figure that there is a marked difference in the linewidths between the two regions. This indicates that the gas lying beyond the hotspot has not been disturbed yet by the passage of the radio jet.
Table 4 lists both the absolute fluxes of the observed emission lines and the fluxes normalised to the corresponding H flux for each region in 3C277.3. For the radio knot and the eastern filament, the fluxes have not been corrected for intrinsic reddening, given that the intensities of H and H relative to H are consistent, within errors, with the expected values for Case B recombination (?), suggesting that the intrinsic reddening in these regions is not significant. For the nucleus, the H line could not be detected, and therefore no estimate for the reddening in the nucleus could be derived from our data. Thus, H/H=3.1 was assumed (?). In the case of the northern region of 3C277.3, since H was outside the wavelength range observed, again H/H=3.1 was assumed.
4.2 3C171
4.2.1 Emission-line structure
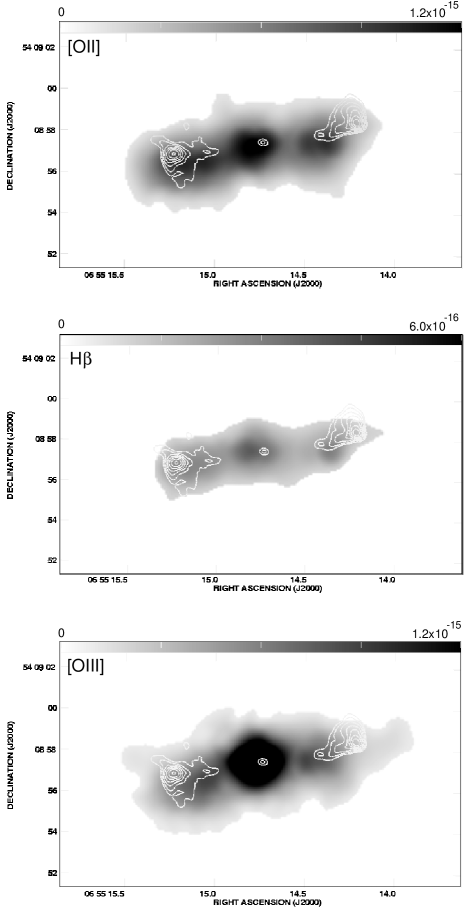
Fig. 11 presents the continuum-subtracted [OII]3727, H and [OIII]5007 emission-line INTEGRAL images for 3C171. The contours of the 8 GHz radio emission (from ?) are superimposed. To align the radio and optical maps, the radio core was assumed to be coincident with the optical continuum centroid of the galaxy.
It can be seen that the emission-line structure of 3C171 is elongated and extends about 14 arcsec (67 kpc) along the radio axis of this source. Further, the optical line emission is clearly spatially associated with the radio emission: bright regions of [OII], H and [OIII] emission are detected on either side of the nuclear region, close to the radio lobes. Note also that the radio hotspots lie outside the brightest regions on either side of the nucleus. It can also be noticed that in both eastern and western enhanced regions the [OII] and H emissions appear to be brighter relative to the nucleus than the emission in [OIII], which indicates that the ionization state of both eastern and western EELR is lower than that of the nucleus. From the images in Fig. 11 it is also apparent that the line emission centroids are significantly displaced towards the east of the radio core (and therefore the continuum centroid). This is more noticeable in the [OII] and H emission, than in [OIII].
4.2.2 Emission-line kinematics
The maps of the velocity field and (instrumentally-corrected) linewidth for the emission-line gas in 3C171 are presented in Fig. 12 (right). Contours of the 8 GHz radio emission (from ?) are superimposed.
The velocity field appears to be complex [Fig. 12 (top right)]. It shows a gradient increasing from east to west, with an overall velocity amplitude of 600 km s-1. The eastern extreme of the emission-line structure is blueshifted with a velocity shift of –200 km s-1. The relative velocity of the gas rises smoothly from there up to a location between 1.5 and 2.5 arcsec (7 - 12 kpc) west from the nucleus, where there is a sudden increase in the velocity from +200 to +500 km s-1. The velocity then decreases slightly towards the western extreme of the emission-line structure to a value of +300 km s-1.
Fig. 12 (bottom right) shows the variation of the [OIII] linewidth over the emission-line structure of 3C171. In the nuclear region the linewidths are 550 km s-1 (FWHM). Then they rise towards the east and west of the nucleus reaching values of 1000 – 1100 km s-1 (FWHM) in the regions just behind the radio lobes, suggesting that it is emission from the shocked gas cooling behind the shock front. Beyond the radio hotspots the linewidths are observed to decrease to values of 400 km s-1 (FWHM). The close spatial association between the regions with the broadest emission lines and the radio structure in 3C171 suggests that the ambient gas at these locations has been perturbed by interactions with the radio source. The regions with the broadest emission lines extend over 4 arcsec (20 kpc) in the direction perpendicular to the radio axis, indicating that their extreme kinematics are the result of the lateral expansion of the radio cocoon. The effects of the jet-cloud interaction are seen across the entire jet cocoon, not just the narrow region along the radio jet.

4.2.3 Emission-line ionization state
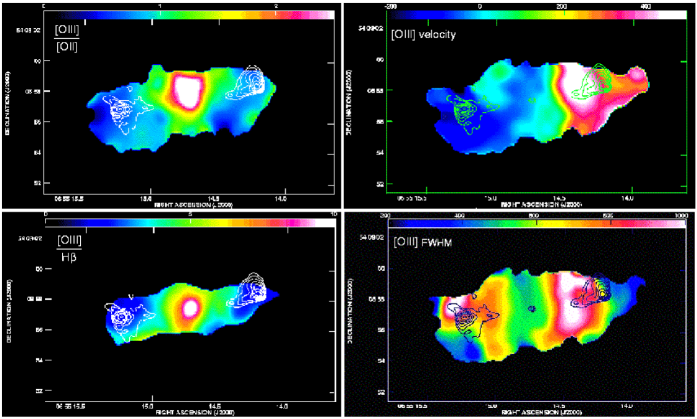
Maps of the [OIII]/[OII] and [OIII]/H line ratios for 3C171 are shown in Fig. 12 (left). These images clearly show that the nuclear region has the highest ionization state ([OIII]/[OII] 3 and [OIII]/H 10). As the radius increases, the ionization state of the gas is observed to decrease reaching minimum values of [OIII]/[OII] 0.4 – 0.7 and [OIII]/H 2 at the location of the radio hotspots. It is noticeable, from the [OIII]/[OII] map (top left), that beyond the western radio hotspot the ionization state of the gas seems to start increasing again towards the extreme of the emission-line structure. This, however, is not observed so clearly beyond the eastern radio lobe.
4.2.4 Emission-line spectra
Integrated 1-D spectra for the nuclear region, the western and eastern EELR of 3C171 are presented in Fig. 13 (see the caption of the figure for details of the apertures). The relative intensities of the [OII] and [OIII] lines in the three emission-line regions, clearly demonstrate the lower ionization state of the eastern and western EELR relative to the nucleus.
Both the absolute fluxes of the observed emission lines and the normalised fluxes to the corresponding H flux for each region in 3C171 are listed in Table 5. Given that the observed H/H and H/H line ratios are consistent (within errors) with the theoretical Case B recombination (?), no corrections for intrinsic reddening have been made to the line fluxes.
4.3 3C265
4.3.1 Emission-line structure
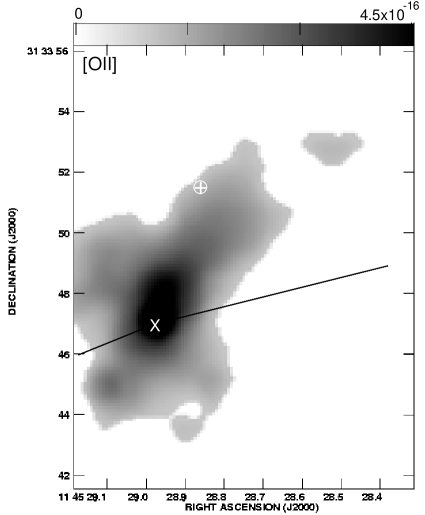
Fig. 14 shows the continuum-subtracted [OII]3727 emission-line INTEGRAL image for 3C265. By contrast to 3C277.3 and 3C171, the radio emission in 3C265 is much more extended than the emission-line structures (see radio map in ?), and so in the figures only the radio axis is indicated (black solid line).
This image shows that, in contrast to 3C171 and other high-redshift radio galaxies, the emission-line structure of 3C265 within 10 arcsec (48 kpc) of the nucleus does not align along the radio axis222Note, however, that the emission-line structure of 3C265 at radii 10 arcsec (82 kpc) is observed to be closely aligned along the radio axis on the eastern side of the nucleus (e.g. Solórzano-Iñarrea et al. 2002; cf. Fig 3).. It is in fact elongated and misaligned by 35∘ with respect to the radio axis, which is still consistent with the large (60∘) half opening angle of the ionization bicone detected in deep narrow-band images of this source (see Fig. 3; Solórzano-Iñarrea et al. 2002).
4.3.2 Emission-line kinematics
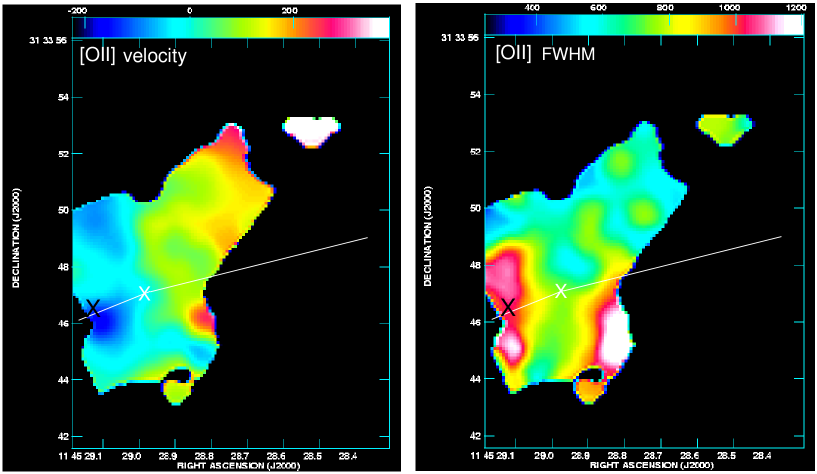
The velocity field and (instrumentally-corrected) linewidth maps for 3C265 are presented in Fig. 15. The white solid line indicates the radio axis.
The velocity of the emission-line gas (left) appears to follow a smooth gradient, with the exception of a region located in the south-western extreme of the emission-line structure at 2 arcsec from the nucleus. The gas in this region presents a sharp change in the velocity of approximately 300 km s-1 (from –50 to +250 km s-1) along a projected distance of only 2 arcsec (16.5 kpc).
Apart from this region, the rest of the emission-line gas presents an ordered velocity profile with an overall amplitude of 600 km s-1, which is consistent with gravitational motions in the galaxy (?; ?). The gas at the south-eastern extreme of the emission-line structure is on average blueshifted with a velocity of –150 km s-1, and the north-western blob is redshifted with a velocity of +400 km s-1.
The variation of the [OII] linewidths over the emission-line structure of 3C265 is shown in Fig. 15 (right). The linewidths are in the range 600 – 700 km s-1 (FWHM) over most of the nebula, with the exception of two regions where significant increases in the widths of the lines are observed.
The region located about 2 arcsec (16.5 kpc) east from the nucleus, and extending over 4.5 arcsec (37 kpc) in the north-south direction, presents linewidths in the range 950 – 1150 km s-1 (FWHM). This region is situated on the passage of the eastern radio jet, which suggests that the broadening of the emission lines in this region might be caused by jet-cloud interactions. It should be noted that at this location, 2.5 arcsec east from the nucleus of 3C265, a strong line splitting ( 1000 km s-1) has been detected in the [OIII] emission line (?; Solórzano-Iñarrea et al. 2002), the most likely origin of which is jet-induced shocks. Note, however, that this broad-line region has a much larger extent in the north-south direction that the high-velocity knot.
The region situated about 2 arcsec to the south-west of the nucleus, extends approximately over 3.5 arcsec in the north-south direction, and presents linewidths in the range 950 – 1350 km s-1 (FWHM). This region, however, is offset from the passage of the western radio jet.
4.3.3 Emission-line spectra
| 3C171 | Eastern EELR | Nucleus | Western EELR | ||||||
|---|---|---|---|---|---|---|---|---|---|
| Flux abs. | Flux ratio | Flux abs. | Flux ratio | Flux abs. | Flux ratio | ||||
| Line | to H | to H | to H | ||||||
| OII3727 | 8.230.17 | 3.990.20 | 8.710.13 | 3.720.18 | 7.280.08 | 3.990.22 | |||
| NeIII3869 | 0.710.12 | 0.340.06 | 1.290.10 | 0.550.05 | 0.940.08 | 0.520.05 | |||
| H8+He I3886 | 0.260.10 | 0.130.05 | 0.210.08 | 0.090.04 | 0.360.07 | 0.200.04 | |||
| NeIII3967 | 0.630.13 | 0.310.06 | 0.610.10 | 0.260.04 | 0.630.08 | 0.350.05 | |||
| H | 0.410.07 | 0.200.04 | 0.530.07 | 0.230.03 | 0.450.07 | 0.240.04 | |||
| H | 1.070.13 | 0.520.06 | 1.170.07 | 0.500.04 | 1.010.07 | 0.550.05 | |||
| OIII4363 | 0.380.10 | 0.190.05 | 0.670.08 | 0.290.04 | 0.180.07 | 0.100.03 | |||
| HeII 4686 | — | — | 0.360.10 | 0.140.04 | 0.360.11 | 0.200.06 | |||
| H | 2.060.10 | 1.000.05 | 2.340.10 | 1.000.04 | 1.820.10 | 1.000.05 | |||
| OIII4959 | 1.980.10 | 0.940.07 | 5.000.08 | 2.130.10 | 2.240.08 | 1.230.08 | |||
| OIII5007 | 5.810.13 | 2.810.15 | 14.450.10 | 6.170.28 | 6.630.10 | 3.630.20 | |||
| NI5199 | 0.240.08 | 0.130.04 | 0.330.10 | 0.140.04 | 0.310.08 | 0.170.05 | |||
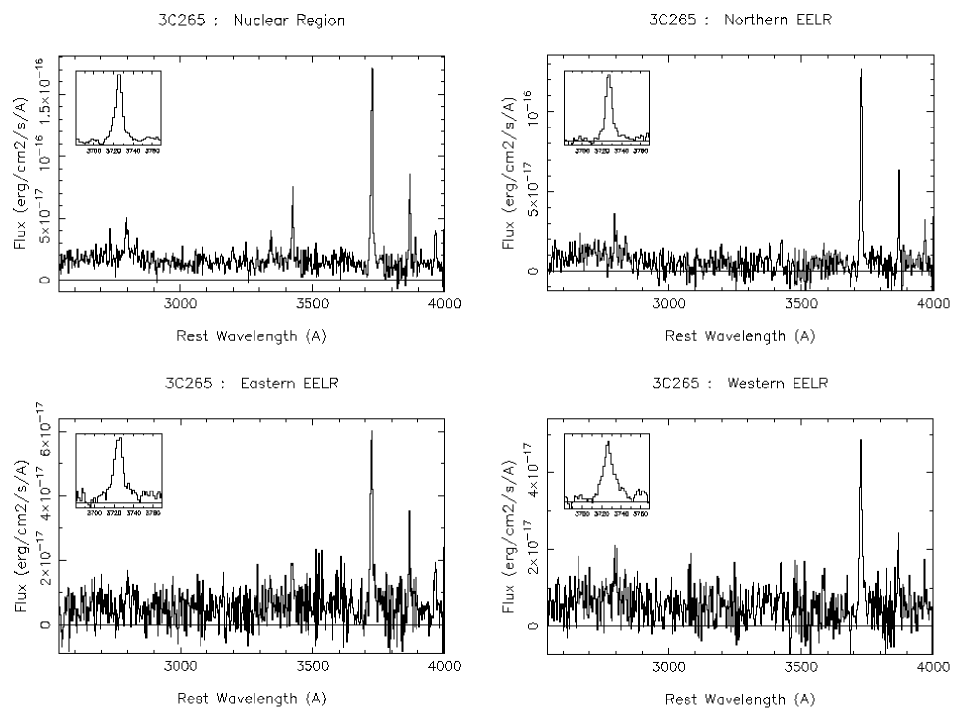
Fig. 16 presents the integrated 1-D spectra for different emission-line regions in 3C265: nucleus (top left), northern EELR (top right), eastern EELR (bottom left) and western EELR (bottom right). The details of the apertures are given in the caption of the figure.
Both the absolute fluxes of the observed emission lines and the fluxes normalised to the corresponding [OII]3727 (since H was not covered in the observed spectral range) are listed for each region in Table 6.
5 Discussion
5.1 Jet-cloud interactions and the role of the radio jet cocoon
As discussed in the introduction, the three galaxies studied here were previously known to be undergoing jet-cloud interactions at some level. Evidence for this has been mainly obtained from long-slit spectroscopic studies. The new INTEGRAL observations allow an investigation of how the jet-cloud interactions evolve when moving away from the radio axis, and also a study of any changes in the dominant mechanism of the emission-line gas over the entire nebula of the galaxies.
Amongst the three galaxies studied in this paper, 3C171 shows most clearly that the properties of the emission-line gas in this galaxy are defined by interactions between the radio source and the ambient gas. Several results provide evidence for this.
Firstly, the enhanced brightness of the line emission along the radio axis observed in the [OII], H and [OIII] intensity maps (Fig. 11) indicates that either jet-induced shocks are acting as an effective local ionization source, or that as the gas is swept up and compressed by the passage of the jet, the shocks increase the efficiency with which the central AGN photoionizes the ambient gas (see also ?).
Secondly, regions with a sudden increase in the linewidth are observed close to the location of the hotspots (Fig. 12, bottom right), extending in the direction perpendicular to the radio axis, up to the edge of the observed emission-line structure. This rise in the FWHM reflects the existence of multiple kinematic components, including line splittings and underlying broad components. The nature of the different components in the kinematic structure of the emission-line gas along the radio axis in 3C171 has been studied in detail by ?. Such extreme kinematics, which cannot be explained by gravitational motions, indicate that the gas has been highly perturbed, and must be the result of acceleration induced by the passage of the jet through the ambient gas. Now the INTEGRAL results show that these complex kinematics also extend perpendicular to the radio axis, indicating that the effects of the radio jets are also felt far from the radio axis.
Thirdly, the regions with the lowest ionization state are coincident with the location of the radio lobes (Fig. 12, left). This can be explained either by local shock-ionization333Shock-ionization models predict lower ionization states than the photoionization predictions., or by a shock-induced increase of the local density followed by AGN-photoionization444Note that the ionization state of photoionized gas is inversely proportional to the density of the gas.. Detailed examination of the emission-line ratios along the radio axis of 3C171 by ? shows, however, that AGN-photoionization models fail to explain certain features measured in the EELR of 3C171, such as the low HeII/H ratios and the high [OIII] electron temperatures, both of which can be accounted for in the shock-ionization predictions (e.g. ?, 1996).
In conclusion, these INTEGRAL images provide further strong evidence that the EELR properties in 3C171 are to a large extent defined by interactions with the radio jet. In addition, these images show for the first time that the regions with the broadest emission lines and the lowest ionization state are found not only near the radio axis, but also extending in the direction perpendicular to this. This indicates that the lateral expansion of the radio source cocoon has a significant effect on the kinematics and ionization of the ambient gas.
Considering now the results obtained for 3C277.3, a few similarities can be drawn between the observed emission-line properties of 3C277.3 and those of 3C171. In the first place, regions of enhanced emission-line luminosity are observed coincident with the northern radio hotspot (Fig.5) and with the radio jet knot to the south of the nucleus (Fig.4), suggesting that they are the result of strong interactions between the radio source and the ambient gas. Moreover, the observed increase in the widths of the emission lines in the region of the northern hotspot, together with the sudden decrease of the linewidths observed just beyond the radio hotspot (Fig.6, bottom right), is further clear evidence that the emission-line gas at this location is being disturbed by interactions with the radio structure.
On the other hand, the region coincident with the radio jet knot, which is clearly undergoing a jet-cloud interaction, does not present any disturbed emission-line kinematics. This is not expected if the enhanced line emission in this region is the result of a strong collision between the radio jet and a massive cloud that causes the radio jet to be deflected (?). This puzzling result will be discussed in Section 5.2.
Both 3C171 and 3C277.3 have radio source sizes of comparable physical extents to their emission-line structures, and thus it is not surprising that the radio structure is interacting with the host galaxy in both cases. By contrast, the radio size of 3C265 is much larger than the emission-line nebula, and yet this source still presents signs of strong jet-cloud interactions in the emission-line kinematics (see also ?) 555Note that 3C265 is not the only large radio source in which kinematic evidence for jet-cloud interactions has been found (?).. On the other hand, the emission-line gas of 3C265 is known to be mainly photoionized by the central AGN. Moreover, the ionization structure within 10 arcsec of the nucleus appears to be dominated by the predicted illumination cones (see Fig. 3).
The INTEGRAL images of 3C265 reveal two kinematically disturbed regions, with very broad (FWHM 950 — 1300 km s-1) emission lines, at about 2 arcsec east and west of the nucleus (Fig. 15, right). These regions have a large lateral extent ( 30 — 38 kpc), showing a similar effect to that observed in 3C171. Thus, 3C265 is another case in which the lateral expansion of the radio cocoon around the jet may have an important effect on the kinematics of the emission-line gas. Alternatively, the disturbed kinematics of these two regions in 3C265 could also be the result of strong outflows driven by the central AGN in the ionization cones. If this is the case, the broadening of the lines would be a consequence of seeing both the near and far sides of the cone simultaneously. A sign for this could be the sharp velocity change observed in the western broad-line region, where we observe blueshifted gas moving at approximately –50 km s-1 and redshifted gas at +250 km s-1 both with respect to the nucleus (Fig. 15, left). It should be noted that evidence for AGN-induced outflows has been previously found at low redshifts for another powerful radio galaxy: Cygnus A (?). Moreover, deep narrow-band images of 3C265 (Solórzano-Iñarrea et al. 2002) show the emission-line structure with an apparent “hollowing out” of the cones, which is entirely consistent with outflows driven by the AGN.
| 3C265 | Eastern EELR | Nuclear Region | Western EELR | Northern EELR | ||||||||
|---|---|---|---|---|---|---|---|---|---|---|---|---|
| Flux abs. | Flux ratio | Flux abs. | Flux ratio | Flux abs. | Flux ratio | Flux abs. | Flux ratio | |||||
| Line | to OII | to OII | to OII | to OII | ||||||||
| HeII 2733 | — | — | 1.720.38 | 0.060.02 | — | — | — | — | ||||
| MgII 2798 | 1.930.45 | 0.170.04 | 8.100.84 | 0.290.04 | 2.540.51 | 0.270.06 | 3.740.59 | 0.210.03 | ||||
| OIII2837 | — | — | 1.950.61 | 0.070.02 | 0.870.31 | 0.090.03 | 1.560.46 | 0.090.02 | ||||
| NeV3346 | 1.220.41 | 0.110.04 | 3.020.46 | 0.120.02 | 0.660.30 | 0.070.03 | 1.190.43 | 0.070.02 | ||||
| NeV3426 | 2.490.51 | 0.220.05 | 7.670.54 | 0.280.03 | 1.270.31 | 0.130.03 | 1.930.45 | 0.110.02 | ||||
| OII3727 | 11.370.79 | 1.000.07 | 27.591.98 | 1.000.07 | 9.500.73 | 1.000.08 | 18.150.76 | 1.000.04 | ||||
| NeIII3869 | 3.780.64 | 0.330.06 | 9.390.64 | 0.340.03 | 1.800.41 | 0.190.05 | 6.570.63 | 0.360.04 | ||||
| H8+He I3886 | — | — | 1.770.53 | 0.060.02 | — | — | 9.940.43 | 0.050.02 | ||||
| NeIII3967 | 2.010.56 | 0.180.05 | 3.910.56 | 0.140.02 | 1.300.38 | 0.140.04 | 3.220.54 | 0.180.03 | ||||
In summary, although it is difficult to generalize from observations of three objects at very different redshifts, some common properties which show evidence for interactions between the ambient gas and the radio source are found in the EELR of all three sources, such as enhanced emission-line luminosities and disturbed kinematics associated with the radio structures. Perhaps one of the most interesting results obtained from these INTEGRAL images is the fact that the lateral expansion of the radio cocoon plays an important role in the properties of the emission-line gas, at least for 3C171 and 3C265. In addition, the images of 3C265 also show that AGN-induced outflows might have a significant effect in the kinematics of the ambient gas in this galaxy.
5.2 The nature of the emission-line gas in the radio jet knot of 3C277.3
As discussed earlier, despite the strong morphological evidence for a jet-cloud interaction taking place in the emission-line region of the radio jet knot in 3C277.3, surprisingly no kinematic signs of such an interaction are detected in the emission-line gas: no steep gradients in the velocity field are observed — the whole region is uniformly moving at a projected velocity of approximately –200 km s-1 with respect to the nucleus (Fig. 6, top left) — and most of the region presents narrow emission lines (Fig. 8, middle).
We first consider whether the central AGN is energetically capable of producing the observed emission-line luminosity in the region of the radio jet knot.
For a typical 3C radio source at a similar redshift of 3C277.3 (z 0.08), the central ionizing photon production rate is phot s-1 (?). The number of ionizing photons intercepted by the emission-line knot will depend on the fraction of sky that it covers. Assuming that it has spherical symmetry as seen from the nucleus, we estimate that the solid angle subtended by this region from the nucleus is 0.9 sr. Thus, the number of ionizing photons per unit time intercepted by the emission-line knot is 7.11051 phot s-1. The H luminosity L(H) that the knot would emit due to the central AGN ionization can be estimated by using the following formula (?):
| (1) |
where is the Planck’s constant, is the H frequency, is the electron density, is the volume of the emitting region, is the volume filling factor and is the effective recombination coefficient. Taking into account that the number of ionizing photons intercepted by the region is , where is the total recombination coefficient, and assuming Case B recombination (?), we obtain that the H luminosity due to the AGN666Any additional blazar beam is unlikely to affect the ionization of the region significantly, given that the opening angle subtended by this region from the nucleus is 60∘. would be L(H)AGN3.41039 erg s-1. Using the relation H/H=3.1 of Case B, we find that the luminosity of H emitted by the knot due to the central AGN would be L(H)AGN1.11040 erg s-1.
The H luminosity actually emitted by the knot, based on the observed H flux (see Table 4), is L(H)obs 2.71041 erg s-1, which exceeds by more than an order of magnitude the expected H luminosity due to the AGN. Therefore, an extra source of ionization is needed to produce the observed H luminosity in the region of the radio jet knot.
Jet-induced shocks are likely to be this ionizing source. To consider whether this local mechanism is energetically viable, we first calculate the total kinetic power of the jet using the following formula given in ?:
| (2) |
where is the total lobe energy, an efficiency and the age of the radio source. The total energy of the lobes is derived from the minimum energy density condition, as discussed in Section 3.1 of ?, which depends on the redshift of the source, its dimensions and the flux density at a given frequency. For 3C277.3 we derive a minimum energy density of 6.110-12 erg cm-3, and so a total energy for the lobes 6.31058 erg.
To estimate the age of the radio source, we assume hotspot advance velocities in the range — (e.g. ?). Thus, for constant expansion speed, and taking into account that the lobes expand in two directions, the dynamical age of the radio source will be in the range 1.6104 years kpc-1 — 1.6105 years kpc-1.
The radio axis of 3C277.3 may not be parallel to the plane of the sky, and the real size of the radio source would then be , where is the radio size projected on the plane of the sky, and is the angle between the radio axis and the plane of the sky. However, since the uncertainty in the hotspot advance speed is greater than that in , we assume for these calculations . For the adopted cosmology, = 96 kpc (see Table 1), thus the age of 3C277.3 is in the range 1.5106 yr 1.5107 yr.
Substituting in formula (2), assuming =0.5 (?), we obtain a total kinetic power for the jet in the range 2.71044 erg s 2.71045 erg s-1. Comparing the jet power with the total emission-line luminosity observed in the region of the radio jet knot, which is of the order 5.41042 erg s-1 777Assuming Case B recombination (?), the total emission-line luminosity is approximately 20L(H)., it can be seen that efficiencies of the order of 10-2 are sufficient to produce the observed emission-line luminosity. Thus, it is entirely possible that jet-induced shocks provide the energy needed to produce the observed line luminosity in the radio jet knot region.
If line emission in the radio jet knot is indeed induced by shocks driven by interactions between the radio jet and the ambient gas, how can the quiescent kinematics of this presumably shocked region be explained? One possibility is that the shocked gas is not observable as line emission, and what is detected is the precursor gas which lies around the shocked structures and which is photoionized by the UV photons emitted by the shocked gas behind the shock front. The precursor region is also characterized by a high ionization state (?), being therefore consistent with the observations (see Section 4.1.3). But why is the shocked gas not observable?
(a) We first consider that the shocked material may not have had enough time to cool down, therefore line radiation from the shocked gas would not yet have been emitted.
In order to estimate the cooling time () behind a strong shock we use the following formula, which has been derived from that given in Section 2.3 of ?:
| (3) |
where is the velocity of the shock through the clouds (in units of km s-1) and is the density of the gas ahead of the shock (in units of cm-3). Assuming that what is observed is the precursor unshocked gas, the measured densities of the gas in this region give = 170 — 300 cm-3 (?; ?, respectively). Thus, for shock velocities through the clouds = 200 — 500 km s-1, we obtain cooling times in the range 30 — 770 years, which is much less than the time the clouds had to cool down (106 years) 888Note that if the region is a multi-phase molecular cloud complex, the densities could be much lower in some parts of the region interacting with the jet, in which case the cooling times would be much longer, and the low density gas may not yet have cooled..
Consequently, the shocked gas in the region of the knot has had enough time to cool down since the initial passage of the shock front, and thus it should be detectable in emission lines. Therefore, the lack of disturbed kinematics in the knot cannot be explained in this way, unless this cloud has only just wandered into the jet, or it is being continuously shock-heated by the passage of the jet.
(b) Another possibility is that the shocked clouds are destroyed before they cool down and emit line radiation.
Calculations by Klein et al. (1994) show that the destruction time of a shocked cloud is several cloud crushing times, where the cloud crushing time is the characteristic time for the shock to cross through the cloud and is defined by
| (4) |
where is the ratio of the density of the cloud to that of the intercloud medium , is the initial cloud radius, and is the velocity of the shock in the intercloud medium. Assuming that the clouds are in pressure equilibrium with the hot ambient gas, then . Thus the cloud crushing time can be expressed in terms of the shock velocity through the clouds:
| (5) |
Then, for the clouds to be destroyed before they cool down, we require . Combining formulas (3) and (5), the following constraint on the initial radius of the cloud is obtained:
| (6) |
where and are in units of km s-1 and cm-3, respectively. For initial cloud densities of the order 170 — 300 cm-3 and shock velocities through the clouds in the range = 200 — 500 km s-1, we obtain that the initial radii of the clouds need to be 0.4 pc so as to be destroyed before they cool down.
Alternatively, if indeed the shocked gas is being seen, one explanation would be that the clouds were uniformly accelerated by the jet interactions. This could explain the constant velocity shifts and the narrow linewidths of this region. However, it would be very surprising if this were the case for this jet-cloud interaction when usually the resulting kinematics from such interactions are highly disturbed and complex.
Another possibility is that large linewidths are not observed in the region due to a geometrical effect; if the shocked gas is moving parallel to the plane of the sky, then it cannot not be detected spectroscopically. However, we consider this possibility extremely unlikely because if the ambient gas is being highly disturbed by the passage of the jet, it is difficult to believe that the resulting motions are exclusively parallel to the plane of the sky, since entrainment of the gas in the hot post-shock wind and turbulence resulting from the interactions with the jet would be expected to be three-dimensional.
We conclude that the emission-line region coincident with the radio jet knot in 3C277.3 does not show highly disturbed kinematics because the shocked gas in the region may have not yet cooled down and it is not observable as line emission, either because the ambient clouds are destroyed before they cool (if pc), or more likely because the shocked gas is continuously heated by the passage of the jet. In this case the line emission from the knot is dominated by the shock-photoionized precursor emission from the region surrounding the expanding shock front.
5.3 Origin of the gas
A fundamental question regarding the formation and evolution of radio galaxies which still remains unclear concerns the origin of the extended gas in these sources.
As has been previously suggested, the angular momentum of the emission-line nebula associated with radio galaxies may reflect the origin of the gas in these systems. Previous studies of powerful low-redshift radio galaxies report a tendency for the gas rotation axis to align with the radio axis (?; ?; ?; ?). Interestingly, for the galaxies in the current sample, if their underlying velocity field is due to rotation, it seems that the rotation axis of the gas and the radio axis tend to be misaligned by more than 60∘ [see Figs. 6 (top), 12 (top right) and 15 (left)].
In the case of 3C265, it is of particular interest that the nearest companion galaxy (Fig. 14), aligns along the direction of the UV/optical emission elongation of 3C265, which is close to the proposed plane of rotation of the gas. It has been suggested that the gas and dust present along this direction is associated with an interaction between 3C265 and its companion (Solórzano-Iñarrea et al. 2002). It thus seems that the plane of rotation of the emission-line gas would correspond to a gas stream which reflects a merger or accretion event, at least for 3C265.
If this interpretation of the velocity fields as gas rotation is correct, then this would suggest that 3C277.3, 3C171 and 3C265 are fundamentally different to many other sources, and this may then be related to why they show such strong jet-cloud interactions. For example, if the radio axis happens to align close to the merger direction, strong jet-cloud interactions are likely to arise.
Nevertheless, it must not be forgotten that other mechanisms may dominate the velocity fields of these sources. Certainly large kinematic changes are seen in the regions of the radio hotspots, and it may be that the rest of the velocity field of these sources is also dominated by outflows induced by the radio source. Clearly, more observations are required to analyse in detail the velocity fields in jet-cloud interaction sources.
6 Conclusions
We present the results obtained from integral-field spectroscopic observations of three powerful radio galaxies (3C277.3, 3C171 and 3C265), all of which were previously known to be undergoing jet-cloud interactions to some extent. We map and analyse the morphology, kinematics and ionization of the emission-line gas in the haloes of these galaxies.
We find that the emission-line regions which are close to the radio hotspots show disturbed kinematics and low ionization states, as expected if jet-cloud interactions are taking place in such locations. By contrast, the region coincident with the radio jet knot in 3C277.3, which is believed to be undergoing a strong jet-cloud interaction, presents quiescent kinematics and high-ionization states. We discuss several possibilities to explain this result.
We show for the first time that the effects of the radio source can extend far from the radio jet axis. Our images of 3C171 and 3C265 indicate that the lateral expansion of the cocoon has a significant effect in the kinematics and ionization of the emission-line gas.
We detect the presence of a stellar-photoionized HII region in the extended emission-line nebula of 3C277.3.
In addition, if the underlying velocity fields of the gas are due to rotation, we find that the gas rotation axis and the radio axis tend to be misaligned. This disagrees with previous studies of nearby radio galaxies, and suggests that the galaxies of our sample may be fundamentally different to many other sources.
Acknowledgments
This work is based on observations made at the Observatorio del Roque de los Muchachos, La Palma, Spain. This research has made use of the NASA/IPAC Extragalactic Database (NED) which is operated by the Jet Propulsion Laboratory, California Institute of Technology, under contract with the National Aeronautics and Space Administration. CSI acknowledges support from PPARC. We thank Raffaella Morganti and Martin Hardcastle for providing the radio maps of 3C277.3 and 3C171, respectively. CSI thanks Begoña García-Lorenzo from the ING for her help with the INTEGRAL reduction package. CSI particularly thanks Philip Best for a careful reading of the manuscript, many constructive discussions and encouragement. We thank the anonymous referee for useful comments and suggestions which helped to improve this article.
References
- Barthel 1989 Barthel P. D., 1989, ApJ, 336, 606
- Baum, Heckman & van Breugel 1990 Baum S. A., Heckman T., van Breugel W., 1990, ApJS, 74, 389
- Baum, Heckman & van Breugel 1992 Baum S. A., Heckman T. M., van Breugel W., 1992, ApJ, 389, 208
- Baum et al. 1988 Baum S. A., Heckman T. M., Bridle A., van Breugel W. J. M., Miley G. K., 1988, ApJS, 68, 643
- Best, Longair & Röttgering 1998 Best P. N., Longair M. S., Röttgering H. J. A., 1998, MNRAS, 295, 549
- Best, Röttgering & Longair 2000 Best P. N., Röttgering H. J. A., Longair M. S., 2000, MNRAS, 311, 23
- Blundell 1996 Blundell K. M., 1996, MNRAS, 283, 538
- Bridle et al. 1981 Bridle A. H., Fomalont E. B., Palimaka J. J., Willis A. G., 1981, ApJ, 248, 499
- Capetti et al. 2000 Capetti A., de Ruiter H. R., Fanti R., Morganti R., Parma P., Ulrich M.-H., 2000, A&A, 362, 871
- Clark et al. 1998 Clark N. E., Axon D. J., Tadhunter C. N., Robinson A., O’Brien P., 1998, ApJ, 494, 546
- Clark 1996 Clark N. E., 1996, PhD thesis, University of Sheffield
- Dessauges-Zavadsky et al. 2000 Dessauges-Zavadsky M., Pindao M., Maeder A., Kunth D., 2000, A&A, 355, 89
- Dey & Spinrad 1996 Dey A., Spinrad H., 1996, ApJ, 459, 133
- di Serego Alighieri et al. 1996 di Serego Alighieri S., Cimatti A., Fosbury R. A. E., Perez-Fournon I., 1996, MNRAS, 279, L57
- Dopita & Sutherland 1995 Dopita M. A., Sutherland R. S., 1995, ApJ, 455, 468
- Dopita & Sutherland 1996 Dopita M. A., Sutherland R. S., 1996, ApJS, 102, 161
- Fanaroff & Riley 1974 Fanaroff B. L., Riley J. M., 1974, MNRAS, 167, 31P
- Fernini et al. 1993 Fernini I., Burns J. O., Bridle A. H., Perley R. A., 1993, AJ, 105, 1690
- Filippenko & Terlevich 1992 Filippenko A. V., Terlevich R., 1992, ApJL, 397, L79
- Hardcastle et al. 1997 Hardcastle M. J., Alexander P., Pooley G. G., Riley J. M., 1997, MNRAS, 288, 859
- Heckman et al. 1985 Heckman T. M., Illingworth G. D., Miley G. K., van Breugel W. J. M., 1985, ApJ, 299, 41
- Heckman et al. 1986 Heckman T. M., Smith E. P., Baum S. A., van Breugel W. J. M., Miley G. K., Illingworth G. D., Bothun G. D., Balick B., 1986, ApJ, 311, 526
- Heckman, van Breugel & Miley 1984 Heckman T. M., van Breugel W. J. M., Miley G. K., 1984, ApJ, 286, 509
- Ivison et al. 1998 Ivison R. J. et al., 1998, ApJ, 494, 211
- Jannuzi & Elston 1991 Jannuzi B. T., Elston R., 1991, ApJL, 366, L69
- Klein, McKee & Colella 1994 Klein R. I., McKee C. F., Colella P., 1994, ApJ, 420, 213
- Kotanyi & Ekers 1979 Kotanyi C. G., Ekers R. D., 1979, A&A, 73, L1
- Longair, Best & Rottgering 1995 Longair M. S., Best P. N., Rottgering H. J. A., 1995, MNRAS, 275, L47
- Márquez et al. 2000 Márquez I., Pécontal E., Durret F., Petitjean P., 2000, A&A, 361, 5
- Martel et al. 1999 Martel A. . et al., 1999, ApJS, 122, 81
- McCarthy et al. 1987 McCarthy P. J., van Breugel W., Spinrad H., Djorgovski S., 1987, ApJL, 321, L29
- McCarthy, Spinrad & van Breugel 1995 McCarthy P. J., Spinrad H., van Breugel W., 1995, ApJS, 99, 27
- McCarthy 1988 McCarthy P. J., 1988, PhD thesis, University of California
- McLure & Dunlop 2000 McLure R. J., Dunlop J. S., 2000, MNRAS, 317, 249
- Miley et al. 1981 Miley G. K., Heckman T. M., Butcher H. R., van Breugel W. J. M., 1981, ApJL, 247, L5
- Miley 1980 Miley G., 1980, Ann. Rev. Ast. & Astr., 18, 165
- Morganti et al. 2002 Morganti R., Oosterloo T. A., Tinti S., Tadhunter C. N., Wills K. A., van Moorsel G., 2002, A&A, in press, (astro-ph/0203204)
- Osterbrock 1989 Osterbrock D. E., 1989, Astrophysics of gaseous nebulae and active galactic nuclei. Research supported by the University of California, John Simon Guggenheim Memorial Foundation, University of Minnesota, et al. Mill Valley, CA, University Science Books
- Rawlings & Saunders 1991 Rawlings S., Saunders R., 1991, Nature, 349, 138
- Rigler et al. 1992 Rigler M. A., Stockton A., Lilly S. J., Hammer F., Le Fevre O., 1992, ApJ, 385, 61
- Scheuer 1995 Scheuer P. A. G., 1995, MNRAS, 277, 331
- Simkin 1979 Simkin S. M., 1979, ApJ, 234, 56
- Simpson & Rawlings 2002 Simpson C., Rawlings S., 2002, MNRAS, 334, 511
- Solórzano-Iñarrea, Tadhunter & Axon 2001 Solórzano-Iñarrea C., Tadhunter C. N., Axon D. J., 2001, MNRAS, 323, 965
- Solórzano-Iñarrea, Tadhunter & Bland-Hawthorn 2002 Solórzano-Iñarrea C., Tadhunter C. N., Bland-Hawthorn J., 2002, MNRAS, 331, 673
- Spinrad et al. 1985 Spinrad H., Marr J., Aguilar L., Djorgovski S., 1985, PASP, 97, 932
- Tadhunter, Fosbury & Quinn 1989 Tadhunter C. N., Fosbury R. A. E., Quinn P. J., 1989, MNRAS, 240, 225
- Tadhunter et al. 1999 Tadhunter C. N., Packham C., Axon D. J., Jackson N. J., Hough J. H., Robinson A., Young S., Sparks W., 1999, ApJL, 512, L91
- Tadhunter et al. 2000 Tadhunter C. N., Villar-Martín M., Morganti R., Bland-Hawthorn J., Axon D., 2000, MNRAS, 314, 849
- Tadhunter 1991 Tadhunter C. N., 1991, MNRAS, 251, 46P
- van Breugel et al. 1985 van Breugel W., Filippenko A. V., Heckman T., Miley G., 1985, ApJ, 293, 83
- van Breugel et al. 1998 van Breugel W. J. M., Stanford S. A., Spinrad H., Stern D., Graham J. R., 1998, ApJ, 502, 614
- Veilleux & Osterbrock 1987 Veilleux S., Osterbrock D. E., 1987, ApJS, 63, 295
- White & Frenk 1991 White S. D. M., Frenk C. S., 1991, ApJ, 379, 52