Three-dimensional calculations of high and low-mass planets embedded in protoplanetary discs
Abstract
We analyse the non-linear, three-dimensional response of a gaseous, viscous protoplanetary disc to the presence of a planet of mass ranging from one Earth mass (1 M⊕) to one Jupiter mass (1 MJ) by using the ZEUS hydrodynamics code. We determine the gas flow pattern, and the accretion and migration rates of the planet. The planet is assumed to be in a fixed circular orbit about the central star. It is also assumed to be able to accrete gas without expansion on the scale of its Roche radius. Only planets with masses MJ produce significant perturbations in the disc’s surface density. The flow within the Roche lobe of the planet is fully three-dimensional. Gas streams generally enter the Roche lobe close to the disc midplane, but produce much weaker shocks than the streams in two-dimensional models. The streams supply material to a circumplanetary disc that rotates in the same sense as the planet’s orbit. Much of the mass supply to the circumplanetary disc comes from non-coplanar flow. The accretion rate peaks with a planet mass of approximately 0.1 MJ and is highly efficient, occurring at the local viscous rate. The migration timescales for planets of mass less than 0.1 MJ, based on torques from disc material outside the planets’ Roche lobes, are in excellent agreement with the linear theory of Type I (non-gap) migration for three-dimensional discs. The transition from Type I to Type II (gap) migration is smooth, with changes in migration times of about a factor of 2. Starting with a core which can undergo runaway growth, a planet can gain up to a few MJ with little migration. Planets with final masses of order 10 MJ would undergo large migration, which makes formation and survival difficult.
keywords:
accretion, accretion discs – hydrodynamics – planets and satellites: formation – planetary systems: formation – planetary systems: protoplanetary discs.1 Introduction
Young planets interact with the surrounding discs from which they form by accreting mass and exerting torques. In the core-accretion model for planet formation, the initial growth proceeds as solids accumulate to form a planetary core (Lissauer 1995, Wuchterl, Guillot & Lissauer 2000). The core may become a terrestrial planet or may further develop to become a gas giant through accretion of gas. The torques resulting from planet-disc interactions cause a planet to migrate typically inwards (Lin et al. 2000; Ward and Hahn 2000).
Numerical hydrodynamical calculations have been carried out in two dimensions in order to understand better the dynamics of a circular orbit planet embedded in a gaseous disc (e.g. Bryden et al. 1999; Kley 1999; Lubow, Seibert & Artymowicz 1999; Nelson et al. 2000). These studies concentrated on the interaction between a 1 MJ planet and a gas disc that orbit a 1 M⊙ star. The tidal forces caused by the planet create a gap in the disc. In spite of the presence of the gap, disc mass flow on to the planet continues through the gap with high efficiency. Nearly all the flow through the gap is accreted by the planet at a rate comparable to the rate at which mass accretion would occur in the disc in the absence of a planet.
The flow within the Roche lobe of the planet is highly non-axisymmetric and involves shocks produced by colliding gas streams (Lubow et al. 1999; D’Angelo, Henning & Kley 2002). Torques on the planet are exerted by circumstellar disc material that lies outside the gap. In addition, torques are exerted locally by the material that flows close to the planet. The net torque results in inward migration. Gas accretion can continue to planet masses of order 10 MJ, at which point tidal forces are sufficiently strong to prevent flow into the gap.
These earlier studies were limited by their neglect of effects in the vertical direction (perpendicular to the orbit plane). The Roche lobe radius of a 1 MJ planet orbiting a 1 M⊙ star is comparable to the local disc thickness. The effects in the vertical direction are even more important for lower-mass planets. In addition, sufficiently low-mass planets do not open a gap in the disc. Analytic models of planet migration in the non-gap case, sometimes called Type I migration, were carried out in two dimensions (Ward 1997). The results implied that planetary migration timescales are much shorter than the disc lifetimes. Planets would then be accreted by the central star. Alternatively, the planets could reside at the circumstellar disc inner edge, if there is a central hole in the disc. This situation poses problems for planet survival and for gas giant planet formation. Recent two and three dimensional analytic calculations by Tanaka, Takeuchi, and Ward (2002) of the migration rates of low-mass planets obtained smaller values (by about an order of magnitude), making survival more plausible.
The two-dimensional numerical results also indicated that accretion within the Roche lobe of a 1 MJ planet is driven by shocks (Lubow et al. 1999; D’Angelo et al. 2002). It is not clear whether the same flow pattern would persist in three dimensions. Recently, Kley, D’Angelo, and Henning (2001) computed the three-dimensional flow for 0.5 and 1 MJ planets and found minor differences in the accretion and migration rates compared to the two-dimensional case. However, the flow within the Roche lobe was unresolved.
In this paper, we analyze the non-linear interactions between a planet and a gaseous disc by using global three-dimensional numerical simulations that resolve the flow within the Roche lobe of a 1 MJ planet. We are interested in determining the flow patterns, the accretion rates, and migration rates for planets whose masses range between 1 M⊕ (Earth mass) and 1 MJ (Jupiter mass). Each planet is assumed to be in a circular orbit about the central star. The mass and orbital radius of each planet are fixed during the simulation; consequently, the results do not include the effects on the flow of planetary migration.
The outline of the paper is as follows. Section 2 describes the computational procedure. Section 3 provides the results. In Section 4, we discuss the implications of the results for giant planet formation. Section 5 contains our conclusions.
2 Computational method
2.1 Basic equations
We use a computational method that is similar to that of Lubow et al. [1999], except that they performed two-dimensional vertically averaged calculations whereas we solve the problem in three dimensions.
We assume a viscous model for the disc turbulence, with the usual prescription. The origin of the coordinate system is taken to be the centre of the star. (We ignore the slight centre-of-mass shift caused by the planet.) The disc self-gravity is ignored. The flow is modelled in the orbital frame that rotates with the angular speed of the planet , where is the mass of the star, is the orbital radius of the planet, is the gravitational constant, and we have neglected the mass of the planet. In this frame, the flow achieves a near steady state. We adopt spherical coordinates with associated flow velocities in the rotating frame . The equations of motion for the disc are
| (1) |
| (2) | |||||
| (3) | |||||
and
| (4) |
where is the gas density, is the gas pressure, is the radial momentum per unit volume, is the meridional momentum per unit volume, is the azimuthal angular momentum per unit volume, is the gravitational potential due to the central star and the planet, and is the viscous force per unit volume that describes the effects of disc turbulence. We use an unsoftened gravitational potential
| (5) |
where is the planet mass. This is possible because the location of the planet is such that all gravitational force evaluations are made at a finite distance from the planet. We also performed some test calculations with gravity softened on the length scale of twice the grid resolution near the planet, but found no significant difference between the softened and unsoftened results.
Equations (1), (2), (3), and (4) express conservation of mass, radial momentum, meridional momentum, and azimuthal angular momentum, respectively. Equation (4) is written in terms of the total azimuthal angular momentum , rather than that in the rotating frame. The reason is that the equation provides better numerical stability [1998].
The equation of state is taken to be locally isothermal, , with the temperature expressed as a specified function of radius, . This equation of state is appropriate for a gas that radiates internal energy gained by shocks with high efficiency. The viscosity force is assumed to be the standard Navier-Stokes force (see eq. [15.3] of Landau & Lifshitz 1975; Klahr, Henning & Kley 1999). The coefficient of shear viscoity represents the effects of disc turbulence, while the bulk viscosity coefficient is set to zero. The value for the kinematic turbulent viscosity is assumed to be constant in space and time. It can be expressed in terms of the usual prescription of Shakura & Sunyaev [1973]. Namely, for a disc with local isothermal sound speed and vertical scaleheight , dimensionless parameter is defined through
| (6) |
The above equations are non-dimensionalized so that the unit of time is the inverse of the planetary orbital frequency , the unit of distance is the orbital radius of the planet , and .
2.2 Numerical method
The equations are solved using a three-dimensional spherical coordinate version of the ZEUS-2D code [1992]. The code was written by K. A. Miller and J. M. Stone. It was modified to include a standard three-dimensional Navier-Stokes viscous force term. The code allows for variably-spaced gridding, which permits us to obtain higher resolution in the vicinity of the planet. The timesteps satisfy the usual Courant condition, for which we have adopted Courant number 0.3. The code provides an artificial viscosity term, but since we introduce a Navier-Stokes viscous force, we suppress this artificial viscosity. Of course, there is some intrinsic numerical viscosity because of the finite gridding. For a uniformly spaced mesh, the code is formally second-order accurate in space and first-order accurate in time. For variably spaced meshes, it is formally first-order accurate in space. However, a high level of accuracy and resolution can be attained by limiting the fractional change in mesh spacing between adjacent cells to be small, of order 1%. The code uses van Leer interpolation.
2.3 Numerical grid and initial conditions
The planet was fixed at location . We modelled the disc in the region , , and . We imposed reflective boundary conditions at the radial and grid boundaries and periodic boundary conditions at the azimuthal boundary. The radial boundaries were sufficiently far from the planet that the reflected waves were not noticeable. The grid was uniform in , but non-uniform in and . Both the and grids were uniform in the vicinity of the planet, but the grid spacing increased logarithmically away from this uniform region (i.e. each zone was a certain percentage larger or smaller than the zone preceding it). In addition, the last two zones inside and were uniform to allow periodic boundaries to be implemented easily. Each region of the radial grid had , , zones. The grid had , , zones in each region. The grid modelled 4 scale heights above the disc midplane using 36 zones. Thus, the zones in the vicinity of the planet had dimensions of 0.002875 in and , and twice this value in . This grid was decided upon after extensive testing using two and three-dimensional calculations. In particular, we found that if the change in size between two neighbouring zones is too large or if the and dimensions of zones are too different, numerical instabilities occur. The instabilities are worst in two-dimensional calculations, but also appear in three-dimensional calculations that have the same gridding in and . We also performed two-dimensional calculations with increasing resolution in and to test for convergence. Lowering the resolution in either or tends to increase the accretion rates. Convergence testing of three-dimensional calculations was not practical due to the factor of 16 increase in computational time that would have been required to double the above resolution in all three directions. The above resolution was chosen as the minimum required both to avoid numerical instabilities and to give quasi-steady-state accretion rates that had converged to within a few percent in the two-dimensional calculations.
The Roche lobe of the planet had a radius
| (7) |
We modelled planets from 1 Earth mass ( M⊙) to 1 Jupiter mass ( M⊙). With the mass of the star equal to 1 M⊙, the planets’ Roche radii ranged from to 0.069. Thus, the Roche radius of the Jupiter-mass planet was resolved by 24 zones (i.e. the Roche lobe contains about zones), while that of the Earth-mass planet was marginally resolved by 3.5 zones (i.e. the Roche lobe contains about zones).
The planet was assumed to be able to accrete material without substantial expansion of its radius on the scale of its Roche lobe. Some models of planet evolution suggest that this assumption is valid only for planets of mass greater than about 50 M⊕ (Pollack et al 1996). However, these models are subject to number of major simplifying assumptions, as discussed in Wuchterl et al. (2000). We return to this point in Section 4. In any case, the accretion assumption provides a simple prescription for handling the accretion flow that allows us to compute torques on the planet due to its interaction with the disc.
To simulate the accretion on to the planet, we nearly fully removed material in the four grid zones that surrounded the location of the planet in each timestep. A residual density was retained in these zones to avoid numerical divergences. The removed material was assumed to be accreted on to the planet, although the mass of the planet was not increased. There was a pressure force directed toward the planet at the edge of the evacuated region. This force was small compared with other dynamical forces for massive planets, but was noticable for the lowest mass planets that we modelled (see Section 3.2).
A temperature profile was used at all times. It was normalised such that . This profile gives a constant value of throughout the unperturbed disc. It is numerically convenient when using a spherical grid, since the vertical resolution of the disc is constant. We set the kinematic disc viscosity to in our dimensionless units, which corresponds to at (equation 6).
The underlying initial disc density profile was chosen to be axisymmetric and follow . Thus, the disc surface density . For planets with masses MJ, we imposed an initial gap near the planet. The initial gap size and structure were estimated by an approximate torque balance condition between viscous and tidal torques near the planet. For the Jupiter-mass planet, the density at the middle of the gap was 1% of the unperturbed density. For the 0.3 MJ and 0.1 MJ planets the initial gap densities were 4.2% and 35% of the unperturbed density, respectively.
In order to confirm that the presence of an initial gap did not affect the final results, we performed two calculations of the 0.1 MJ planet, one with an initial gap and one without. The accretion and migration rates of the calculation with the initial gap reached steady values after about 30 orbits. The calculation without an initial gap initially had much higher accretion and migration rates, but these converged to the values given by the other calculation after approximately 100 orbits. Thus, the presence of an initial gap for the high-mass planets does not affect the final results, but it significantly reduced the computational time.

3 Results
3.1 Calculations
We performed calculations of 6 planets with masses of 1, 0.3, 0.1, 0.03, 0.01, and 0.003 Jupiter masses, MJ (i.e. 330, 100, 33, 10, 3.3, and 1 Earth masses, M⊕). The results are scaled so that the planet is at a distance of 5.2 AU from a 1 M⊙ star. The disc mass, , between 1.56 and 20.8 AU (the boundaries of the grid) is taken to be 7.5 Jupiter masses (i.e. 0.0075 M⊙). This gives an unperturbed disc surface density of 75 g cm-2 at the radius of the planet.
The calculations were run until the accretion rate on to the planet reached a quasi-steady state (Figure 1). The number of orbits required depended on the mass of the planet. Lower-mass planets reached a steady state after only about 5 orbits, while the 1 MJ planet required approximately 100 orbits. The calculations never quite reach a true steady state because the protoplanetary disc is evolving due to the Navier-Stokes viscosity. Thus, the accretion rates of some of the high-mass planets can be seen to decrease slightly with time after the quasi-steady-state accretion is reached.
The calculations were performed on the United Kingdom Astrophysical Fluids Facility (UKAFF), a 128-processor SGI Origin 3800 computer, and on GRAND, a 24-processor SGI Origin 2000 computer. The computational time required for each calculation was relatively independent of the planet’s mass and required approximately 160 CPU hours per orbit on UKAFF. The total CPU time required for all the calculations was approximately 50000 CPU hours.
3.2 Density structure and gas flow
The interaction of the planet with the disc alters the density and flow of the gas in the vicinity of the planet. This interaction was analysed by means of two-dimensional simulations for high-mass planets by Lubow et al. [1999]. Recently, D’Angelo et al. [2002] studied the gas flow near low-mass planets by using two-dimensional simulations. Here, we study the problem in three dimensions for both high and low-mass planets.

3.2.1 Global features
Figure 2 plots the azimuthally averaged surface density as a function of radius for the planets with masses ranging from 1 to 0.01 MJ. Also plotted (with the thick solid line) is the two-dimensional result for a 1 MJ planet after 150 orbits from Figure 1 of Lubow et al. (1999). The surface density in the vicinity a 1 MJ planet is well modelled by two-dimensional calculations (see also Kley et al. 2001). Only planets with masses MJ produce significant perturbations in the disc’s surface density; MJ (10 M⊕) is insufficient. This result is consistent with the expectation that a gap will start to open when the Roche radius of the planet is comparable to the disc scaleheight . The Roche radii of planets with masses 0.3, 0.1, and 0.03 MJ are and 0.022, respectively. Comparing these to , we find that is required for a significant surface density perturbation. Even for (the 0.3 MJ case), the gap only drops to 15% of the unperturbed density.
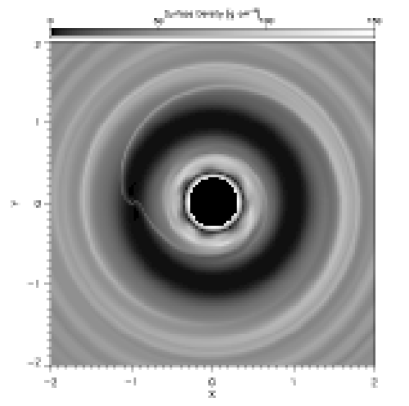
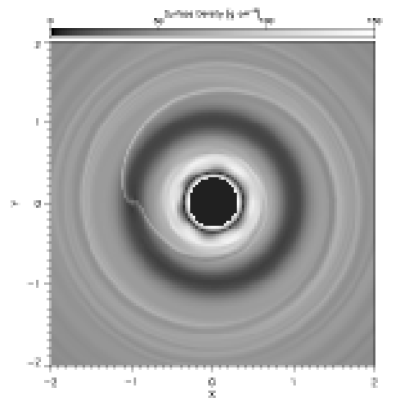
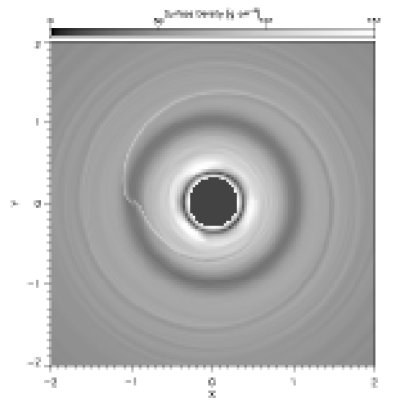
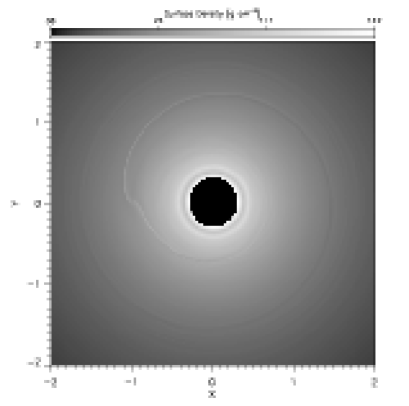
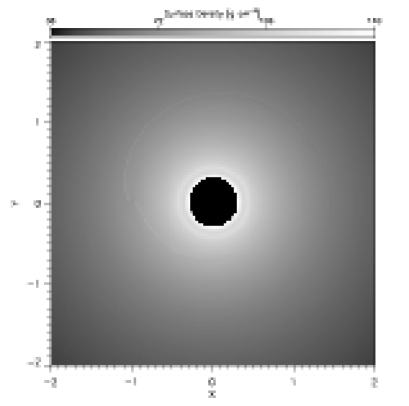
In Figure 3, we plot the global surface density of the disc at the end of the simulations for each of the 6 planets. The (partial) clearing of gaps by the planets is clearly visible in the global surface density plots for planets with masses MJ. Spiral density waves launched by the planet propagate inwards and outwards from the planet’s radius into the disc. For masses MJ, these density waves are strong enough to appear even in the azimuthally averaged surface density profiles (Figure 2). The strength of the surface density perturbations decreases with lower mass planets, but their form is essentially independent of the planet’s mass. For the lowest-mass planet, the spiral density perturbations are too small to be visible over the underlying density gradient in the disc. These waves are essentially two-dimensional in nature and have been studied in the past using two and three-dimensional nonlinear calculations (e.g. Artymowicz 1992; Kley 1999; Bryden et al. 1999; Lubow et al. 1999; Nelson et al. 2000; Kley et al. 2001) as well as analytically and through linearized numerical calculations (Ogilvie & Lubow 2002).


3.2.2 The flow in the vicinity of the planet
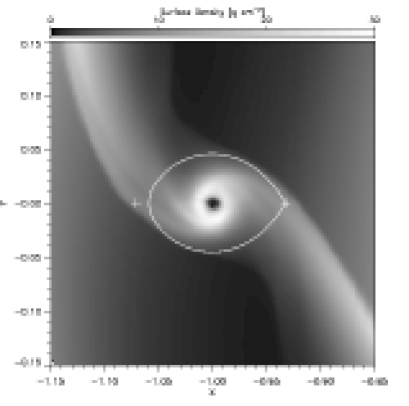
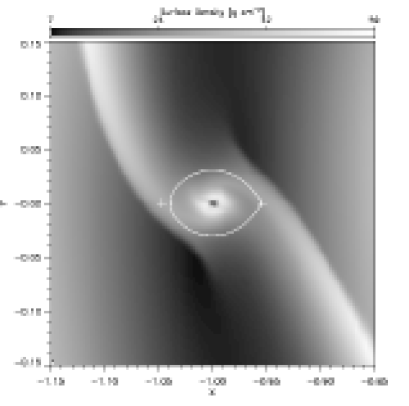
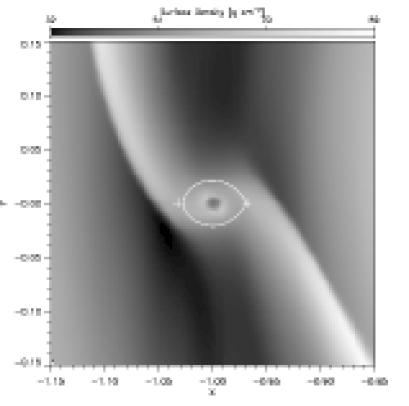
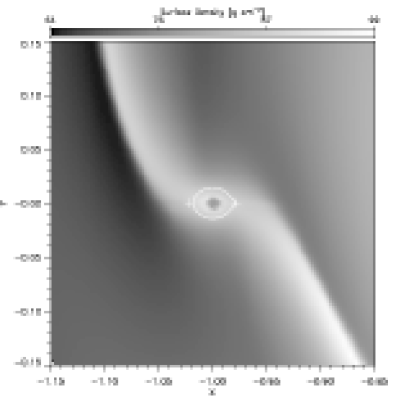
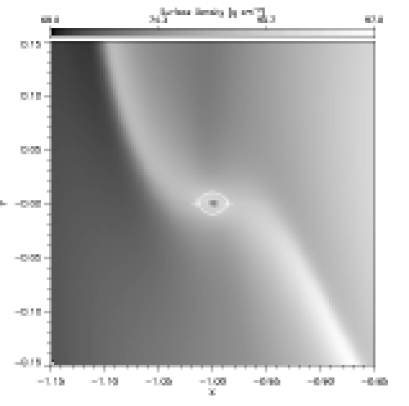
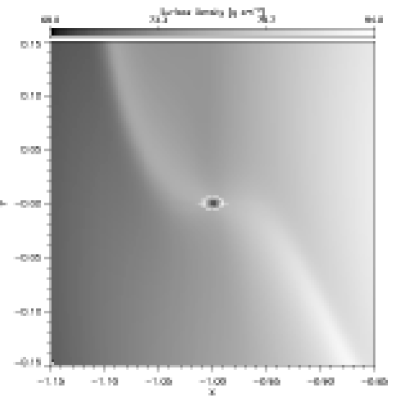
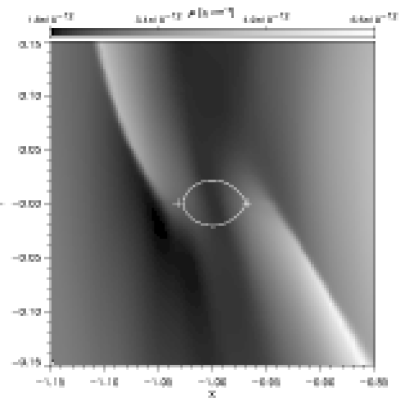
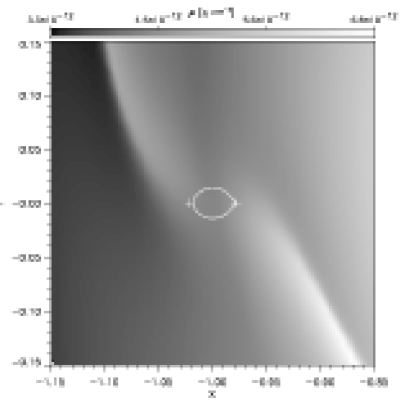
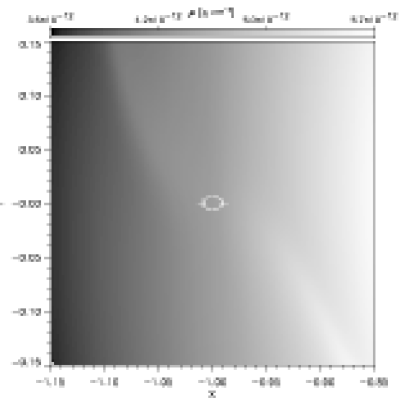
In Figure 4, we plot the surface density in the vicinity of the planet. Overlaid on the plots are the Roche lobes of the planets and their inner (L1) and outer (L2) Lagrangian points (crosses). In Figure 5, we plot the density of the disc (greyscale) and streamlines on the disc midplane in the vicinity of the planet. From these figures, we see that the waves are present in the circumstellar discs, as was found in the previous two-dimensional simulations. They are initiated near the planet and propagate as shocks. Even with the 1 M⊕ planet, the density jump across the shock is of order 10%, and the more massive planets have greater density jumps. The discontinuities in the streamlines across the shocks are obvious for planets with masses M⊕.
The shape of the shocks is independent of the planet’s mass so long as a deep gap is unable to form (i.e. for planets with masses MJ). For the higher-mass planets, the shocks become more curved, the outer shock moves forward, and the inner shock moves back. Unlike the 1 MJ case, the shocks generated by the low-mass planets do not extend radially all the way to the planet’s Roche lobe. Instead, their radial extent is determined by the disc thickness. The shocks reach no closer to the planet than a distance of approximately (i.e. they begin at approximately at ). This fact will be important when we come to consider the torque exerted on the planet by the disc. Although the disturbances are non-linear, their form is similar to the surface density perturbations expected from linear resonance theory (see Figure 6 of Tanaka et al. 2002).
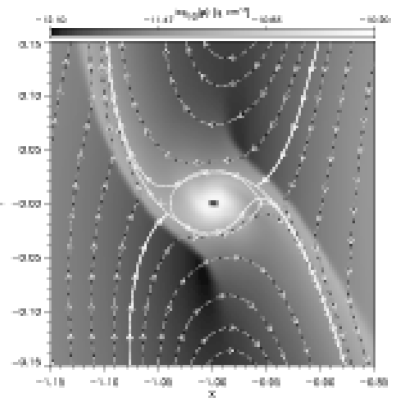
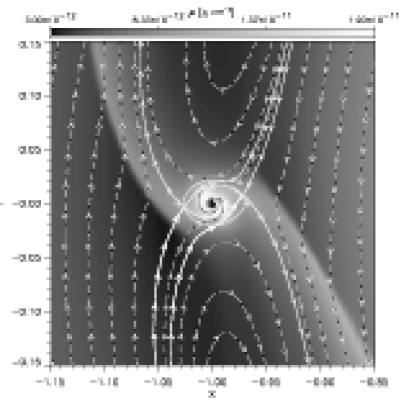
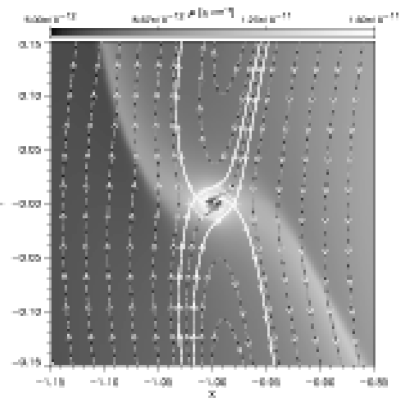
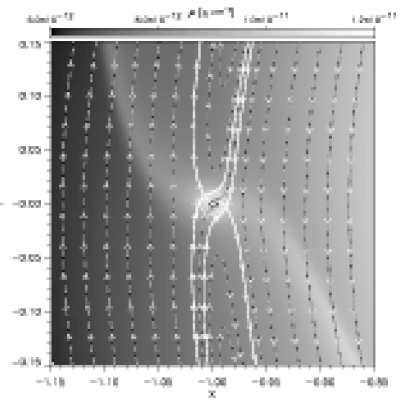
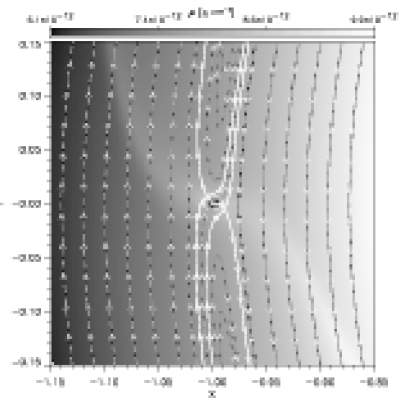
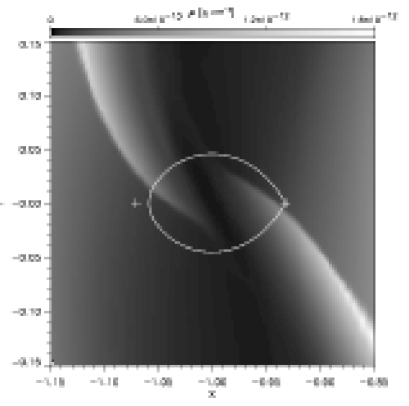
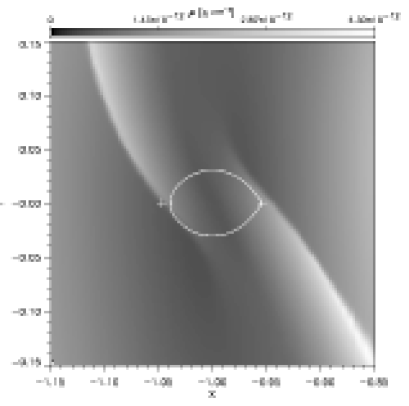
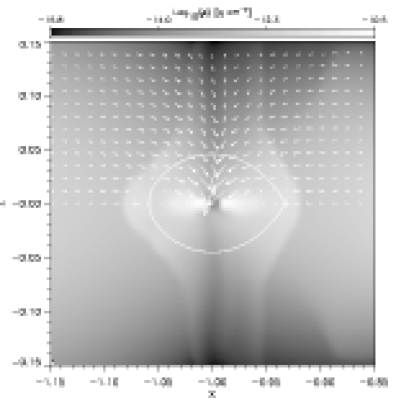
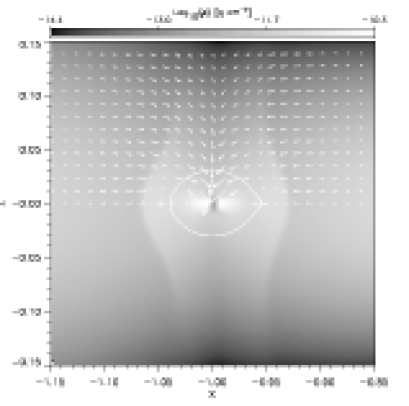
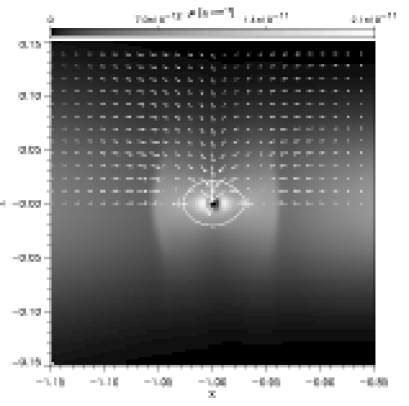
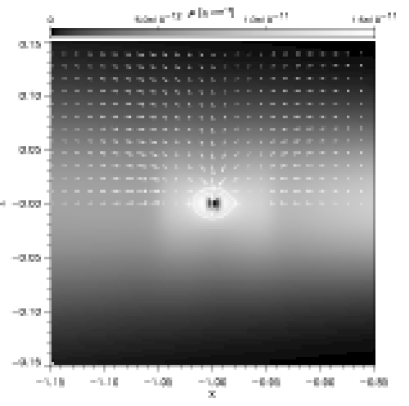
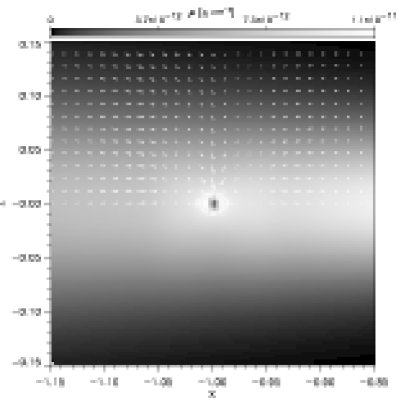
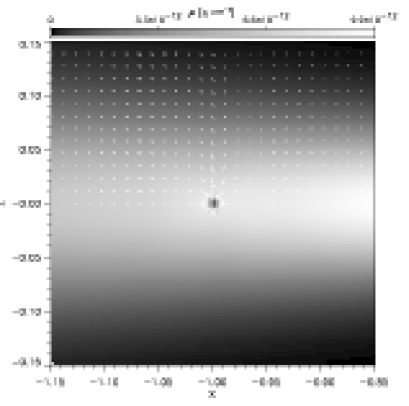
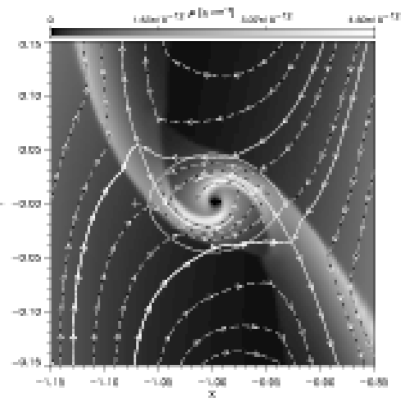
Figure 6 provides the density of the gas in the vicinity of the planet, but at height above the midplane. Figure 7 gives the density and velocity vectors in an slice through the disc at the location of the planet (i.e. ). The results are plotted by using a Cartesian coordinate system , such that the the planet is located at and disc midplane is defined by .
Notice that we have not plotted streamlines in these figures. It is difficult to plot a set of three-dimensional streamlines because they cross each other in projection on to a graph. Streamlines can be plotted at the disc midplane where the vertical velocity is zero (by symmetry). The velocity vectors in Figure 7 cannot be connected to form streamlines because information about the velocity in the deprojected direction () is required. Consequently, one cannot conclude that material rapidly drops to the midplane near . Instead, material off the midplane flows past a low-mass planet in the direction.
These figures allow us to determine the structure of the shocks outside the Roche lobe of the planet. Comparing the locations of the shocks in similar panels between Figures 5 and 6, we find that the locations are similar for the low-mass planets but, for 1 and 0.3 MJ, the shock fronts on the midplane lead the shock fronts off the midplane. Thus, a section perpendicular to the shock front for the high-mass planets would have a ‘bowshock’ shape, whereas for the low-mass planets the shocks are essentially vertical planes. These shock shapes can be seen clearly in Figure 7 with the transition from nearly vertical (0.1 MJ) to bowshock-shaped (1 MJ). The discontinuity in the velocity vectors across these shocks is also clear in Figure 7.
Returning to the density structure and streamlines at the midplane (Figure 5), we see that gas at the same radius as the planet but outside the planet’s Roche lobe moves on horseshoe orbits, as was reported in earlier studies (e.g., Bryden et al. 1999; Kley 1999; Lubow et al. 1999). For the high-mass planets, these horseshoe orbits occupy part of the gap in the disc. The radial extent of the horseshoe orbits decreases as the mass of the planet is decreased.
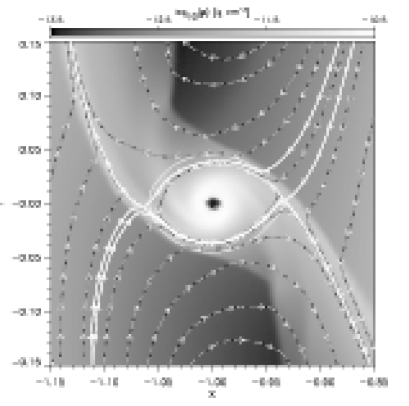
Between the outer disc and the portion of the horseshoe orbits ahead of the planet, and between the inner disc and the portion of the horseshoe orbits behind the planet, there are two streams of material that enter the Roche lobe of the planet. This is the material (along with material from above and below the disc midplane that is harder to visualise) that is accreted by the planet (see also Lubow et al. 1999). For planets with masses MJ, we notice that the breadth of these streams generally increases as the planet’s mass increases, with the breadth of the stream being of order the Roche radius of the planet. In Section 3.3, we use this observation to develop a model for the accretion rate of the low-mass planets. For the 1 and 0.3 MJ planets, the streams are significantly narrower than the planet’s Roche lobe. In fact, for the 0.3 MJ planet, no streamlines on the midplane enter the planet’s Roche lobe. Since this planet has the second highest accretion rate among the cases we consider, material is still being accreted, but the flow must be intrinsically three-dimensional with the accretion coming from above and below the midplane. The 0.3 MJ planet may be a special case, since the its Roche radius is almost identical to the unperturbed scaleheight of the disc. However, even with the 1 MJ planet, the streams entering the Roche lobe on the midplane are significantly narrower than in the two-dimensional calculations of Lubow et al. [1999], again implying that the flow into the planet’s Roche lobe is three-dimensional. To illustrate further this difference between the two-dimensional and three-dimensional accretion streams on to a Jupiter-mass planet, we have performed a two-dimensional 1 MJ calculation with identical resolution in and to our three-dimensional calculation. The density and streamlines in the vicinity of the planet are given in Figure 8 and should be compared to the top-left panel of Figure 5. The accretion streams are much broader in the two-dimensional case.


Finally, we note that flow near the 1 M⊕ planet is only marginally resolved, since the evacuated zones at the location of the planet can be seen to affect the gas flow at the boundary of the Roche lobe. Whereas the critical streamlines that mark the boundaries of the accretion streams graze the Roche lobe of the 3.3 and 10 M⊕ planets, gas is sucked into the Roche lobe of the 1 M⊕ planet by the artificial pressure gradients. This effect leads to a slight over-estimate of the accretion rate for the 1 M⊕ planet (Section 3.3).
3.2.3 The circumplanetary disc
Once inside the planet’s Roche lobe, the gas settles into a circumplanetary disc. In our calculations, the discs are resolved only for planets with masses MJ; the resolution within the Roche lobe of lower-mass planets is insufficient to follow material around complete orbits.
The scaleheight of the circumplanetary disc is much smaller than that of the circumstellar disc, , due to the planet’s vertical gravity. This can be deduced from the fact that there is no sign of the discs in the plots of density at height above the midplane (Figure 6). Furthermore, Figure 7 clearly shows the cross sections of the discs for the 1 and 0.3 MJ cases. As in two-dimensional calculations, the discs rotate in a prograde manner (Lubow et al. 1999; D’Angelo et al. 2002). These circumplanetary discs may lead to satellite formation around the planets.
Lubow et al. [1999] studied the flow inside the Roche lobe of an accreting planet. In two-dimensional calculations of a Jupiter-mass planet, they found that the circumplanetary disc contained strong shocks that led to rapid accretion of the gas through the planet’s disc. They concluded that the shocks formed from the collision of the two streams passing into the Roche lobe, one from the inner disc and one from the outer disc. D’Angelo et al. [2002] studied lower mass planets with a two dimensional nested grid code and found these shocks persisted down to planet masses of approximately M⊕.
We find that such strong shocks in the circumplanetary disc do not occur in three-dimensional calculations. They are an artifact of the two-dimensional calculations in which the streams from the inner and outer discs are forced to collide without vertical motions. The 0.3 MJ case is a particularly good example of the difference between two and three-dimensional structures, since in three dimensions there are no streamlines at the midplane that even enter the planet’s Roche lobe.
The disappearance of the spiral shocks in the circumplanetary disc when going from two to three-dimensional simulations is further illustrated for a 1 MJ planet by comparing the density and streamlines in a two-dimesional calculation (Figure 8) with those in the three-dimensional calculation (Figure 5, top-left panel). Stream collisions do occur at the midplane in both cases. But the strong spiral shocks present in the two-dimensional calculation are greatly diminished in three dimensions. This weakening in three dimensions is evidenced by the fact that streamlines within the Roche lobe are more tightly wrapped in three-dimensional case. In two dimensions, the spiral shocks drive the accretion through the circumplanetary disc with the gas losing angular momentum on each passage through a shock.
We make two suggestions for the effects of the absence of strong spiral shocks in the three-dimensional circumplanetary discs. First, accretion through the circumplanetary disc may be driven in a similar manner to accretion through the circumstellar disc, rather than by spiral shocks. Second, the more quiescent three-dimensional flow might be more conducive to satellite formation in circumplanetary discs.
3.3 Accretion rates
In Figure 9, we plot the final accretion rates in Jupiter masses per year. Lubow et al. (1999) performed two-dimensional calculations to determine the relative accretion rates of planets with masses MJ. The open circles in Figure 9 give their accretion rates, scaled to match our Jupiter-mass case. Two-dimensional calculations are adequate for modelling accretion on to high-mass planets which open well-defined gaps in the disc (Kley et al. 2001). Figure 9 then gives accretion rates over 3.3 orders of magnitude in planet mass, from 1 Earth mass to 6 Jupiter masses. As discussed in Section 3.2.2, the accretion rate on to the 1 M⊕ is slightly over-estimated because of the lack of resolution in the vicinity of the planet’s Roche lobe. Thus, the derived accretion rate is plotted as an upper limit in Figure 9.
For low-mass planets up to M⊕ (0.03 MJ), the accretion rate is proportional to the planet’s mass. The accretion rates peak at , just as the planet starts to open a gap in the disc (Figure 2). For higher masses, the accretion rate drops rapidly with increasing mass as the gap gets wider (Figure 2). As discussed by Lubow et al. [1999], the rapid decline of accretion rate at high masses provides a natural limit of about MJ for the mass of a planet on a circular orbit (see Section 4).
The gas mass accretion process is always dominated by three-body effects and the relevant capture radius is the Roche lobe radius . This statement can be justified by considering the ratio of the Roche lobe radius to the Bondi-Hoyle accretion radius which is approximately . This ratio is greater than unity for planets whose mass is less than 1 MJ for typical disc parameters (). The mass capture rate for a low-mass planet can then be estimated by a simple argument that , where is the gas density along the planet’s orbit and we have used the fact that the breadth of the accretion streams into the planet’s Roche lobe scales with the Roche radius, (Section 3.2.2). But since the velocity of the gas relative to the planet , using equation 7, we can express the accretion rate as
| (8) |
where is a constant of order unity. Consequently, we recover the numerical result that , with in the above equation (dotted lines, Figure 9).
The mass accretion efficiency was defined in Lubow et al. (1999) as
| (9) |
where is the disc surface density just outside the disc gap. The efficiency measures the ratio of the accretion rate on to the planet to the accretion rate that would occur in the disc if the planet was absent. As in Lubow (1999), we obtain accretion rates of order unity. For a 1 MJ planet, is about a factor of 2 larger than the value obtain in two dimensions. We have also calculated the mass flow rate through (i.e. past the planet). In all cases, this rate is much less than the accretion rate onto the planet. For the 1 MJ planet, which opens a well-defined gap in the disc, the flow through is less than 2% of the planet’s accretion rate. For all the lower-mass planets, the flow through is less than 7% of the planets’ accretion rates. Together, these results imply that mass freely flows into the gap, but that most is captured by the planet. Naturally, the flow past the planet would be expected to increase if the disc’s viscosity were increased.
3.4 Migration rates
A planet experiences torques due to its interaction with the disc. Resonant torques likely play an important role (Goldreich & Tremaine 1980). In addition, torques may arise from the gas that flows in the gap, including material within the planet’s Roche lobe. For low-mass planets that undergo Type I migration, resonant torques peak in value at a radial distance of order from . Consequently, it is necessary to resolve the gas density structure at distances of order from the planet. Similarly, for planets that open gaps in the disc and undergo Type II migration (i.e. they migrate due to the disc’s viscous evolution), it is necessary to resolve the flow at distances of order from the planet.
The migration rates due to resonant torques have been the subject of many linear analyses (e.g. Goldreich & Tremaine 1980; Hourigan & Ward 1984; Ward 1986; Korycansky & Pollack 1993; Ward 1997; Tanaka et al. 2002). Ward (1997) considered the motion of the planet relative to the disc material, treated the disc as being two dimensional, and did not consider corotation resonances. More recently, Tanaka et al. calculated the Type I migration rate expected from linear theory taking into account the three-dimensional nature of the disc and corotation resonances.
Tanaka et al. [2002] give the Type I radial migration velocity to be
| (10) |
where and are evaluated at , and is a value of order unity that depends on the radial variation of both the disc surface density profile and the scale height. For our disc parameters, we have . The Type II radial migration velocity is simply the viscous radial velocity of the disc
| (11) |
The migration timescales are then given by and .


3.4.1 Non-linear results
Both Ward [1997] and Tanaka et al. [2002] assume that the material near the planet (i.e. inside the planet’s Roche lobe) does not exert a net torque on the planet. In this section, we aim to compare their results with those of our simulations. Thus, when evaluating the torque on the planet from our numerical calculations, we only include torques from material at distances greater than some cutoff radius from the planet, . Our default is to set the radius of this sphere to be equal to the Roche radius of the planet, . We discuss the torques inside the Roche lobe in Section 3.4.2.
For each of the 6 planet masses, we calculate the average torque exerted on the planet over the last simulated orbital period (i.e. when the calculations have reached steady accretion). The resulting migration timescales , are plotted with filled circles in Figure 10. Notice that because the gas flow near the Roche lobe of the 1M⊕ planet is affected by the evacuated zones (Section 3.2.2), we have increased to for this case.
As seen in Figure 10, our numerical results are in excellent agreement with the linear theory of Tanaka et al. [2002] for . Although the linear theory of Tanaka et al. is only formally valid for , the agreement is excellent up to . Higher-mass planets migrate more slowly than predicted by equation 10, with a timescale than converges toward the Type II prediction at . Our migration timescales are about a factor of 3 longer than those reported from the two-dimensional numerical calculations of D’Angelo et al. [2002].
We point out, however, that the corotation resonance is subject to saturation. For our disc parameters saturation may occur for planets of mass greater than about 8 M⊕ (Ward 1992). Saturation would result in a reduction of the Type I migration timescale by less than 30%. This level of change does not significantly impact the level of agreement between the simulations and the theory on the scale of Figure 10.
The errorbars in Figure 10 do not represent the uncertainties in our measurements. Rather, they give the migration timescales that are obtained if we change the value of the cut-off radius to or ( or for the 1M⊕ case). Thus, they indicate the sensitivity of the migration timescale to the material just inside or outside of the Roche lobe.
Our numerical results show a transition from Type I to Type II migration that is qualitatively, but not quantitatively, similar to that predicted by Ward [1997]. In Figure 11, we provide an empirical fit to our results as the migration rate , where
| (12) |
Parameter is the transition mass between Type I and Type II migration. We find that a good fit is obtained with of the mass for which , i.e., (Figure 11). As can be seen from Figures 10 and 11, the transition from Type I to Type II migration involves a much smaller shift in timescales (about a factor of 2), than was suggested by Ward (1997) (about a factor of 10). Note that this shift in timescales is quite sensitive to (equations 10 and 11) and increases for thinner discs.


3.4.2 The torque distribution
Linear theory predicts that the strongest resonances occur at a radial distance of order from a planet. But since the resonances have a non-zero width, the strongest torques are exerted over a region within radial distance of order from the planet. In Figure 12, we plot the radial distribution of the torque and the cumulative torque as a function of radius (solid lines). For the low-mass planets that do not begin to open a gap in the disc (), almost the entire torque comes from a region . For higher-mass planets, the radial extent increases. For 1MJ, the torque comes from , which is consistent with a region for the high-mass planets. The resulting cumulative torque distributions are sharply peaked for low-mass planets and broad for the high-mass planets. Also visible in most of the cumulative plots are low-order resonances (e.g. the 2:1 at ), although they do not contribute significantly to the total torque. In all cases, the cumulative torque at large radius is negative, indicating inward migration.
As discussed above, in order to compare our results with linear theory, we have specifically excluded torques from material inside the Roche lobe of the planet (). In any case, as demonstrated by the gas flows in Figure 5, we only resolve the flow inside the Roche lobe for . The question arises as to whether torques from material inside the Roche lobe can affect the migration rate of the planet.
In Figure 12, the dashed lines give the torque exerted on the planet including all zones on the numerical grid. For (for which the flow inside the Roche lobe is resolved), the net torque inside the Roche lobe is positive. In fact, for the 1MJ case, the total torque is slightly positive (i.e., outward migration). The problem with including torques from deep inside the Roche lobe is that near the planet the torque per unit mass becomes very large. Therefore, small departures from axisymmetry (either real or due to finite numerical resolution) can produce a large net torque that is comparable to the net torque from outside the Roche lobe. As shown by the errorbars in Figures 10 and 11, including torques into only results in changes at the 20% level (for ). Here the flow is still reasonably well resolved. Going deeper than this, however, gives very unreliable results.


The same problem has been encountered in other studies. Lubow et al. [1999] found that the contributions to the torque from radii near the planet were in the opposite sense to the torque from further out in the disc (i.e. radii outside but near the planet gave a positive net torque and radii inside but near the planet contributed a negative torque). D’Angelo et al. [2002] found that taking into account torques near the planet usually resulted in the migration switching from inward to outward. They neglected the contribution from zones within approximately when calculating the net torque. The problem is worse in these two dimensional calculations than in three dimensions because of the strong spiral shocks within the circumplanetary disc – any asymmetry due to numerical resolution results in a large net contribution.
A related issue is that the material that is accreted by the planet and removed from the calculation carries some angular momentum. If this angular momentum were put back into the orbital angular momentum of the planet it would reduce the migration rate of the planet. The magnitude of this effect depends on the radius of the region from which the gas is removed. In most of our calculations, the amount of angular momentum that is removed is low. If it were all added to the orbital angular momentum of the planet it would reduce the migration rates by approximately 2% in the cases of the 1 and 0.3 MJ planets, by approximately 10% percent for the 0.1, 0.03 and 0.01 MJ planets, and by approximately 50% percent in the case of the 1 Earth-mass planet. The large effect for the Earth-mass planet is partially due to its accretion rate being overestimated (Section 3.2.2).
To accurately evaluate the torques from inside the Roche lobe will require higher resolution, three-dimensional calculations. It may also require a realistic equation of state, since low-mass planets may be unable to accrete gas at the rate the disc can provide it because the thermal energy of the gas cannot be radiated away quickly enough (see Section 4). For the present, we have presented an accurate determination of the torque from outside the Roche lobe and find excellent agreement with the linear theory of Tanaka et al. [2002].
3.5 Further tests of Type I migration
The discs in the above calculations had unperturbed scaleheights and surface density profiles . Tanaka et al. (2002) predicted how the migration timescales should vary with the disc’s thickness and surface density profile. To further test their predictions, we performed calculations of 10 M⊕ planets in discs with different thicknesses and surface density profiles.
We performed a calculation with . According to equation 10, the planet should migrate 4 times slower than with . We find that the planet migration timescale increases by a factor of about , where the estimated error comes from using values of ranging between and . We also note that the torque density and cumulative torque distributions are similar to those in the panels of Figure 12, except they are spread over twice the radial range around the planet. Thus, the torque is generated almost entirely within the radial range , as discussed in the previous section.
We performed a calculation with . According to Tanaka et al. [2002], the planet should migrate 36% faster than with . We find that the planet migration timescale decreases by a factor of about . The distribution of the torque is similar to the panels of Figure 12.
Given the difficulties in measuring the torques, these results are in reasonable agreement with the predictions of Tanaka et al. [2002].
4 Discussion
The accretion and migration rates from the previous sections can be used to investigate the timescale for the gas accretion phase of giant planet formation. In the core-accretion model of giant planet formation, giant planets are thought to form through gas accretion on to a solid core of about 10 M⊕ (e.g., Mizuno 1980; Hayashi, Nakazawa & Nakagawa 1985). Runaway gas accretion is thought to occur at higher masses, greater than about 50 M⊕ (Pollack et al. 1996). The overall formation timescale may be dominated by the phase between the onset of gas accretion and the beginning of runaway gas accretion. During this stage, the accretion on to the planet is limited by the energy losses in the contracting envelope. This model is subject to several major assumptions, and there are issues with the apparently small observationally inferred core mass of Jupiter (Pollack et al. 1996; Wuchterl et al. 2000). In any case, the accretion rates during this intermediate stage are typically much smaller than the rates we plotted in Figure 3.3. Consequently, the accretion rates we obtain are valid, within the framework of the current calculations of the core-accretion model, only during the runaway gas accretion phase.
As a protoplanet accretes, it will migrate through the disc. Its rate of migration is given by Figure 11. Thus, we can investigate the timescale and result of giant planet formation by starting with a core and integrating its mass and orbital radius forward in time. The results of such integrations are given in Figure 13. The evolution of the protoplanet could be stopped at any point along the curves by dispersal of the disc. We plot results for cores beginning at three different orbital radii and for three different disc surface densities (i.e. three different disc masses). We have assumed that the disc surface density varies as , but the results are very insensitive to the index; gives almost identical results.
For convenience, we assume the initial core mass is 1 M⊕ and ignore the possibility that the planet may not be able to accept mass at the rates we obtain. Notice, however, the results we obtain are insensitive to the value of the threshold mass for rapid gas accretion, as long as it is less than approximately 50 M⊕. The time required for the gas accretion to produce a giant planet is almost independent of the initial core mass, because the mass doubling timescale for a low-mass core is much shorter than that for a high-mass planet (Figure 9, right panel). Thus, only a small fraction of the total time (Figure 13) is spent while it is a low-mass core. Similarly, the orbital radius of the planet is independent of the initial core mass because the migration timescale of a low mass object is much longer than its mass doubling timescale. Thus, the timescale of runaway gas accretion phase and the final mass and orbital radii of a giant planet are essentially independent of whether one assumes that runaway gas accretion begins at 1 M⊕ or 50 M⊕.
We find the time required for a core to accrete to 1 MJ is only years. None of the objects migrates significantly during this period, and the final orbital radius of the 1 MJ planet simply depends on the initial orbital radius of the core.
Much more of a problem is the formation of very massive planets. To form a 4 MJ planet requires an order of magnitude longer ( years). Cores that begin rapid gas accretion at 2 AU migrate into the star before they reach 4 MJ, unless the disc is massive ( g cm-2 at 5.2 AU). Cores that begin at larger radii and survive all migrate significantly during this period. The formation of giant planet with is only possible for cores that begin at large distances in massive discs. To form a giant planet of 10 MJ requires either a very massive circumstellar disc, a large initial orbital radius, or both.
The above rates represent the fastest possible accretion and the least possible migration. Even then, the formation of planets with masses MJ is difficult or impossible. Thus, there is a natural limit to the mass of a giant planet of MJ, as suggested in Lubow et al. [1999]. This is in good agreement with the mass distribution of extra-solar planetary systems (e.g. Basri & Marcy 1997; Mayor, Queloz, & Udry 1998; Mazeh, Goldberg, & Latham 1998; Halbwachs et al. 2000; Zucker & Mazeh 2001; Jorissen, Mayor, & Udry 2001; Tabachnik & Tremaine 2002). However, it is worth pointing out that our results apply only to planets with circular orbits. Planets with highly eccentric orbits may accrete significantly even for masses MJ. Thus, the eccentric orbits of many observed extrasolar planets may assist them in growing to large masses.
5 Conclusions
We simulated the three-dimensional interaction of a young planet, ranging in mass from 1 M⊕ to 1 MJ, with a gaseous disc by means of the ZEUS hydrodynamics code. The disc was vertically isothermal with an unperturbed disc thickness ratio was and disc turbulent viscosity parameter was . We have analyzed the flow patterns, the accretion rates, and migration rates. Each planet was assumed to remain in a circular orbit and accrete gas without expansion on the scale of its Roche lobe. To incorporate the latter assumption into the simulations, we removed mass from the grid zones that immediately surround the planet at each timestep.
Only planets with masses MJ produced significant perturbations in the disc’s surface density; MJ (10 M⊕) is insufficient (see Figure 2). The flow near the planet is fully three-dimensional (see Figure 7). The flow at the disc midplane generally involves material that passes by the planet, two gas streams that penetrate the Roche lobe and supply material to a circumplanetary disc, and material on horseshoe orbits (Figure 4). These features are similar to those found previous two-dimensional studies (e.g., Bryden et al. 1999; Kley 1999; Lubow et al. 1999), but with some important differences.
The shocks in the circumplanetary flow are much weaker in the three-dimensional case than in the two-dimensional case (see Figures 5 and 8). The circumplanetary disc in three dimensions is likely to behave more like a standard accretion disc, rather than being subject to strong shock-driven accretion, as is the case in two-dimensions.
The gas streams at midplane are narrower in the three-dimensional case. However, the overall efficiency of accretion in three dimensions is still high. The accretion rate peaks at approximately 0.1 MJ, but a 1 MJ planet still accretes mass at a rate greater than the usual local viscous rate. This result suggests that the lower accretion occurring at the midplane in the three dimensional calculations is compensated by accretion occurring from above the midplane. For small mass planets, the accretion occurs with a cross-section whose length scale is of order the size of the Roche lobe (see Figures 4 and 9). This leads to the accretion rate increasing in proportion to the planet’s mass (equation 8).
We investigated the disc torques on planets and the resulting migration timescales. The migration timescales obtained from torques exerted outside the planet’s Roche lobe are in excellent agreement with recent linear theory (Tanaka et al. 2002), as seen in Figure 10. The transition from Type I (non-gap) migration to Type II (gap) migration occurs at . The transition is smooth with only about a factor of 2 difference in rates. The torque outside the Roche lobe is concentrated in a region of distance of order from the planet, as expected from linear theory.
It is not yet possible to determine the torques from within the Roche lobe of a planet. The problem is that the torque per unit mass increases as the distance from the planet decreases. Consequently, small numerical fluctuations in the density close to the planet give rise to numerical noise in the torque (see Figure 12). On the other hand, it is not clear that strong torques can arise close to the planet, since the outer portions of the circumplanetary disc in three dimensions appear to be quite smooth.
We considered the orbital and mass evolution of a planet, based on the orbital migration and mass accretion rates we obtained (Figure 13). For low-mass protoplanets, less than about 50 M⊕, the accretion rate may be limited by the response of the planet (see discussion in Section 4). In the absence of this limit, a planet could gain considerable mass with little migration. Starting with a higher mass core of say 50 M⊕, higher mass planets, up to about 2 MJ, can also grow with little migration. Masses as high as 10 MJ do not appear possible (as was also suggested in Lubow et al. 1999), because the planet will migrate inward over a large distance before accreting enough material.
Acknowledgments
The computations reported here were performed using the U.K. Astrophysical Fluids Facility (UKAFF) and the GRAND computer. MRB is grateful for support from the Space Telescope Science Institute’s Visitor’s Programme and the Institute of Astronomy’s Visitor’s Programme. SHL acknowledges support from NASA grants NAG5-4310 and NAG5-10732.
References
- [1992] Artymowicz P., 1992, PASP, 104, 769
- [1997] Basri G., Marcy G. W., 1997, in Holt S. S., Mundy L. G., eds., Star Formation Near and Far, AIP Press, Woodbury New York, AIP Conf. Series, 393, p. 228
- [1999] Bryden G., Chen X., Lin D. N. C., Nelson R. P., Papaloizou J. C. B., 1999, ApJ, 514, 344
- [2002] D’Angelo G., Henning T., Kley W., 2002, A&A, 385, 647
- [2001] Jorissen A., Mayor M., Udry S., 2001, A&A, 379, 992
- [1980] Goldreich P., Tremaine S., 1980, ApJ, 241, 425
- [2000] Halbwachs J. L., Arenou F., Mayor M., Udry S., Queloz D., 2000, A&A, 355, 581
- [1985] Hayashi C., Nakazawa K., Nakagawa Y., 1985, in , Protostars and Planets II. University of Arizona Press, Tucson 1100
- [1984] Hourigan K., Ward W. R., 1984, Icarus, 60, 29
- [1999] Klahr H. H., Henning T., Kley W., 1999, ApJ, 514, 325
- [1998] Kley W., 1998, A&A, 338, L37
- [1999] Kley W., 1999, MNRAS, 303, 696
- [2001] Kley W., D’Angelo G., Henning T., 2001, ApJ, 547, 457
- [1993] Korycansky D. G., Pollack J. B., 1993, Icarus, 102, 150
- [1975] Landau L. D., Lifshitz E. M., 1975, Fluid Mechanics, Pergamon, New York
- [2000] Lin D. N. C., Papaloizou J. C. B., Terquem C., Bryden G., Ida S., 2000, in Mannings V., Boss A.P., Russell S. S., eds., Protostars and Planets IV. University of Arizona Press, Tucson, p. 1111
- [1995] Lissauer J. J., 1995, Icarus, 114, 217
- [1999] Lubow S. H., Seibert M., Artymowicz P., 1999, ApJ, 526, 1001
- [1998] Mayor M., Queloz D., Udry S., 1998, in Rebolo R., Martin E. L., Zapatero Osorio M. R., eds., ASP Conf. Ser. 134: Brown Dwarfs and Extrasolar Planets, p. 140
- [1998] Mazeh T., Goldberg D., Latham D. W., 1998, in Rebolo R., Martin E. L., Zapatero Osorio M. R., eds., ASP Conf. Ser. 134: Brown Dwarfs and Extrasolar Planets, p. 188
- [1980] Mizuno H., 1980, Progress of Theoretical Physics, 64, 544
- [2000] Nelson R. P., Papaloizou J. C. B., Masset F., Kley W., 2000, MNRAS, 318, 18
- [2002] Ogilvie G. I., Lubow S. H., 2002, MNRAS, 330, 950
- [1996] Pollack J. B., Hubickyj O., Bodenheimer P., Lissauer J. J., Podolak M., Greenzweig Y., 1996, Icarus, 124, 62
- [1973] Shakura N. I., Sunyaev R. A., 1973, A&A, 24, 337
- [1992] Stone J. M., Norman M. L., 1992, ApJS, 80, 753
- [2002] Tabachnik S., Tremaine S., 2002, MNRAS, 335, 151
- [2002] Tanaka H., Takeuchi T., Ward W. R., 2002, ApJ, 565, 1257
- [1986] Ward W. R., 1986, Icarus, 67, 164
- [1992] Ward W. R., 1992, Lunar and Planetary Institute Conference Abstracts, 23, 1491
- [1997] Ward W. R., 1997, Icarus, 126, 261
- [2000] Ward W. R., Hahn J. M., 2000, in Mannings V., Boss A.P., Russell S. S., eds., Protostars and Planets IV. University of Arizona Press, Tucson, p. 1135
- [2000] Wuchterl G., Guillot T., Lissauer J. J., 2000, in Mannings V., Boss A.P., Russell S. S., eds., Protostars and Planets IV. University of Arizona Press, Tucson, p. 1081
- [2001] Zucker S., Mazeh T., 2001, ApJ, 562, 1038