An XMM-Newton observation of the Narrow Line Seyfert 1 Galaxy, Markarian 896
Abstract
XMM-Newton observations of the NLS1 Markarian 896 are presented. Over the 2–10 keV band, an iron emission line, close to 6.4 keV, is seen. The line is just resolved and has an equivalent width of 170 eV. The broad-band spectrum is well modelled by a power law slope of 2.03, together with two blackbody components to fit the soft X-ray excess. Using a more physical two-temperature Comptonisation model, a good fit is obtained for an input photon distribution of kT 60 eV and Comptonising electron temperatures of 0.3 and 200 keV. The soft excess cannot be explained purely through the reprocessing of a hard X-ray continuum by an ionised disc reflector.
keywords:
galaxies: active – X-rays: galaxies – galaxies: individual: Mrk 8961 Introduction
Narrow Line Seyfert 1 galaxies (NLS1s) are a subset of AGN with particularly narrow Balmer lines, these being only slightly broader (H 2000 km s-1; Osterbrock & Pogge 1985) than the forbidden lines; in this respect they are similar to Seyfert 2s. However, NLS1s also show an [Oiii] to H ratio of 3, which is one of the distinguishing features of Seyfert 1, rather than Seyfert 2, type galaxies (Shuder & Osterbrock 1981). The third characteristic is the frequent presence of strong Fe ii (or higher ionisation iron) emission lines; these, again, are more usually seen in Seyfert 1s than Seyfert 2s.
Observations with ROSAT found that NLS1s tend to have steep 0.1–2.4 keV X-ray slopes, leading to soft luminosities which are higher than can be explained by the reprocessing of the hard X-ray continuum. They also have increased variability in this region, with doubling timescales as short as a few minutes (e.g., Boller, Brandt & Fink 1996). A possible explanation for the extreme properties of these AGN is that they contain relatively low mass black holes, which are accreting at a high (near-Eddington) rate (Pounds, Done & Osborne 1995).
In this paper, we present XMM-Newton observations of Mrk 896 (also known as MCG0153008 and IRAS F204370259). With an H FWHM of 1135 km s-1 (Vron-Cetty, Vron & Gonçalves 2001), Mrk 896 lies towards the centre of the range of NLS1s line-widths ( 500–2000 km s-1) and is a low redshift (z = 0.0264) object, with a 5GHz flux density of 38 mJy (Bicay et al. 1995). Boller et al. (1996) measure to be 2.6 0.1 over the ROSAT band of 0.1–2.4 keV, while it was found to be 2.82 during an earlier observation (Boller et al. 1992).
2 XMM-Newton Observations
Mrk 896 was observed twice in revolution 355 (2001 November 15), as part of a sample of NLS1s. All instruments (EPIC – European Photon Imaging Camera – Strüder et al. 2001, Turner et al. 2001; RGS – Reflection Grating Spectrometer – den Herder et al. 2001; OM – Optical Monitor – Mason et al. 2001) were used over the second observation. During the first observation, the EPIC instruments were closed; data were obtained for the RGS and OM, however. The total exposure times for the various instruments were as follows: MOS – 10 ks; PN – 8 ks; RGS – 20 ks; OM – 16 kS
The pipeline-produced EPIC event-lists were filtered using xmmselect within the sas (Science Analysis Software); single- and double-pixel events (patterns 0–4) were chosen for the PN data, while the range 0–12 was used for the MOS cameras. Source spectra were extracted from the images using a circular region of 45 arcsec radius. This same region was then moved to an adjacent area of ‘blank sky’, to obtain a background spectrum.
The RGS 1 spectra for the two observations were co-added, as were the RGS 2 datasets. The spectra were binned, using the ftool command grppha, to provide a minimum of 20 counts per bin for the EPIC spectra. The Xspec v11.0.1 software package was then used to analyse the background-subtracted EPIC and RGS spectra, using the most recent response matrices. (rgsrmfgen was run within the sas to obtain the relevant RGS responses.)
Throughout this letter, H0 = 50 km s-1 Mpc-1 and q0 = 0.5 are assumed; unless stated otherwise, errors are given at the 1 level.
3 Spectral Analysis
3.1 EPIC data
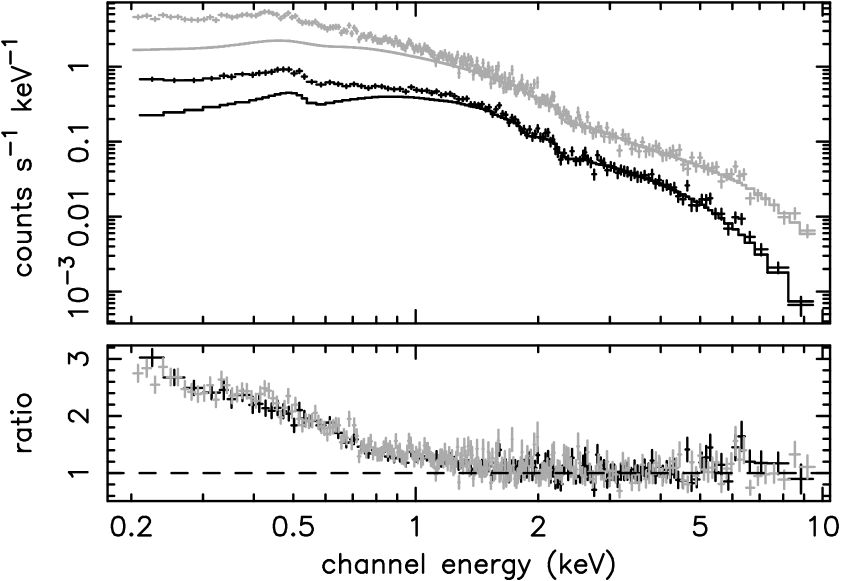
As is conventional, the first model fitted to the joint MOS+PN data was a single absorbed power law (NH fixed to the Galactic value of 3.89 1020 cm-2; Murphy et al. 1996), over the entire 0.2–10 keV bandpass. This provides a poor fit, with = 1168/720, mainly due to a strong upward curvature below 2 keV. Constraining the model solely to the 2–10 keV band, however, produces an excellent fit for a photon index 1.96 ( = 261/266; fit 1 in Table 1).
Fits to the XMM-Newton data.
a Rest-frame energy of the emission line. b Intrinsic line-width. c Blackbody temperature. d Break Energy of 1.08 0.04 keV. f frozen. Fit Range Model Ea b EW kTc /dof (keV) (keV) (keV) (eV) (keV) 1 2–10 PL 1.96 0.06 261/266 2 2–10 PL+GA 2.04 0.04 6.36 0.06 0.124 0.075 182 65 246/263 3 2–10 PL+DISKLINE 2.06 0.04 6.42 0.12 244 245/263 4 0.2–10 PL+GA+BB 2.16 0.02 6.36f 0.124f 218 50 0.088 0.002 713/717 5 0.2–10 PL+GA+2BB 2.03 0.04 6.36f 0.124f 165 48 0.084 0.003 698/715 0.224 0.022 6 0.2–10 BKNPL+GA 2.65 0.02d 6.36f 0.124f 222 54 740/717 2.15 0.02 7 0.2–10 2PL+GA 2.94 0.09 6.36f 0.124f 152 48 741/717 1.71 0.10
There were seen to be positive residuals to the fit around 6.4 keV, in both the MOS and PN data, so a Gaussian emission component was added. Allowing both the energy and width of the line to go free, the best fit was obtained for a rest energy of (6.36 0.06) keV, with = (0.124 0.075) keV. The equivalent width was measured to be 182 eV (fit 2 in Table 1). This improved the fit by of 13 for 3 degrees of freedom, corresponding to a probability of 99 per cent. A second Gaussian did not improve the fit significantly. It should be noted that freezing the energy to 6.4 keV, for neutral iron emission, gave an equally acceptable fit. Also, if the line is fixed to be unresolved ( = 0.01 keV), the fit is only worse by of one, for one degree of freedom; this line has an equivalent width of 140 eV. This is consistent with lines seen in other objects (O’Brien et al. 2001; Reeves et al. 2001; Pounds et al. 2001; Kaspi et al. 2001; Lubinski & Zdziarski 2001). However, if we assume there is no intrinsic narrow line, a diskline model (Fabian et al. 1989) can be tried (fit 3); this was found to be a good fit, with an inclination angle of 24 15o for the disc (inner radius fixed at a typical value of three Schwarzschild radii; emissivity index = 2). In this case, the narrow component corresponds to the blue ‘horn’ of the profile. It is, unfortunately, not feasible to decide with statistical significance between between the Gaussian and diskline models.
Extrapolating the 2–10 keV power law down to 0.2 keV revealed an obvious broad soft excess (Fig. 1). To model the broad–band spectrum, the iron line width and energy were fixed to the 2–10 keV values and blackbody (BB) components used to parametrize the soft excess. It was found that the breadth of the excess required two BBs to fit the observed spectrum (fit 5 in Table 1).
Since the previous ROSAT papers had modelled the soft excess region using a power law, it was decided to try fitting the XMM soft X-ray spectrum with a simple power law. Over the 0.1–2.4 keV ROSAT band-pass we get = 2.55 0.01, in close agreement with the value given by Boller et al. (1996). Using either two separate power laws or a broken power law model over the 0.2–10 keV bandpass (fits 6 and 7 in Table 1) provides statistically acceptable fits, although they are much worse than for the blackbody parametrisation (or thCompfe; see below). Thus the soft X-ray spectrum shows intrinsic curvature.
The broad-band best-fit model (fit 4) gives a 0.2–10 keV flux of 7.85 erg cm-2 s-1, which corresponds to a luminosity of 3.35 erg s-1; 30 per cent of this luminosity is due to the multiple blackbody components used to model the soft excess. The 2–10 keV luminosity was measured to be 9.67 erg s-1. Over the ROSAT band, the power law model gave a luminosity very similar to the value given in Boller et al. (1996) but about half that seen in an earlier ROSAT observation (Boller et al. 1992).
3.1.1 Variability Analysis
Figure 2 shows the MOS and PN 0.2–10 keV lightcurves for Mrk 896 during the XMM-Newton obervation. There is a 20-25 per cent variation in count rate over a few thousand seconds, which is consistent with other NLS1s (e.g., Boller, Brandt & Fink 1996). Boller et al. (1996) saw a variation by a factor of 1.9 in just under 300 ks; here, we find a much faster variation, of 1.5 in 3 ks, although even this more rapid change only corresponds to a radiative efficiency value of 0.3 per cent (Fabian 1979). Over this short observation, we find no evidence for a difference in the variability amplitude when comparing the 0.2–1 keV and 1–10 keV bands; the calculated hardness ratio is fully consistent with being constant throughout the observation (lower panel of Figure 2). Using a cross-correlation function, no significant time delay between the hard and soft bands is found, with an upper limit of 270 seconds. Assuming a black hole mass of 106 (see section 3.1.2), this sets a limit of 27 Schwarzschild radii for the size of the emitting region.


3.1.2 Comptonisation fits
Although modelling the spectrum with a power law and BB components produces a good fit, it has no physical basis. Using the relationship between the temperature of the accretion disc and the black hole mass (e.g., Peterson 1997)
(where is the mass accretion rate, is the Eddington accretion rate, M8 signifies the mass of the central black hole in units of 108 and Rsch is the Schwarzschild radius), the temperature expected for the inner-most part of the accretion disc (r = 3 Rsch), for 106 black hole radiating at 0.5 is 60 eV. [The black hole mass was estimated by assuming a bolometric luminosity of 10 the 0.2–10 keV X-ray value and taking this to be the Eddington limit. This, together with the assumed accretion rate, is an acceptable value, since NLS1s are thought to be low mass systems with high mass-accretion rates (Pounds, Done & Osborne 1995).] This is an upper limit to the accretion disc temperature, since areas more distant from the black hole will be radiating at lower values. It can be seen that the BB of 80 eV is broadly consistent with this value, while the 200 eV component could not be produced through thermal radiation from the disc.
A more realistic model involves Comptonisation: soft photons from the accretion disc are up-scattered by hot, thermal electrons, possibly located in a corona above the disc. A two-temperature distribution leads to the formation of both the soft excess and the harder power law slope. To determine whether Comptonisation could be used to explain the Mrk 896 spectrum, the Xspec model comptt was used. Initially, just the soft excess was modelled in this fashion; i.e., the power law component was used for the higher energy part of the spectrum, with the iron line fixed as in Fit 2. This led to a very good fit ( = 704/715), for = 2.06 0.04, together with an input photon temperature of (67 5) eV and a Comptonised component of kT = (0.47 0.23) keV and = 6.7 2.3.
When using a second comptt component to replace the power law, it was found that the temperature for the hotter distribution could not be very well constrained. This is due to the fact that the exponential cut-off produced in the Comptonisation fit lies outside the XMM energy band-pass and cannot, therefore, be easily determined. However, a statistically good fit is obtained when the temperature is fixed at 200 keV; the model parameters are given as Fit 8 in Table 2 and, again, the iron line was kept as in Fit 2. It must be noted that, because of fixing the hotter kT, the error on the optical depth appears small.
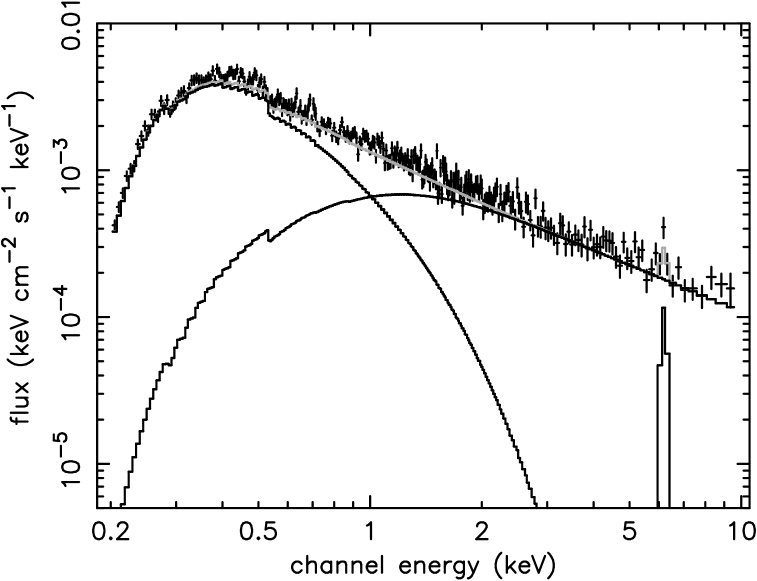
There are many theories for the production of the X-ray spectra through Comptonisation (and others which do not invoke Comptonising distributions). When modelling the spectrum of Mrk 896 using comptt, it was assumed that cool disc photons were Comptonised by one of two temperature distributions. Although this is a possible model, it is more likely that there is a ‘layered’ structure, such that most of the thermal photons are first Comptonised by the cooler of the electron distributions, forming the photons we see as the broad soft excess; following this interaction, some of these photons will be further Comptonised by the hotter electrons (likely to be produced through magnetic reconnection above the accretion disc; this electron distribution may be non-thermal), producing the power law tail seen at higher energies. If this is indeed the case, then the input photon temperature for the hotter Comptonisation should be that produced by the first Comptonisation stage. This is the situation assumed when fitting with thCompfe, an alternative Comptonisation model (Życki, Done & Smith 1999) which takes into account the roll-off of the power law at lower energies due to the input photon distribution. In this respect, it is a more self-consistent model, and tends to give better-constrained results. Using thCompfe produces an excellent fit, with of 704/715 (Fit 9 in Table 2). The temperature of the hotter distribution was fixed to 200 keV, but the cooler electron temperature was allowed to float. Figure 3 shows the spectrum. It should be noted that assuming the same input photon population for both Comptonising distributions also produces as good a fit, although the temperature of the electrons producing the soft excess photons is not well constrained. Overall the Comptonisation models provide as good a fit to the data as the BB model since they reproduce the spectral curvature better than multiple power law models. Using the F-test, a value of F 18 is obtained from the Comptonisation model over the power law fits of the soft excess; this corresponds to an improvement of 99 per cent.
Comptonisation fits to the broad-band XMM data.
t tied to cooler component f frozen cooler comptonising component hotter comptonising component Fit Model input photons Compt. temp. optical depth input photons Compt. temp. optical depth /dof (eV) (keV) (eV) (keV) 8 comptt 66 5 0.54 0.34 6.2 3.1 66t 200f 0.14 0.01 704/715 9 thCompfe 58 5 0.28 0.18 13.8 6.3 280t 200f 0.77 0.03 704/715
3.1.3 Ionised disc fit
An ionised accretion disc reflection model, described by Ballantyne et al. 2001, was also used, initially to fit the 2–10 keV energy range. The best fit obtained was found to consist of a power law component, of = 2.04 0.04, with an ionisation parameter of 1.37 0.35 erg cm s-1 (i.e., only weakly ionised) and a reflection component, R = 0.52 , where R = /2. This gave a reduced value of 250/266, which is not significantly different than the value of 246/263 for a Gaussian fit.
Ionised reflection may contribute to the soft X-ray curvature observed in broad-band AGN X-ray spectra, often removing the need for multiple blackbodies (e.g., for Mrk 205, Reeves et al. 2001; Mrk 359, O’Brien et al. 2001; Mrk 509, Pounds et al. 2001). Even upon including the ionised reflection model in the fits, and allowing the ionisation parameter to vary, two BB components (with temperatures very similar to the fit without the ionised reflector) were still required to fit the broad-band Mrk 896 spectrum ( = 716/717); however, the normalisations of the blackbody components were reduced by approximately 25 per cent in strength. It is clear, therefore, that not all of the soft excess in this object can be explained purely through the reprocessing of the primary, hard X-ray component by an ionised disc.
3.2 RGS data
The RGS instrument allows a more detailed investigation of the soft X-ray spectrum. In an earlier paper (O’Brien et al. 2001), the NLS1 Mrk 359 was analysed. The RGS data for this object were found to show an absorption trough, possibly corresponding to Fe M ions (e.g., Sako et al. 2001), together with emission lines from O viii Ly and the Ne ix and O vii triplets. The RGS spectrum of Mrk 896 shows a weak absorption trough around 16.9 Å (rest frame), which could correspond to an Fe M feature, and a small peak around the energy expected for O viii Ly (rest frame wavelength of 18.9 Å). However, fitting a similar model to that used for Mrk 359 provides only equivalent-width upper limits for these spectral features of EW 18.4 eV and EW 12 eV respectively. Similarly, the respective combined upper limits for the Ne ix ( = 13.6 Å) and O vii ( = 22.0 Å) triplets are EW 11.6 eV and 10.3 eV. There are also no strong absorption edges within the data, with (O vii) 0.35 and (O viii) 0.16 (at the 90 per cent confidence level).
The lack of strong spectral features in the soft energy region implies that the observed soft excess is not dominated by a blend of soft X-ray lines (e.g., Turner et al. 1991). The shape of the spectrum is also very different from MCG63015 and Mrk 766, where relativisitc lines were used to fit the soft excess by Branduardi-Raymont et al. (2001).
3.3 OM data
Mrk 896 was observed using the V-band filter of the Optical Monitor only. A magnitude of mV = 15.28 0.01 was obtained, corresponding to a flux of 2.735 mJy. The OM uses a small aperture size of six arcsec. Winkler (1997), however, used a twenty arcsec aperture, which includes more of the host galaxy, so obtaining a brighter magnitude of 14.4. Figure 4 shows the position of the optical points (from Winkler 1997 and the OM – circle and star markers respectively) in relation to the X-ray data, together with the radio measurement obtained from Bicay et al. (1995) and four IR data points, obtained from the IRAS Faint Source Catalogue, version 2.0 (Moshir et al. 1990).

4 Discussion
A simple analysis of the broad-band XMM-Newton spectrum of Mrk 896 reveals a soft excess lying above a power law, fitted over the 2–10 keV band, as is typical for observations of AGN (e.g., Pounds & Reeves 2002). The lack of strong spectral features in the RGS spectrum appears to rule out the possibility that the soft excess could be due to the blend of soft X-ray lines. It is found that a two-temperature Comptonisation model, where photons from the accretion disc undergo inverse-Compton scattering with hot electrons to produce the soft excess and hard ‘power law’ respectively, fits the spectrum very well. The input photons are 60 eV (appropriate for emission from the inner-most regions of the accretion disc) and the Comptonising distributions have temperatures of kT 0.3 and 200 keV. It is possible that the input photons for the hotter electron distribution are those which have been previously Comptonised by the soft-excess-producing population; however, the geometry of the inner regions of active galactic nuclei is unknown. It could be that photons emitted from the accretion disc are directly Comptonised to form the harder power law slope. Alternatively, the hotter electrons may be a non-thermal distribution (see Coppi 1999 and Vaughan et al. 2002 for details of hybrid thermal/non-thermal plasmas).
Considering the temperatures found for the blackbody fit, the cooler of the two components ( 85 eV) is consistent with being the high-energy tail of the big blue bump, while the hotter, 225 eV BB corresponds to the temperature of the soft-excess-producing Comptonising component. (The power law replaces the higher-temperature Comptonised term.)
It should be noted that it is not possible statistically to differentiate between the blackbody and Comptonisation models fitted to these data.
A neutral Fe K emission line is also found. Although an ionised accretion disc model can be invoked to explain the slight broadening of the iron emission line, this does not account for the entire curvature at lower energies; that is, the soft excess cannot arise simply through the reprocessing of the hard X-ray continuum. The line is, however, consistent with being a narrow feature; it is becoming increasingly apparent that almost all broad-line AGN, below a luminosity of 1045 erg s-1, show this feature, with the lower luminosity objects having the stronger lines. It is thought that this narrow line is formed through fluorescence in distant, cool matter, possibly the BLR or putative molecular torus (e.g. Ghisellini, Haardt & Matt 1994), with higher luminosity objects having smaller covering factors (O’Brien et al. 2001; Pounds & Reeves 2002).
5 ACKNOWLEDGMENTS
The work in this paper is based on observations with XMM-Newton, an ESA science mission, with instruments and contributions directly funded by ESA and NASA. The authors would like to thank the EPIC Consortium for all their work during the calibration phase, and the SOC and SSC teams for making the observation and analysis possible. This research has made use of the NASA/IPAC Extragalactic Database (NED), which is operated by the Jet Propulsion Laboratory, California Institute of Technology, under contract with the National Aeronautics and Space Administation. Support from a PPARC studentship and the Leverhulme Trust is acknowledged by KLP and JNR respectively.
References
- [Ballantyne 2001] Ballantyne D., Ross R.R., Fabian A.C., 2001, MNRAS, 327, 10
- [Bicay 1995] Bicay M.D., Kojoian G., Seal J., Dickinson D.F., Malkan M.A., 1995, ApJS, 98, 369
- [Boller 1992] Boller Th., Meurs E.J.A., Brinkmann W., Fink H., Zimmermann U., Adorf H.-M., 1992, A&A, 261, 57
- [Boller 1996] Boller Th., Brandt W.N., Fink H., 1996, A&A, 305, 53
- [Branduardi-Raymont 2001] Branduardi-Raymont G., Sako M., Kahn S.M., Brinkman A.C., Kaastra J.S., Page M.J., 2001, A&A, 365, L140
- [Coppi 1999] Coppi P.S., 1999, in ASP Conf. Series 161, High Energy Processes in Accreting Black Holes, eds. J. Poutanen & R. Svensson, 375
- [Fabian 1979] Fabian A.C., 1979, Proc. R. Soc. London., Ser A., 336, 449
- [Fabian 1989] Fabian A.C., Rees M.J., Stella L., White N.E., 1989, MNRAS, 238, 729
- [Ghisellini 1994] Ghisellini G., Haardt F., Matt G., 1994, MNRAS, 267, 743
- [Kaspi 2001] Kaspi et al. , 2001, ApJ, 554, 216
- [Lubinski 2001] Lubinski P., Zdziarski A.A., 2001, MNRAS, 323, L37
- [Mason 2001] Mason K.O. et al. , 2001, A&A, 365, L36
- [Moshir 1993] Moshir M. et al. , 1990, IRAS Faint Source Catalogue, version 2.0
- [Murphy 1996] Murphy E.M., Lockman F.J., Laor A., Elvis M., 1996, ApJS, 105, 369
- [O’Brien 2001] O’Brien P.T., Page K., Reeves J.N., Pounds K., Turner M.J.L., Puchnarewicz E.M., 2001, MNRAS, 327, 37
- [Osterbrock 1985] Osterbrock D.E., Pogge R.W., 1985, ApJ, 297, 166
- [Peterson 1997] Peterson B.M., 1997, An introduction to Active Galactic Nuclei, CUP, Cambridge, UK
- [Pounds 2002] Pounds K.A., Reeves J.N., 2002, in New Visions of the X-ray Universe in the XMM-Newton and Chandra era (astro-ph/0201436)
- [Pounds 1995] Pounds K., Done C., Osborne J., 1995, MNRAS, 286, 513
- [Pounds 2001] Pounds K., Reeves J., O’Brien P., Page K., Turner M., Nayakshin S., 2001, ApJ, 559, 181
- [Reeves 2001] Reeves J.N., Turner M.J.L., Pounds K.A., O’Brien P.T., Boller Th., Ferrando P., Kendziorra E., Vercellone S., 2001, A&A, 365, L134
- [Sako 2001] Sako M. et al. , 2001, A&A, 365, L168
- [Shuder 1981] Shuder J.M., Osterbrock D.E., 1981, ApJ, 250, 55
- [Strüder 2001] Strüder L. et al. , 2001, A&A, 365, L18
- [Turner 2001] Turner M.J.L. et al. , 2001, A&A, 365, L27
- [Turner 1991] Turner T.J., Weaver K.A., Mushotzky R.F., Holt S.S., Madejski G.M., 1991, ApJ, 381, 85
- [Vaughan 2002] Vaughan S., Boller Th., Fabian A.C., Ballantyne D.R., Brandt W.N., Trmper J., 2002, MNRAS, in press (astro-ph/0207650)
- [Veron 2001] Vron-Cetty M.P., Vron P., Gonçalves A.C., 2001, A&A, 372, 730
- [Winkler 1997] Winkler H., 1997, MNRAS, 292, 273
- [Zycki 1999] Życki P.T., Done C., Smith D.A., 1999, MNRAS, 305, 231