The temperature and distribution of gas in CL 001616 measured with XMM-Newton
Abstract
We present results of a 37 ks observation of CL 001616 with the XMM-Newton EPIC instrument. Within 1.5 arcmin of the cluster centre we measure a gas temperature of keV and an abundance of times the solar value ( uncertainties). This significant improvement over previous measurements has allowed us to revise the estimate of the Hubble constant based on CL 001616 to (random error only), close to the value from the Hubble Space Telescope distance-scale project. The total gravitating mass within a radius of 248 kpc of the cluster centre is in good agreement with that found from gravitational lensing over the same region, supporting the assumption of isothermal gas in hydrostatic equilibrium. The gas mass fraction of is in remarkable agreement with that given by cosmological parameters for the Universe as a whole, suggesting that CL 001616 is a fair sample of the matter content of the Universe. While there is no spectral or spatial evidence to suggest a cooling flow in CL 001616, we find an asymmetrical central X-ray structure which may have a harder spectrum than the cluster as a whole, and be evidence for some merger activity, in addition to a previously reported asymmetry to the west of the cluster. The nearest companion cluster to CL 001616 is measured to have a gas temperature of keV and an abundance of times the solar value ( uncertainties). We also present spectral data for the companion quasar whose spectrum was confused with CL 001616 in previous ASCA data.
keywords:
cosmology: observations – galaxies: clusters: individual (CL 0016+16, RX J0018.3+1618) – intergalactic medium – quasars: individual: E 0015+162 – X-rays: galaxies: clusters1 Introduction
The galaxy content of cluster CL 001616 was described by Koo (1981) following its discovery by Kron (1980) in a photometric survey for faint galaxies. Its high redshift, (Dressler & Gunn 1992), evident richness, high X-ray luminosity ( ergs s-1; White, Silk & Henry 1981), and large Sunyaev-Zel’dovich effect (Birkinshaw, Gull & Moffet 1981) led to extensive work on its properties as the prototypical example of a distant rich cluster.
More recent X-ray and optical observations of the field of CL 001616 have found other nearby clusters of galaxies of lower mass but similar redshift (Hughes, Birkinshaw & Huchra 1995; Connolly et al. 1996; Hughes & Birkinshaw 1998a), suggesting that CL 001616 is the dominant member of a supercluster at . A quasar a few arcmin north of CL 001616 (Margon, Downes & Spinrad 1983) is also associated with this structure.
The gas properties of CL 001616 have been the subject of particular study. Two reasons for this stand out: the intracluster gas can be used to study the cluster mass and baryonic mass fraction, and the combination of X-ray and Sunyaev-Zel’dovich data can be used to estimate the cluster’s distance and hence the Hubble constant or other cosmological parameters.
Grego et al. (2001) used X-ray data and the Sunyaev-Zel’dovich effect of CL 001616 to measure a gas mass fraction, , that is close to the value seen in nearby clusters, implying that there is little evolution in between and today. If cluster gas is the dominant baryonic component of CL 001616, and CL 001616 is a fair sample of the matter content of the Universe, will be close to the baryonic mass fraction of the Universe, . However, the temperature of the cluster gas is a necessary component of the calculation of both the gas and total masses, and improved measurements of the gas temperature would be expected to improve the reliability of cosmological conclusions drawn from studies of the mass components of the cluster.
Good knowledge of the cluster temperature would also allow a comparison between the mass derived from the assumption that the cluster gas is in hydrostatic equilibrium and the mass measured by Smail et al. (1997) using a gravitational shear technique. This could set limits on the three-dimensional shape of CL 001616, which is a source of systematic error in the use of any cluster as a cosmological tracer.
Three independent Sunyaev-Zel’dovich effect measurements of CL 001616 (Hughes & Birkinshaw 1998b; Reese et al. 2000; Grainge et al. 2002) have been combined with X-ray data to measure the distance of the cluster. All three lead to values for the Hubble constant of about assuming (this would be for a cosmology with , ). The low value of the Hubble constant found by this technique might be attributed to projection or selection effects, calibration uncertainties, unresolved substructure, or some other problem, but it is clear that a substantial fraction of the random component of the error is due to uncertainty in the X-ray temperature. A deep X-ray observation with XMM-Newton, which can detect arriving cluster photons of energy up to about 10 keV, and so can make a better measurement of the temperature of a hot cluster such as CL 001616 (which Hughes & Birkinshaw 1998b found to have in the rest frame), would be expected to resolve this problem.
Thus we obtained a long XMM-Newton observation of CL 001616 with the aim of improving the measurement of the temperature and metal abundance of the cluster, and hence making it more useful as a cosmological tracer. This paper describes the data, their analysis, and the implications for the temperature and structure of CL 001616 and one of the companion clusters in the supercluster. We also present the XMM-Newton spectrum of the companion quasar. We revise the estimate of the Hubble constant based on CL 001616 using our new temperature for the cluster, and compare an estimate of the total gravitating mass with that measured from gravitational lensing. We compare the gas mass fraction in CL 001616 with the value for the Universe as a whole given by . Finally, we point out structural features of CL 001616 which require further study.
We use a cosmology in which and , and we adopt km s-1 Mpc-1 outside the discussion of the use of CL 001616 as a tracer of the Hubble flow.
2 Observations
XMM-Newton observed CL 001616 on December 30th, 2000. In this paper we concentrate on data from the European Photon Imaging Camera (EPIC) which incorporates one pn (Srüder et al. 2001) and two MOS (MOS1 and MOS2; Turner et al. 2001) CCD-array cameras. The cameras were operated in Full Frame mode with the medium optical blocking filter. The data were provided to us in the form of two separate observations, of maximum livetime (for the MOS cameras) roughly 31.3 ks and 5.5 ks, separated by 110 minutes. Analysis presented here uses the latest software available from the XMM-Newton project at http://xmm.vilspa.esa.es/, sas v5.3.3. Calibrated event files were generated using the emchain and epchain scripts (described in detail on the project WWW site) and, after merging the data for each camera separately for the two observations, we have selected for analysis the good events with patterns 0 to 12 from the MOS data and patterns 0 to 4 from the pn data.
The light curves extracted from the full-field, pattern=0, 10–12 keV events were examined for intervals of high particle background, which we defined as those with ct s-1 for MOS1 and MOS2, and ct s-1 for the pn. After removing the high-background intervals, the remaining exposure times were roughly 35.9 ks, 36 ks, and 24.3 ks for MOS1, MOS2, and pn, respectively.
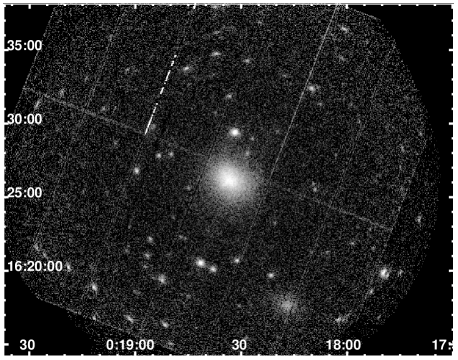
Our analysis follows the prescription in Arnaud et al. (2002). This is superior to the simple use of local background in analysing extended-source data because it treats separately the non-vignetted particle background and the vignetted cosmic X-ray background. First the evigweight task was run on both CL 001616 and blank-sky data so that after their subtraction the spectra and surface-brightness profiles (with local background) that are extracted are corrected for vignetting. The vignetting-corrected MOS1, MOS2 and pn event files have been combined for display purposes. Figure 1 shows the 0.3–5 keV image of a wide field, centred on CL 001616, from this merged event file.
We use the data compiled by Lumb (2002), taken from deep-sky exposures cleaned of sources, to subtract from our data the particle background, which is assumed to provide all the pattern=0 counts between 10 and 12 keV. After applying our good-time-interval screening, the full-field, pattern=0, 10–12 keV count rates are the same in the CL 001616 and blank-sky fields to within 1%, 7% and 16%, for the MOS1, MOS2, and pn, respectively. The relevant scaling factor is applied to the vignetting-corrected blank-sky data before subtraction from the image data.
The blank-sky data are not expected to be a good representation of the background in the CL 001616 data at low energies. Here the cosmic X-ray background is the dominant contributor and, more importantly, at energies below about 1 keV the medium optical blocking filter used for our observations has a lower transparency than the thin filter used for the blank-sky data. This results in an over-subtraction of background at the lowest energies. This is corrected for by using a blank-sky-subtracted source-free region of the CL 001616 image as a background for the blank-sky-subtracted on-source data. By selecting this background region to be an annulus of radii 4 and 11 arcmin, between position angles 90 and 120 degrees, and 220 and 310 degrees, we limited the number of source-contaminated exclusion regions to one circle of radius 30 arcsec.
As data have been corrected for vignetting, spectral fitting uses on-axis response matrices and effective areas. We have used the version 6 response matrices made available by the project, and have generated on-axis effective areas using the arfgen task. Bins between energies of 0.4 and 10 keV are included in spectral fitting using the xspec software.
3 Emission-weighted Cluster Temperature
For good signal to noise, we have found the cluster spectral parameters using the net counts (roughly 32,600 counts between 0.4 and 10 keV) extracted from a circle of radius 1.5 arcmin. We fitted the data to a redshifted mekal model modified by local Galactic absorption. We let the relative normalization between the MOS1, MOS2 and pn data be free but all other parameters are in common. This results in MOS1 and MOS2 normalizations in good agreement, but the pn normalization is a few per cent lower, consistent with the evaluation of the EPIC flux calibration by Saxton (2002).
We obtain a value of cm-2 (95% confidence for one interesting parameter) for the Galactic hydrogen column density when it is a free parameter, in agreement with the value of cm-2 found from 21 cm observations (Dickey & Lockman 1990). The value of the redshift fitted from the X-ray spectrum, , is slightly low as compared with published optical values of 0.5455 (Dressler & Gunn 1992) and 0.5481 (Ellingson et al. 1998), suggesting that, although the EPIC energy scale is believed to be calibrated to better than 5 eV (Kirsch 2002), there may be a small additional systematic error in the CL 001616 observations. We have fixed the Galactic absorption to the 21 cm value but have allowed the cluster redshift to be free in finding the cluster parameters and uncertainties reported in this paper.
The best fit gives keV and an abundance of times the solar value, where uncertainties are statistical and quoted as (unbracketed), with 95% errors given in brackets, for one interesting parameter. The model is shown together with the data in Figure 2, and joint-confidence uncertainty contours are shown in Figure 3. With a reduced of 1.09 ( for 786 degrees of freedom) the null hypothesis probability is only 4%, but this is likely to result from the high statistical precision of the data coupled with small remaining systematic calibration uncertainties (Saxton 2002). An apparently random scatter in the residuals to the pn data is diminished if the pattern=0 events only are used for the pn, making the combined MOS and pn fit acceptable (reduced of 1.01: for 697 degrees of freedom). However, as the best-fit parameter values are unchanged, we elect to include patterns 0–4 in the fits to improve statistical accuracy.
There is consistency between the parameter values fitted separately for data from the MOS (, abundance times the solar value, , cm-2) and pn ( , abundance times the solar value, , cm-2), all quoted with 95% uncertainties for one interesting parameter.
The observed 2–10 keV flux within the circle of 1.5 arcmin radius is measured to be ergs cm-2 s-1 and ergs cm-2 s-1 with the MOS and pn cameras, respectively. Between 0.4 and 10 keV the values are ergs cm-2 s-1 and ergs cm-2 s-1, respectively. The average volume-weighted emission measures () are cm-5 and cm-5, respectively ( uncertainties)111 In the xspec X-ray spectral-fitting software used here, and by most authors, the normalization given by fitting thermal plasma models is times the volume-weighted emission measure..


4 Gas Distribution
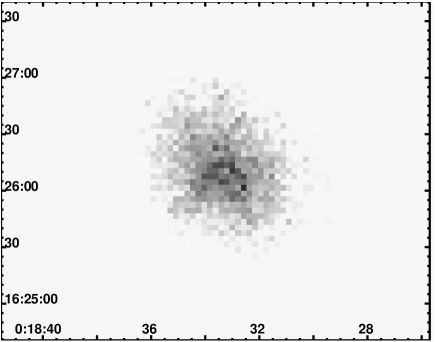
The intensity distribution of X-ray emission in the central part of CL 001616 (Fig. 4) shows an apparent filamentary structure in the shape of an inverted ‘V’. A true colour image, made using software from the Chandra project (the ciao dmimg2jpg task), with counts in 0.3–1 keV, 1–2 keV, and 2–8 keV corresponding to red, green and blue, respectively, suggests that the emission at the centre of the ‘V’ may be hotter than in the surrounding part of the cluster. However the prong to the SE appears cooler than average.
These spectral differences also appear when we use the iraf/stsdas ellipse program to model the underlying large-scale structure of the cluster, and then subtract a scaled version of the model first from a 0.3–1.5 keV image and then a 2–8 keV image. The most prominent positive residuals in the soft image track the SE prong of the inverted ‘V’, whereas in the hard image they are at the cluster centre. The diffuse asymmetric emission to the west of the cluster, at about 1.5 arcmin from the centre (Fig. 1), appears somewhat softer than CL 001616 as a whole. This western diffuse emission was previously discussed by Neumann & Böhringer (1997) using ROSAT data, and is interpreted as a merging subcomponent of the cluster that is associated with a peak in the weak-lensing mass map of Smail et al. (1995).
We have fitted separately the counts within a source-centred circle of radius 0.6 arcmin and a source-centred annulus of radii 0.6 and 1.5 arcmin using the method and model described in §3. The results (Fig. 5) indeed show that the inner region is hotter and of higher abundance than the outer one, at a combined confidence of 99% for two interesting parameters. The evidence for spatial and temperature structure in the inner regions may result from merger activity. A deeper observation would be required to probe this in detail.

We have extracted the circularly-symmetric radial profile of background-subtracted 0.3-5 keV counts and fitted it to a spherical, isothermal, model of surface brightness , convolved with the point spread function (PSF). While the cluster is clearly ellipsoidal in appearance, and displays hotter regions within its core, the value of and the average core radius of the model produced by fits of spherical functions are close to those obtained by making more complicated ellipsoidal fits (see Tables 1 and 2 in Hughes & Birkinshaw 1998b). If the fit results are to be used in the calculation of the distance of the cluster (as, for example, in §7), then values obtained from ellipsoidal fits could not be used directly to estimate , since the projection is unknown for any individual cluster. However, estimates obtained from spherical model fits for a population of clusters are almost unbiased, provided that the clusters are selected in an orientation-unbiased fashion. Thus spherical modeling of clusters is sufficient for the purpose of building up a sample of distance measures from clusters.
To construct the radial profile we have summed the counts from the three cameras. For the PSF we have used the on-axis parameter values for 1 keV from Ghizzardi’s (2001, and private communication in 2002) fits of a model to data from stellar sources. We have summed the MOS1, MOS2, and pn PSFs, weighted by each camera’s contribution to the counts from CL 001616. The counts from a circle of radius 20 arcsec around the quasar 3.25 arcmin to the north of CL 001616 (Fig. 1) are excluded from the fits.
The radial profile and best-fit model are shown in Figure 6. While the filamentary structure seen in Figure 4 leads to a poor fit within about 20 arcsec of the centre, this has negligible effect on the values found for and , and the overall fit is acceptable ( for 37 degrees of freedom). The values found are , and arcsec, where, since the parameters are strongly correlated, the errors quoted are one sigma for two interesting parameters. Nothing in the radial profile or spectral properties of CL 001616 is suggestive of a cooling flow.

5 Companion Cluster, RX J0018.3+1618
The companion cluster to the SW of CL 001616 (Fig. 1) appears redder than CL 001616 in a true colour image (made as in §4). We have found spectral-parameter values using on-source net counts from a circle of radius 1.5 arcmin (roughly 3,200 counts between 0.4 and 10 keV) in a similar manner to the extraction and fitting for CL 001616 itself. The fit to a mekal model is good, with for 101 degrees of freedom. The column density of cm-2 ( errors) is consistent with the value from 21 cm measurements ( cm-2; Dickey & Lockman 1990), and so we fix the value to the radio-derived measurement. Figure 7 shows the data and model whose best-fit parameter values and uncertainties are as follows, where the latter are (95%) confidence for one interesting parameter where all the other parameter values are allowed to vary: , abundance times solar, . The redshift is consistent (at 95% confidence, or if the systematic error of 0.016 suggested for CL 001616 is applied) with the value of found from optical measurements by Hughes et al. (1995) who were able only to place a lower limit on the cluster temperature ( keV in the observed frame) using data from ROSAT. The precision with which the spectral parameters for the companion cluster are measured is similar to that with which the parameters for CL 001616 were known prior to this work (Furuzawa et al. 1998; Hughes & Birkinshaw 1998b).

The net observed 2–10 keV and 0.4–10 keV fluxes are measured to be ergs cm-2 s-1 and ergs cm-2 s-1, respectively. The volume-weighted emission measure is cm-5.
Because this cluster lies on a gap between CCDs in the pn camera, as can be seen in Figure 1, we have fitted the radial profile using only data from the MOS cameras. The parameter values found for a model, convolved with the PSF corresponding to the off-axis position of the cluster, are of comparable value and precision to the values found by Hughes et al. (1995) using ROSAT PSPC data. We find , arcsec ( uncertainties).
6 Companion Quasar, E 0015+162
The companion radio-quiet quasar of redshift 0.554 (Margon et al. 1983) to the north of CL 001616 (Fig. 1) has a relatively steep spectrum, and we use the net counts between 0.3 and 10 keV within a source-centred circle of radius 40 arcsec for our fits. A fit to an absorbed power law is acceptable ( for 126 degrees of freedom), with the column density consistent with the Galactic value from 21 cm measurements. is reduced by 7.1 for one extra parameter (significant at 99% confidence on an F test) when a narrow Fe fluorescence line, modeled as a Gaussian of fixed rest-frame energy 6.4 keV and eV (small compared with the roughly 130 eV FWHM resolution of EPIC at the observed energy) is included in the model. If the line energy is allowed to be a free parameter, the best-fit value and error is . Fixing the line energy at 6.4 keV, the following parameter values and uncertainties are found, where the latter are (95%) confidence for one interesting parameter where all the other parameter values are allowed to vary: power-law photon index , cm-2, equivalent width of the Fe line eV. The spectrum is shown in Figure 8. The observed 0.5–10 keV flux from the quasar is ergs cm-2 s-1 ( error) and the luminosity is ergs s-1.

The AGN is roughly 8% the strength of CL 001616 (in a cluster-centred circle of radius 4 arcmin) in terms of net counts between 0.4 and 10 keV (roughly 3,500 counts from the AGN). Reeves et al. (1997) fitted the ASCA spectrum of the AGN and found only an upper limit for narrow Fe fluorescence-line emission, but the ASCA spectrum would have been heavily contaminated with emission from CL 001616, and this would seem to account for the inconsistency between our results and the flat spectral index () and large flux ( ergs cm-2 s-1 between 0.5 and 10 keV) found by these authors. Our spectral index is consistent with the value of ( error) found for the quasar by Hughes & Birkinshaw (1998b) from a combined thermal and power-law model fitted jointly to ASCA and ROSAT PSPC data in order to characterize the emission both from CL 001616 and the quasar. Their power-law normalization is also consistent with our better-determined value. XMM-Newton has improved the precision with which the spectral index is measured by a factor of three, and has provided the first evidence for an Fe fluorescence line in this radio-quiet quasar.
7 Hubble constant and Gas Content of CL 001616
XMM-Newton has measured the temperature of CL 001616’s atmosphere to . This is a considerable improvement on the uncertainty obtained using ASCA and ROSAT (Hughes & Birkinshaw 1998b), and so reduces one of the main sources of random error in the Hubble constant as deduced by comparing the X-ray and Sunyaev-Zel’dovich effect properties of the cluster.
The XMM-Newton-derived emission measure within 1.5 arcmin of the centre, , from the weighted average of the MOS and pn values, implies an integrated cluster emission measure of
| (1) |
if the fraction of the emission contained within a 1.5-arcmin radius cylinder is extrapolated to the full cluster using the best-fit radial profile parameters. This emission measure is related to the angular diameter distance of the cluster, , and the central electron density, , by
| (2) |
if the XMM-Newton-derived model is used to describe the overall structure of the cluster, and so the X-ray data provide a measurement of . The symbol in equation (2) is the electron/proton ratio, . The emission measure (1) is less than half the value given by Hughes & Birkinshaw (1998b), because of an error in the way that plasma thermal emission normalizations were reported by XSPEC. Since the emission measure was not used in the calculation of the cluster distance in the Hughes & Birkinshaw paper, however, the conclusions about the cluster distance there are unchanged by this error.
The model can also be used to calculate the central Sunyaev-Zel’dovich effect for the cluster,
| (3) |
where is the thermodynamic temperature of the microwave background radiation and is the Thompson scattering cross-section.
The central Sunyaev-Zel’dovich effect of CL 001616 is found by fitting a one-dimensional profile (Hughes & Birkinshaw 1998b) or a two-dimensional map (Reese et al. 2000; Grainge et al. 2002) of the effect. Using slightly different models for the cluster atmosphere, values , , and were found in these investigations. We reanalysed the Hughes & Birkinshaw (1998b) data using the -model parameters based on our XMM-Newton data, and scaled the interferometric data (which are relatively insensitive to the -model parameters along degeneracy lines in the [, ] plane) to these same parameters. A weighted combination of all three independent values leads to a central Sunyaev-Zel’dovich effect for CL 001616 of . Via equation (3), this implies a measurement of .
Combining our measurements of and , and using the optical cluster redshift of 0.5481 (Ellingson et al. 1998), we find the angular diameter distance and central electron density of CL 001616 to be
| (4) | |||||
| (5) |
In a CDM cosmology with , , this corresponds to a Hubble constant of (random error only), which is about larger than the values estimated by Hughes & Birkinshaw (1998b), Reese et al. (2000), and Grainge et al. (2002). The change in arises about equally from the increased best-fit gas temperature found in the present XMM-Newton study and the change from a flat matter-dominated cosmology to a flat CDM cosmology.
In addition to the statistical error in equation (4), the distance is subject to systematic errors, the largest of which are 5% calibration uncertainties for the Sunyaev-Zel’dovich effect and X-ray normalization, a 20% uncertainty from possible projection effects, and a 15% uncertainty from substructure within the cluster (Hughes & Birkinshaw 1998b). Overall, therefore, we deduce an angular diameter distance for CL 001616 of , which implies a Hubble constant of . This is consistent with the value of the Hubble constant found in the HST distance-scale project (Mould et al. 2000), but the systematic errors are too large for a useful independent measurement of to result from our distance for CL 001616.
It is interesting to use the X-ray data for CL 001616 to estimate the mass of the cluster within the region well-probed by XMM-Newton. For an isothermal gas in hydrostatic equilibrium in a spherical cluster, the total gravitating mass within a cylinder of radius about the cluster centre is
| (6) |
For , this corresponds to a mass of . This value is consistent with the mass of measured from the gravitational lensing effect of the cluster within the same cylindrical radius (Smail et al. 1997; value converted to our adopted cosmology).
We can compare this total gravitating mass with the gas mass within the same cylindrical radius, based on the central electron density that we measure. The result, indicates that X-ray emitting gas contributes a fraction of the total mass of the cluster in this 248-kpc radius cylinder (for ), or independent of cosmology if we use the cluster distance in equation (4) and the electron density in equation (5).
The measured gas mass fraction is consistent with the value within a radius of 65 arcsec (415 kpc) which is obtained by correcting the result of Grego et al. (2001) to the cosmology that we use and cluster temperature that we measure. Our temperature makes CL 001616’s gas mass fraction more consistent with the average in the Grego et al. sample, and with the averages for the Myers et al. (1997) and Mohr et al. (1999) samples. Since these samples derived the gas mass fraction using different analyses of the available X-ray and/or Sunyaev-Zel’dovich effect data, their agreement about the gas mass fraction and its lack of change with redshift suggests that the assumptions used, notably the lack of small-scale density or thermal structure in the atmospheres, are not seriously in error. Since the baryonic matter content of the X-ray gas dominates that of galaxies in clusters, and (Turner 2002) for the Universe as a whole, it appears that our 248-kpc radius cylinder through CL 001616, and clusters of galaxies in general, are fair samples of the matter content of the Universe. Studies of how the gas mass fraction in clusters varies with redshift are therefore unlikely to provide useful information on cluster evolution, at least at the current level of accuracy of the measurements.
8 Summary
With the EPIC camera of XMM-Newton we have measured the temperature and distribution of the intra-cluster medium of CL 001616 to unprecedented precision. The emission-weighted temperature within 1.5 arcmin of the cluster centre is keV and the abundance is ( uncertainties). The higher best-fit temperature than found in previous work using ASCA (Furuzawa et al. 1998; Hughes & Birkinshaw 1998b) affects the cluster’s position on the temperature-luminosity plane, now moving it into good agreement with the relation for nearby clusters (see figure 7 of Schindler 1999).
Although there is some ellipticity in the plane of the sky, as previously reported based on ROSAT data (Neumann & Böhringer 1997; Hughes & Birkinshaw 1998), we find an acceptable fit of the overall envelope out to 5 arcmin (1.9 Mpc) to a circularly-symmetric model, representative of gas in hydrostatic equilibrium, with , and core radius arcsec (where errors are for two interesting parameters since and are strongly correlated).
While there is no spectral or spatial evidence to suggest a cooling flow in CL 001616, an asymmetric enhancement to the west of the cluster is apparent in the XMM-Newton image. Such an asymmetry was previously reported by Neumann & Böhringer (1997) and interpreted as a merging subcomponent of the cluster. The XMM-Newton data also show a more central asymmetric X-ray structure which may have a harder spectrum than the cluster as a whole, and be evidence of merger activity. A deeper X-ray exposure would be required to probe this in more detail.
The improved spectral and spatial data provided by XMM-Newton have allowed us to reduce the random error on the angular diameter distance of CL 001616 to 11%. The resulting estimate of the value of the Hubble constant, , is in good agreement with the value from the HST distance-scale project (Mould et al. 2001). The largest remaining systematic component of the error in our estimate of the Hubble constant arises from projection and substructure effects, and could be reduced by a factor by applying the technique to a sample of clusters with equally-good X-ray and Sunyaev-Zel’dovich effect data as CL 001616.
The total gravitating mass within a radius of 248 kpc of the cluster centre is in good agreement with that found from gravitational lensing over the same region (Smail et al. 1997), which supports the assumption that the gas in CL 001616 can be treated as isothermal and in hydrostatic equilibrium. The measured gas mass fraction of is in remarkable agreement with that given by the cosmological parameters for the Universe as a whole, suggesting that CL 001616 is a fair sample of the matter content of the Universe.
The cluster CL 001616 is believed to be the dominant member of a supercluster at . The nearest companion cluster and relatively bright companion quasar E 0015+162 (which is of an X-ray luminosity more typical of a local Seyfert galaxy) are both well measured in the XMM-Newton EPIC data. In previous ASCA data the emission from the quasar is confused with that from CL 001616 and so values reported for the quasar based on that observation are unreliable. We find that the spectrum of E 0015+162 fits well a power law absorbed only by the column density of gas through our Galaxy, with a relatively steep power-law photon index of . There is evidence for the detection of an Fe fluorescence line.
XMM-Newton finds that the spectrum of the nearest companion cluster, RX J0018.3+1618, fits a thermal model with keV and abundance times solar, These uncertainties for RX J0018.3+1618 are comparable to those of earlier measurements of CL 001616. Deeper and broader X-ray observations of the supercluster may provide important information on a massive structure at an early phase of its evolution.
Acknowledgements
This work is based on observations obtained with XMM-Newton, an ESA science mission with instruments and contributions directly funded by ESA Member States and the USA (NASA). The observation was made as part of the XMM-Newton Survey Science Centre (SSC) Guaranteed-Time programme. We thank Mike Watson for organizing the SSC and its scientific programme.
References
- [1] Arnaud, M., et al., 2002, A&A, in press (astro-ph/0204306)
- [2] Birkinshaw, M., Gull, S.F., Moffett, A.T., 1981, ApJ, 251, L69
- [3] Connolly, A.J., Szalay, A.S., Koo, D.C., Romer, A.K., Holden, B., Nichol, R.C., Miyaji, T., 1996, ApJ, 473, L67
- [4] Dickey, J.M., Lockman, F.J., 1990, ARA&A, 28, 215
- [5] Dressler, A., Gunn, J.E., 1992, ApJS, 78, 1
- [6] Ellingson, E., Yee, H.K.C., Abraham, R.G., Morris, S.L., Carlberg, R.G., 1998, ApJS, 116, 247
- [7] Furuzawa, A., Tawara, Y., Kunieda, H., Yamashita, K., Sonore, T., Tanaka, Y., Mushotzky, R., 1998, ApJ, 504, 35
- [8] Ghizzardi, S. 2001, ‘In flight calibration of the PSF for the MOS1 and MOS2 cameras’, EPIC-MCT-TN-001, available from http://xmm.vilspa.esa.es
- [9] Grainge, K., Grainger, W.F., Jones, M.E., Kneissl, R., Pooley, G.G., Saunders, R., 2002, MNRAS, 329, 890
- [10] Grego, L., Carlstrom, J.E., Reese, E.D., Holder, G.P., Holzapfel, W.L., Joy, M.K., Mohr, J.J., Patel, S., 2001, ApJ, 552, 2
- [11] Hughes, J.P., Birkinshaw, M., 1998a, ApJ, 497, 645
- [12] Hughes, J.P., Birkinshaw, M., 1998b, ApJ, 501, 1
- [13] Hughes, J.P., Birkinshaw, M., Huchra, J.P., 1995, ApJ, 448, L93
- [14] Kirsch, M.G.F. 2002, presentation to the XMM-Newton sas Workshop on May 7th, 2002, available from http://xmm.vilspa.esa.es
- [15] Koo, D.C., 1981, ApJ, 251, L75
- [16] Kron, R.G., 1980, PhD thesis, University of California, Berkeley
- [17] Lumb, D. 2002, ‘EPIC background files’, XMM-SOC-CAL-TN-0016, available from http://xmm.vilspa.esa.es
- [18] Margon, B., Downes, R.A., Spinrad, H., 1983, Nature, 301, 221
- [19] Mohr, J.J., Mathiesen, B. & Evrard, A.E., 1999, ApJ, 517, 627
- [20] Mould, J.R. et al., 2000, ApJ, 529, 786
- [21] Myers, S.T. et al., 1997, ApJ, 485, 1
- [22] Neumann, D.M., Böhringer, H., 1997, MNRAS, 289, 123.
- [23] Reese, E.D., et al., 2000, ApJ, 533, 38
- [24] Reeves, J.N., Turner, M.J.L., Ohashi, T., Kii, T., 1997, MNRAS, 292, 468
- [25] Saxton, R.D., 2002, ‘A statistical evaluation of the EPIC flux calibration’, XMM-SOC-CAL-TN-0023, available from http://xmm.vilspa.esa.es
- [26] Schindler, S., 1999, A&A, 349, 435
- [27] Smail, I., Ellis, R.S., Fitchett, M.J., Edge, A.C., 1995, MNRAS, 273, 277
- [28] Smail, I. et al., 1997, ApJ, 479, 70
- [29] Stüder, L. et al., 2001, A&A, 365, L18
- [30] Turner, M.J.L. et al., 2001, A&A, 365, L27
- [31] Turner, M.S., 2002, ApJ, 576, L101
- [32] White, S.D.M., Silk, J.I., Henry, J.P., 1981, ApJ, 251, L65