A Point Source Excess in Abell 1185: Intergalactic Globular Clusters?11affiliation: Based on observations with the NASA/ESA Hubble Space Telescope obtained at the Space Telescope Science Institute, which is operated by the Association of Universities for Research in Astronomy, Inc., under NASA contract NAS 5-26555 22affiliation: Based in part on data obtained at the W. M. Keck Observatory, which is operated as a scientific partnership among the California Institute of Technology, the University of California, and NASA, and was made possible by the generous financial support of the W. M. Keck Foundation.
Abstract
Deep imaging with WFPC2 and the Hubble Space Telescope has been used to search for a population of intergalactic globular clusters (GCs) belonging to Abell 1185, a richness class I cluster at km s-1. The field is noteworthy in that contains no bright galaxies and yet is centered on the peak of the cluster’s X-ray surface brightness distribution. We detect a total of 99 point sources in this field to a limiting magnitude of . An identical analysis of the Hubble Deep Field North, which serves as our control field, reveals a total of 12 objects in the same magnitude range. We discuss possible explanations for this discrepancy, and conclude that the point source excess is likely due to the presence of GCs within A1185. The number and spatial distribution of these GCs are consistent with their being intergalactic in nature, although we cannot rule out the possibility that some of the GCs may be associated with neighboring bright galaxies. Deeper imaging with the Advanced Camera for Surveys may resolve this ambiguity.
1 Introduction
Although most of the stars residing in galaxy clusters are contained within distinct galaxies, it has been known since the study of Zwicky (1951) that clusters often have diffuse stellar components that are intergalactic in nature. The existence of this low surface brightness starlight has been firmly established by numerous subsequent studies ( Thuan & Kormendy 1977; Melnick, White & Hoessel 1977; Vílchez-Gómez, Pelló & Sanahuja 1994; Bernstein 1995) but, due to the difficulties inherent in the analysis of extended, low surface brightness features, there remains a surprising level of disagreement on its basic properties including spatial distribution, luminosity and color (see the excellent review in Durrell 2002).
Our ability to characterize the properties of this intergalactic stellar component has improved dramatically in recent years, thanks in large part to advances in instrumentation and to the targetted analysis of tracer populations such as individual red giant branch stars (Ferguson, Tanvir & von Hippel 1998; Durrell 2002), planetary nebulae (Theuns & Warren 1997; Méndez 1997 Feldmeier, Ciardullo & Jacoby 1998; Feldmeier 2002; Okamura 2002), type Ia supernovae (Gal-Yam 2002) and even HII regions (Gerhard 2002). These studies typically find the intergalactic component to comprise 10 – 20% of the total cluster luminosity.
Globular clusters (GCs) represent an additional, and potentially powerful, tracer of this intergalactic component. Indeed, the possibility that galaxy clusters may contain a population of intergalactic GCs (IGCs) has been considered many times (van den Bergh 1958; Muzzio, Martínez & Rabolli 1984; White 1987; West 1995). Such an IGC population might either form in situ, as suggested by West (1993) and Cen (2001), or arise through the disruption or tidal stripping of cluster galaxies. Ample observational evidence shows that these latter processes must play a role in the evolution of galaxy clusters ( Weil, Bland-Hawthorn, & Malin 1997; Gregg & West 1998), as predicted by numerical simulations of cluster evolution (see, , Dubinski 1999 and references therein).
If, as suggested by the above studies, 10 – 20% of the total stellar luminosity in clusters takes the form of a diffuse intergalactic component, then it is possible to estimate the total number of IGCs expected within a given cluster. Early-type galaxies in rich cluster environments have GC specific frequencies (Harris & van den Bergh 1981) of (Harris 1991). A cluster such as Virgo, with a total luminosity of inside a radius of (Sandage, Binggeli & Tammann 1985)111For an adopted Virgo distance of 16 Mpc (Ferrarese 1996) should then contain GCs associated with its intergalactic component.
However, the unambiguous detection of IGCs has proven difficult, with conflicting claims on whether or not such IGCs might already have been detected in nearby clusters ( West 1995; Harris, Harris & McLaughlin 1998; Côté 2001; Hilker 2001; Marín-Franch & Aparicio 2002). Much of the confusion in this debate stems from the fact that, if IGCs follow the same distribution within a given cluster as the other baryonic components ( cluster galaxies and X-ray emitting gas), they should be most apparent at, or near, the dynamical center of the cluster. Since most galaxy clusters have a giant elliptical galaxy in close projection to their center, the direct detection of IGCs has been hampered by the difficulties involved in disentangling the hypothesized population of intergalactic GCs from those intrinsic to the central galaxy.
The rich galaxy cluster Abell 1185 is peculiar in this respect as its brightest cluster galaxy is offset by 3′, or about 120 kpc, from the centroid of its X-ray gas distribution (Mahdavi 1996). Assuming that the X-ray centroid marks the dynamical center of the cluster mass distribution, and is not the result of an ongoing merger, then the detection of IGCs in Abell 1185 promises to be more straightforward than in most clusters.
In this paper, we present deep HST observations of a field centered on the peak of the X-ray distribution of A1185. These observations were designed to test the IGC hypothesis by searching for the expected point source excess compared to a blank field. As shown below, the observations, which were designed to sample the brightest part of the GC luminosity function at the distance of A1185, do indeed contain a point source excess that starts at the expected magnitude for an old GC population.
2 Observations and Analysis
We used WFPC2 on HST to obtain F814W () imaging of A1185 as part of program GO-8164. The total exposure time was 13000 s, divided equally among ten, dithered images. The raw data were processed with the standard STScI pipeline using the best available calibration files. As a comparison field, we used a subset of the Hubble Deep Field North (HDF-N) observations (Williams 1996), chosen to have a total exposure time identical to that of the A1185 field. Given the enhanced noise and smaller field of view of the PC chip compared to the WF chips, we limit our analysis to the latter.
Cosmic ray masks and the shifts required to register the images were obtained using the DITHER package in IRAF.222IRAF is distributed by the National Optical Astronomy Observatories, which are operated by the Association of Universities for Research in Astronomy, Inc., under cooperative agreement with the National Science Foundation. The images were combined by applying integer shifts and averaging to produce the final images. SExtractor (Bertin & Arnouts 1996) was used to detect and classify the sources present on the field, setting the detection threshold to 5 connected pixels having counts above the local background. The FWHM of point sources, required to properly classify the detections, was chosen on the basis of artificial star tests (see below) to be 016.
To carry out profile-fitting photometry, and to aid in setting the parameters for SExtractor, we constructed point spread functions (PSFs) for our frames as follows. We used DAOPHOT (Stetson 1987) to create artificial WFPC2 frames containing 121 stars positioned in a 1111 grid on the image. PSFs for the F814W filter were kindly provided by P.B. Stetson. Each artificial frame was then shifted, creating a series of images that had the same dither pattern as the actual images for both A1185 and HDF-N. Each set of images was combined into a final frame using the same procedures that were used for the actual observations. The final images created in this way thus contain point sources constructed from the single-frame PSF but have been subjected to the same DITHER process as the actual data. DAOPHOT was used to determine PSFs which vary quadratically with position in the frames for both the A1185 and HDF-N frames.
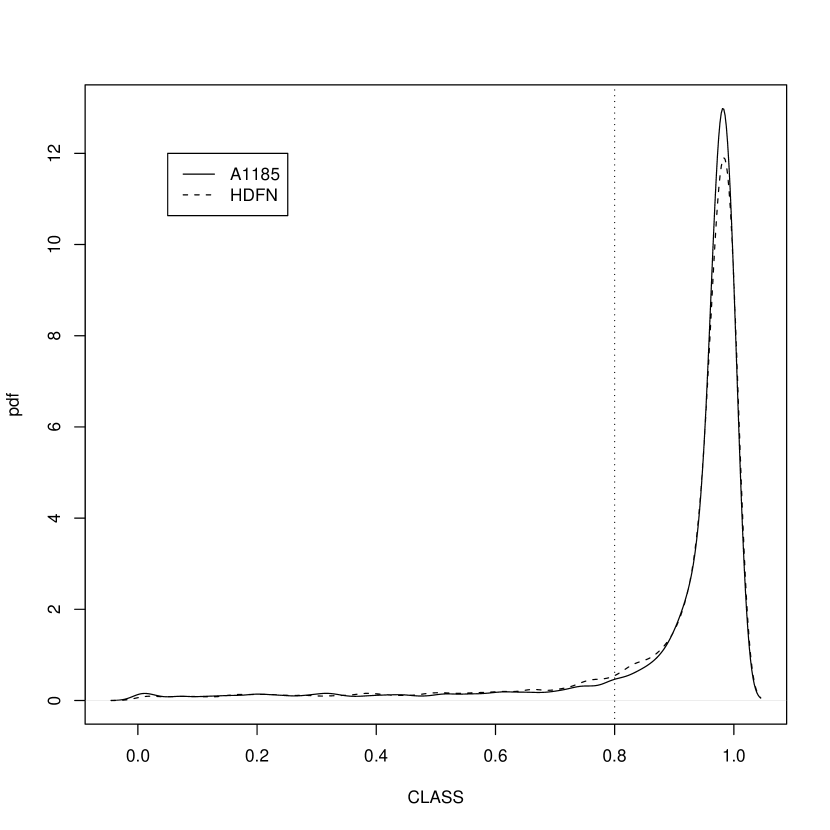
SExtractor assigns each detected object a classification parameter, CLASS, which ranges from 0 for galaxies to 1 for point sources. CLASS is obtained using a neural network trained on simulated images (for details see Bertin & Arnouts 1996). We consider point source candidates to have CLASS . An optimized value for the FWHM parameter was determined by carrying out artificial star tests on the A1185 and HDF-N images, adding 25 stars at a time (so as not to alter the crowding conditions of the frame) until a total of stars were added to each chip. The FWHM quoted above was found to be the minimum value that ensures that the bulk of the artificial stars brighter than our detection limit are classified correctly as point sources.
Figure 1 shows the distribution of CLASS parameters for artificial stars with mag recovered from the A1185 and HDF-N fields. The majority (85%) of these objects have CLASS . The fraction of misclassified artificial stars depends sensitively on the magnitude cutoff, falling to 8% for and 5% for . Based on these artificial star tests, we find the completeness level lies at mag for A1185 and mag for HDF-N. As Figure 1 makes clear, the distributions for the two fields are similar, as is necessary if we are to compare directly the counts for the two fields.
PSF-fitting photometry was then carried out with DAOPHOT, taking the sky from an annulus with inner and outer radii of 5 and 10 pixels. Instrumental magnitudes were transformed into the VEGAMAG system using zero-points taken from the HST WFPC2 Data Handbook (Baggett 2002). A correction for foreground extinction was performed using the reddening curves of Cardelli, Clayton & Mathis (1989), with the value of taken from the DIRBE maps of Schlegel, Finkbeiner & Davis (1998). A final correction of mag was applied to correct from a PSF radius of to one of infinite aperture (Holtzman 1995).
Those objects having a DAOPHOT statistic333 is a robust estimate of the ratio of the observed to expected scatter about the model profile (Stetson & Harris 1988). greater than were discarded and any point sources brighter than above the expected turnover magnitude of the globular cluster luminosity function at the distance of A1185 were omitted from the analysis. The threshold on was determined on the basis of the artificial star tests. We assumed mag and mag for the absolute magnitude of the turnover and the dispersion of the Gaussian representation of the GC luminosity function, respectively (Harris 2002). The distance to A1185 is calculated directly from its redshift, , assuming km s-1 Mpc-1 (Freedman 2001). This procedure results in the rejection of all objects brighter than mag and eliminates objects in the A1185 field and in HDF-N. For comparison, galactic stars with are predicted by the Bahcall-Soneira Galaxy model (Bahcall & Soneira 1980; Bahcall 1986) in these fields
As a final check on the point-source nature of the remaining detections, we examined the radial profile of the difference between the observed profile of each source with the PSF profile expected at that position in the field. While a trend between the median difference and radius might then be expected if the sources were extended no such trend was detected, supporting the SExtractor classifications.
3 The Nature of the Excess
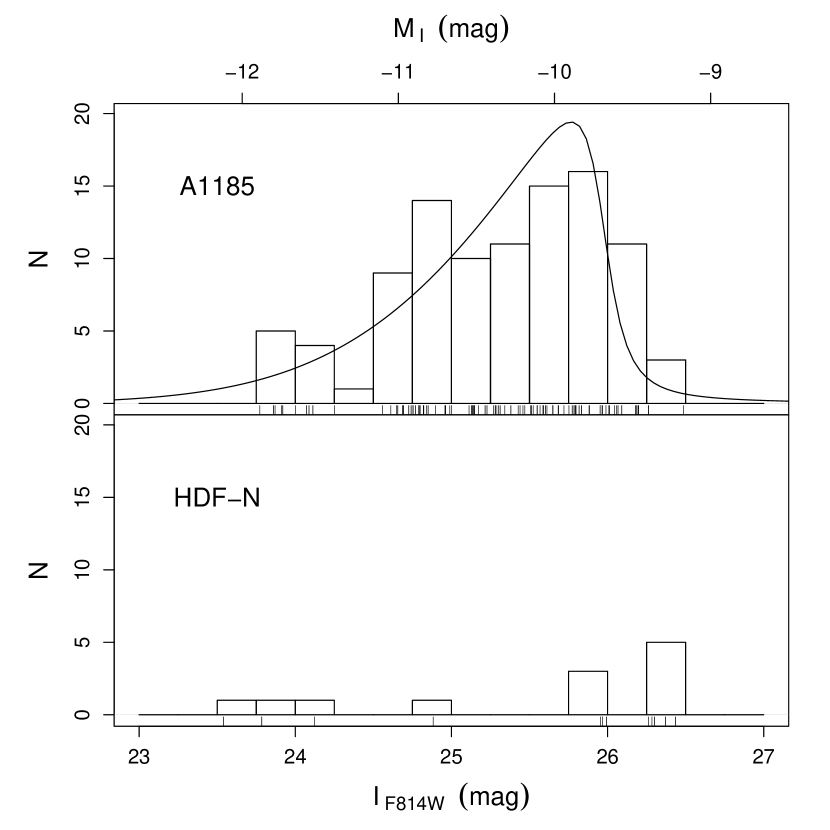
Our final catalog consists of 99 point sources in the A1185 field. By contrast, we find 12 sources in the HDF-N field, which serves as our control. The luminosity functions for both fields are shown in Figure 2. For A1185 we also show the expected luminosity function for GCs at the distance of A1185, multiplied by the completeness function and normalized to the observed number of sources. Our counts for the HDF-N field are in good agreement with those of Elson, Santiago & Gilmore (1996) who find 14 point sources in the same magnitude interval. In what follows, we examine a number of possible explanations for this point source excess.
3.1 Galactic Field Stars
We first consider the possibility that the A1185 field contains a larger number Galactic field stars than does the HDF-N field. However, this explanation appears unlikely given the size of the excess ( nearly an order of magnitude) and the roughly similar Galactic latitudes of the two fields: = 678 for A1185 and = 548 for the HDF-N field. Indeed, according to the Bahcall-Soneira Galaxy model (Bahcall & Soneira 1980; Bahcall 1986), both fields are predicted to contain only 4-6 stars in the magnitude range . We conclude that Galactic field stars are unlikely to be the origin of the observed excess.
3.2 Background Galaxy Cluster
Could the excess be due to a distant background galaxy cluster which happens to fall in the A1185 field? The low surface density of high-redshift clusters (e.g. Postman 2002) suggests that this explanation is unlikely. More importantly, we expect almost all background giant ellipticals to be resolved on our WF frames: i.e., the angular diameter distance turns around at in such a way that, for , 1′′ corresponds to 6 kpc. For instance, Lyman break galaxies at , though physically compact, are still clearly resolved in deep WFPC2 images, with half-light radii 02 (Steidel 1996). A definitive test should be possible with multi-color data (and particularly IR colors) for the point source population in A1185.
3.3 Nuclei of dE,N Galaxies
A third possibility is that our point source catalog includes a population of dE,N galaxies. At the distance of A1185, the bright nuclei of such galaxies would be unresolved. As Binggeli & Cameron (1991) have shown, the nuclei of dE,N galaxies mimic the bright end of the GC luminosity function in the Virgo cluster, so it is conceivable that our sample may include some dE,N galaxies, particularly since our WFPC2 field is located near the center of A1185 where the galaxy surface density is expected to be high. There are two separate issues that must be addressed to test the plausibility of this explanation: (1) the probability that dE,N galaxies would be classified incorrectly by SExtractor as point sources; and (2) overall number of dE,N galaxies expected in our A1185 field. This latter point will be examined in detail below.
To address the first issue, we carried out simulations in which artificial dE,N galaxies were added to our frames. These frames were then run through the same reduction procedures as the actual observations and, at the end of each run, the classifications returned by SExtractor were recorded. The dE,N galaxies were simulated using the data presented in Table 1 of Lotz (2001) which gives total magnitudes, exponential length scales, nuclei -band magnitudes and colors for a sample of 27 dE,N galaxies in the Virgo and Fornax clusters that have been observed with HST. To simulate the dE,N galaxies, we first used DAOPHOT to add point sources with the tabulated magnitudes after shifting to the distance of A1185. The task MKOBJECTS in IRAF was then used to add an exponential disk having the appropriate exponential scale, ellipticity and total magnitude (minus the contribution of the nucleus). The colors of the exponential disks were taken to be and ; these relations were obtained by combining a [Fe/H]– relation for dwarf galaxies (Côté 2000) with the color–metallicity relations presented in Barmby (2000). Each galaxy in the Lotz (2001) sample was simulated times per WF chip, with the galaxies being simulated in groups of so as not to overcrowd the fields. These simulations revealed that all dE,N galaxies were classified correctly as non-stellar in all trials. We therefore conclude that the nuclei of dE,N galaxies cannot be the origin of the point source excess in A1185.
3.4 GCs associated with Dwarf Galaxies
A related possibility is that the point sources detected in the A1185 field represent bona fide GCs, but ones that are associated with dwarf galaxies that may be present in A1185. We examine this possibility by calculating the expected number of dE and dE,N galaxies in the A1185 field. Since the velocity dispersions of Virgo and A1185 are similar (Binggeli, Tammann & Sandage 1987; Mahdavi 1996), their dwarf populations can be compared directly. Based on the Virgo dE+dE,N luminosity function published by Sandage, Binggeli & Tammann (1985), expect dE and dE,N galaxies in Virgo out to a distance of . We have adopted a cutoff at the faint end of the luminosity function of as there are no known GC systems belonging to dwarfs fainter than that. Given that A1185 is times more distant than Virgo, and assuming that the surface density of dwarfs in Virgo has the approximate form with (Ferguson & Sandage 1989) 444This value of is appropriate for dE + dE,N fainter than . Brighter dwarfs exhibit in general larger and this would drive down the estimated number of dwarfs in our field., the expected dE surface density at the center of A1185 is roughly 5500 deg-2. Thus, we expect our WFPC2 field to contain dE and dE,N galaxies. Given that these galaxies would typically contain only clusters each ( Lotz 2001), and that our photometry samples only the brightest 16% of the GC luminosity function at the distance of A1185, we expect only 8 point sources to be GCs associated with dwarf galaxies in A1185.
3.5 Faint dE galaxies
We have also explored the possibility that the point source catalog in A1185 has been contaminated by faint dE galaxies with small exponential scale-lengths. This possibility has been investigated by adding simulated dE galaxies to the WFPC2 frames, with the galaxies modeled as pure exponential disks having scale-lengths of kpc. This choice of scale-length corresponds to the low-end of the values found for Local Group dwarfs (Mateo 1998). It is these highly concentrated dwarfs that are cause for the greatest concern, as they are the ones most likely to be misclassified at the distance of A1185. We added 150 artificial dE galaxies having absolute magnitudes and (1200 in total) to each WF chip and analyzed the images in the same way as the actual data. Only for and were any dwarfs misclassified, and then only in 1% of the cases. Combining this result with the fact that we expect 8 dE galaxies in this magnitude range (determined from an extrapolation of the fitted Schechter function for the dE population in Virgo; Sandage 1985), we find that the number of compact dE galaxies in our point source catalog is completely negligible.
3.6 A1185 Globular Clusters
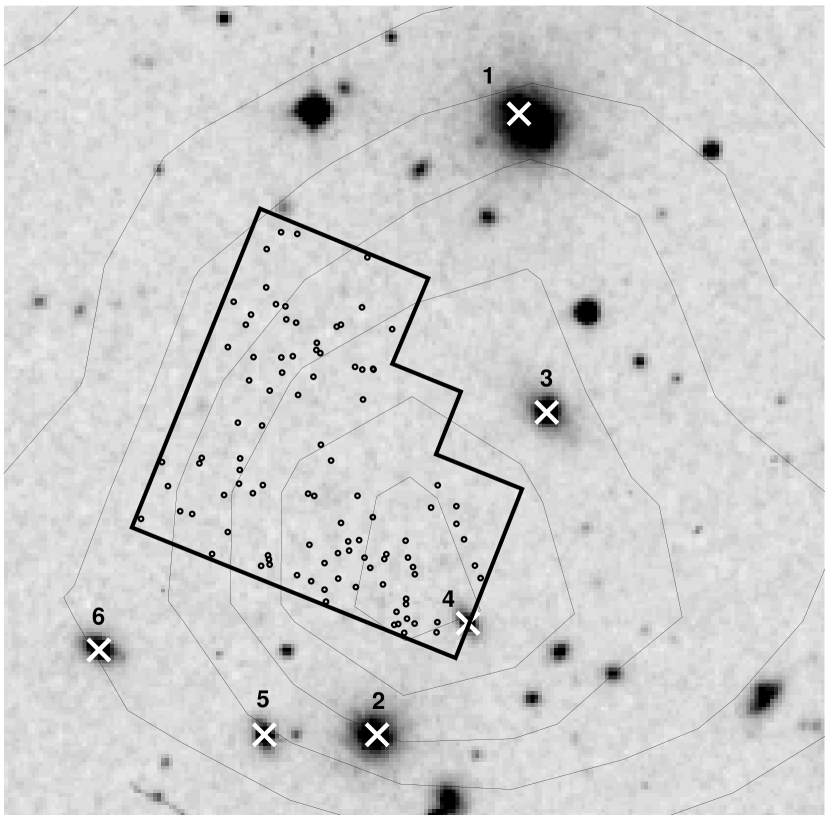
The calculations above suggest that the number of dwarf galaxies and Galactic field stars expected in the A1185 field fall far short of that needed to explain the point source excess. We conclude that the point source excess is probably the result of bona fide GCs in A1185, but is it plausible that the sources are GC associated with nearby ellipiticals rather with the cluster as a whole? As Figure 3 shows, a few of the sources are close in projection to neighboring galaxies, but the bulk of the population is not obviously associated with galaxies. To examine this issue more quantitatively, we consider the GC systems of the six bright galaxies that are nearest to the WFPC2 field: NGC 3550 (BCG), NGC 3552, CGCG 155-081, 2MASSXi J1110398+284224, MCG+05-27-004 NED01 and MCG+05-27-004 NED02. These six objects are marked by crosses in Figure 3, and labelled according to the above order.
To estimate the number of GCs that are associated with these galaxies and fall in the WFPC2 field, it is first necessary to assume a radial density profile for their GC systems. On theoretical grounds, the profiles of non-central galaxies are expected to be tidally truncated by the mean cluster field ( Merritt 1984), but precise values for the truncation radii of cluster galaxies have not been determined observationally, nor has the process been probed adequately in numerical simulations. As a first estimate, we use the theoretical predictions for the tidal radius put forward in Merritt (1984), assuming in his equation (6a). The cluster velocity dispersion is taken to be km s-1 (Mahdavi 1996) and the velocity dispersion for each galaxy is estimated using the Faber-Jackson relation (Faber & Jackson 1976). For the radial density profiles inside the tidal radius, we use power laws of the form with given by
| (1) |
(Kaisler 1996). Absolute magnitudes, , were measured for the A1185 galaxies by running SExtractor on a s -band exposure taken with the Low-Resolution Imaging Spectrometer (Oke 1995) at the W.M Keck Observatory on 19 March, 1999. To estimate the total number of GCs belonging to each galaxy, we assume a constant GC specific frequency of (Harris 1991). Integrating the various GC density profiles over the WF chips, and taking into account the fact that we observe only the brightest of the GC luminosity function, we find a total contribution of GCs from the GC systems of these galaxies.555 The galaxy 2MASSXi J1110398+284224 lies partly on the WF4, so we neglect any GCs falling within 10′′ of its center since these GCs would go undetected in our reduction pipeline. Of the 15 expected GCs, would be on WF4. Although this detector is indeed observed to contain largest number of point sources (39), the factor of six discrepancy between the observed and predicted counts suggest that the point source excess is unlikely to be due to GCs associated with neighboring galaxies, if the galaxies are tidally truncated as described above.
However, this estimate depends rather sensitively on the assumed recipe for tidal limitation. We have therefore calculated the expected contribution when this effect is neglected entirely. Since we are now interested in the spatial distribution of GCs at very large projected radii, the power-law representations of the radial density is inadequate (Rhode & Zepf 2000). We instead assume that all galaxies have GC surface density profiles similar to the profile of M49. Beyond kpc, the profiles are set to zero, consistent with the results of Rhode & Zepf (2000). This is a rather conservative approach, as the fainter galaxies will certainly have less extended profiles (see Eq. 1). Following the same procedure as described above, we then find an expected contribution of GCs, still lower than the observed number of point sources, but now within a factor of 50% of the actual excess. We caution, however, that the previous estimate is probably more realistic, as the cluster galaxies have almost certainly been tidally truncated at some level. Indeed, dynamical modeling of the GC system of M87 — the central elliptical in the Virgo cluster — has shown the velocity dispersion profile of its GC system to rise beyond kpc, as expected if the GCs are orbiting in the potential well defined by both the galaxy and its parent cluster (Côté 2001). At a projected distance of 100 kpc, the gravitational potential in which the GCs orbit is dominated not by the central galaxy, but by the cluster itself.
Could a population of IGCs be responsible for the observed point source excess? West (1995) proposed a phenomenological model in which the high specific frequencies of some centrally dominant galaxies ( Harris 1991) are explained by the presence of a population of IGCs. In this scenario, putative populations of IGCs provide an “excess” GC population that elevates the observed specific frequencies above a universal value of . Following West (1995) and Blakeslee (1997), we assume that the surface density of IGCs is given by
where where and are the cluster’s core radius and X-ray temperature, respectively. To find the constant of proportionality in this relation, we performed a linear fit to the data presented in Figure 13 of Blakeslee, Tonry & Metzger (1997). Taking into account that the area of their detector was 22 arcmin2, the predicted IGC surface density is
Using a value of keV for A1185 (Jones & Forman 1999) and recalling that we are sensitive to only the brightest of the GC luminosity function, we expect our WFPC2 field to contain IGCs. The predicted number of IGCs is thus of the right order needed to explain the point source excess in A1185.
4 Conclusions
Having considered the expected contributions of many different sources, it seems clear that the observed point source excess is best explained by a population of GCs in A1185. Whether these GCs are intergalactic in nature, or whether they are associated with neighboring galaxies, is an open question. The difficulty in deciding between these scenarios lies in the unknown extent to which the cluster mean field has imposed a tidal limitation on the individual cluster galaxies. If tidal truncation has been less effective than assumed in the above analysis, then many, and perhaps most, of the observed point sources observed might be explained by GCs associated with individual galaxies. On the other hand, if the cluster galaxies have been tidally limited as prescribed in Merritt (1984), the IGC hypothesis emerges as the most plausible explanation for the observed excess.
Based on the evidence above, it seems very likely that the point sources observed in our WFCP2 field are bonafide GCs residing in A1185. Nevertheless, this assertion can be tested with deeper imaging of this field. Any population of GCs, whether or not it is intergalactic in nature, should be characterized a near-Gaussian luminosity function. At the distance of A1185, the GC luminosity function is expected to show a turnover at , which is well within the imaging capabilities of HST and the Advanced Camera for Surveys. While the luminosity function alone would would not allow us to distinguish between GCs belonging to individuals galaxies and those associated with the cluster as a whole, it may be possible to discriminate between these alternatives by examining the spatial distribution of an expanded sample of sources. Additional clues to the nature of these GCs, including ages and metallicities, will be possible once optical and infrared colors are in hand.
References
- Baggett (2002) Baggett, S., 2002, in HST WFPC2 Data Handbook, v. 4.0, ed. B. Mobasher, Baltimore, STScI
- Bahcall & Soneira (1980) Bahcall, J.N., & Soneira, R.M. 1980, ApJS, 44, 73
- Bahcall (1986) Bahcall, J.N. 1986, ARA&A, 24, 577
- Barmby et al. (2000) Barmby, P., Huchra, J.P., Brodie, J.P., Forbes, D.A., Schroder, L.L., & Grillmair, C.J. 2000, AJ, 119, 727
- Bertin & Arnouts (1996) Bertin, E. & Arnouts, S. 1996, A&AS, 117, 393
- Bernstein (1995) Bernstein, G.M., Nichol, R.C., Tyson, J.A., Ulmer, M.P., & Wittman, D. 1995, AJ, 110, 1507
- Binggeli, Tammann & Sandage (1987) Binggeli, B., Tammann, G.A., & Sandage, A. 1987, AJ, 94, 251
- Binggeli & Cameron (1991) Binggeli, B. & Cameron, L.M. 1991, A&A, 252, 27
- Blakeslee, Tonry & Metzger (1997) Blakeslee, J.P., Tonry, J.L., & Metzger, M.R. 1997, AJ, 114, 482
- Cardelli, Clayton & Mathis (1989) Cardelli, J.A., Clayton, G.C., & Mathis, J.S. 1989, ApJ, 345, 245
- Cen (2001) Cen, R. 2001, ApJ, 560, 592
- Côté et al. (2000) Côté, P., Marzke, R.O., West, M.J., & Minniti, D. 2000, ApJ, 533, 869
- Côté (2001) Côté, P., McLaughlin, D.E., Hanes, D.A., Bridges, T.J., Geisler, D., Merritt, D., Hesser, J.E., Harris, G.L.H., & Lee, M.G. 2001, ApJ, 559, 828
- Durrell (2002) Durrell, P.R., Ciardullo, R., Feldmeier, J.J.; Jacoby, G.H., & Sigurdsson, S. 2002, ApJ, 570, 119
- Dubinski (1999) Dubinski, J. 1999, in ASP Conf. Ser. 182, Galaxy Dynamics, ed. D.R. Merritt, J.A. Sellwood, & M. Valluri (San Francisco: ASP), 491
- Elson, Santiago & Gillmore (1996) Elson, R.A.W., Santiago, B.X., & Gilmore G.F., New Astronomy, 1, 1
- Fabian, Nulsen & Canizares (1984) Fabian, A.C., Nulsen, P.E.J., & Canizares, C.R. 1984, Nature, 310, 733
- Feldmeier, Ciardullo & Jacoby (1998) Feldmeier, J.J., Ciardullo, R., & Jacoby, G.H. 1998, ApJ, 503, 109
- Feldmeier (2002) Feldmeier, J.J., Mihos, J.C., Morrison, H.L., Rodney, S.A., & Harding, P. 2002, ApJ, 575, 779
- Ferguson & Sandage (1989) Ferguson, H.C., & Sandage, A. 1989, ApJ, 346, L53
- Ferguson, Tanvir & von Hippel (1998) Ferguson, H.C., Tanvir, N.R., & von Hippel, T. 1998, Nature, 391, 461
- Ferrarese (1996) Ferrarese, L., 1996, ApJ, 464, 568
- Fleming (1995) Fleming, D.E.B., Harris, W.E., Pritchet, C.J., & Hanes, D.A. 1995, AJ, 109, 1044
- Freedman (2001) Freedman, W.L. 2001, ApJ, 553, 47
- Gal-Yam (2002) Gal-Yam, A., Maoz, D., Guhathakurta, P., & Filippenko, A.V. 2002, AJ, in press (astro-ph/0211334).
- Gerhard (2002) Gerhard, O., Arnaboldi, M., Freeman, K.C., & Okamura, S. 2002, ApJ, in press (astro-ph/0211341)
- Gregg & West (1998) Gregg, M.D., & West, M.J. 1998, Nature, 396, 549
- Harris & van den Bergh (1981) Harris, W.E., & van den Bergh, S. 1981, AJ, 86, 1627
- Harris (1986) Harris, W.E. 1986, AJ, 91, 822
- Harris (1991) Harris, W.E. 1991, ARA&A, 29, 543
- Harris (2001) Harris, W.E. in Star Clusters, edited by L. Labhardt and B. Binggeli (Berlin: Springer), 223
- Harris, Harris, & McLaughlin (1998) Harris, W.E., Harris, G.L.H., & McLaughlin, D.E. 1998, AJ, 115, 1801
- Hilker (2001) Hilker, M. 2001, preprint (astro-ph/0210466)
- Holtzman (1995) Holtzman, J.A., Burrows, C.J., Casertano, S., Hester, J.J., Trauger, J.T., Watson, A.M., & Worthey, G. 1995, PASP, 107, 1065
- Jones & Forman (1999) Jones, C., & Forman, W. 1999, ApJ, 511, 65
- Kaisler (1996) Kaisler, D., Harris, W.E., Crabtree, D.R., & Richer, H.B. 1996, AJ, 111, 2224
- Lotz (2001) Lotz, J.M., Telford, R., Ferguson, H.C., Miller, B.W., Stiavelli, M., & Mack, J. 2001, ApJ, 552, 572
- Mahdavi (1996) Mahdavi, A., Geller, M.J., Fabricant, D.G., Kurtz, M.J., Postman, M, & McLean, B, 1996, AJ, 111, 64
- Marín-Franch & Aparicio (2002) Marín-Franch, A. & Aparicio, A. 2002, ApJ, 568, 174
- Mateo (1998) Mateo, M. 1998, ARA&A, 36, 435
- McLaughlin & Pudritz (1996) McLaughlin, D.E., & Pudritz, R.E. 1996, ApJ, 469, 194
- Melnick, White, & Hoessel (1977) Melnick, J., White, S.D.M., & Hoessel, J. 1977, MNRAS, 180, 207
- Merritt (1984) Merritt, D. 1984, ApJ, 276, 26
- Méndez (1998) Méndez, R.H., Guerrero, M.A., Freeman, K.C., Arnaboldi, M., Kudritzki, R.P., Hopp, U., Capaccioli, M., & Ford, H. 1997, ApJ, 491, L23
- Muzzio, Martínez & Rabolli (1984) Muzzio, J.C., Martínez, R.E., & Rabolli, M. 1984, ApJ, 285, 7
- Okamura (2002) Okamura, S., 2002, PASJ, in press (astro-ph/0211352)
- Oke (1995) Oke, J.B., Cohen, J.G., Carr, M., Cromer, J., Dingizian, A., Harris, F.H., Labrecque, S., Lucinio, R., Schaal, W., Epps, H., & Miller, J. 1995, PASP, 107, 375
- Postman (2002) Postman, M., Lauer, T.R., Oegerle, W., & Donahue, M. 2002, ApJ, 579, 93
- Rhode & Zepf (2001) Rhode, K.L., & Zepf, S.E. 2001, AJ, 121, 210
- Sandage, Binggeli & Tammann (1985) Sandage, A., Binggeli, B., & Tammann, G.A. 1985, AJ, 90, 1759
- Schlegel, Finkbeiner & Davis (1998) Schlegel, D.J., Finkbeiner, D.P., & Davis, M. 1998, ApJ, 500, 525
- Steidel . (1996) Steidel, C.C., Giavalisco, M., Dickinson, M., & Adelberger, K. 1996, AJ, 112, 352
- Stetson (1987) Stetson, P.B. 1987, PASP, 99, 191
- Stetson & Harris (1998) Stetson, P.B., & Harris, W.E. 1988, AJ, 96, 909
- Theuns & Warren (1997) Theuns, T., & Warren, S.J. 1997, MNRAS, 284, L11
- Thaun & Kormendy (1977) Thuan, T.X., & Kormendy, J. 1977, PASP, 89, 466
- van den Bergh (1958) van den Bergh, S. 1958, Obs., 78, 85
- van den Bergh (1984) van den Bergh, S. 1984, PASP, 96, 236
- Vílchez-Gómez, Pelló & Sanahuja (1994) Vílchez-Gómez, R., Pelló, R., & Sanahuja, B. 1994, A&A, 283, 37
- Weil, Bland-Hawthorn, & Malin (1997) Weil, M.L., Bland-Hawthorn, J., & Malin, D.F. 1997, ApJ, 490, 664
- West (1993) West, M.J. 1993, MNRAS, 265, 755
- West (1995) West, M.J., Côté, P., Jones, C., Forman, W., & Marzke, R.O. 1995, ApJ, 453, L77
- White (1987) White, R.E. 1987, MNRAS, 227, 185
- Williams (1996) Williams, R.E. 1996, AJ,112, 1335
- Zwicky (1951) Zwicky, F. 1951, PASP, 63, 61