11email: ciroi@pd.astro.it, piraf@pd.astro.it 22institutetext: School of Physics and Astronomy, Tel-Aviv University, Ramat-Aviv, Tel-Aviv, 69978 Israel
22email: contini@post.tau.ac.il 33institutetext: Astrophysikalisches Institut Potsdam, An der Sternwarte 16, D-14482 Potsdam, Germany
33email: gmrichter@aip.de
2-D spectroscopy and modeling of the biconical ionized gas in NGC 4388††thanks: Based on observations at SAO 6-m telescope (Russia)
We present recent results from spectroscopic data and modeling of the biconical ionized gas in the Seyfert-2 galaxy NGC 4388. A field of kpc centered on the nucleus has been observed by means of the modern technique of integral field spectroscopy. The analysis of more than two hundred spectra allowed to study the physical characteristics of the gas in the surroundings of the active nucleus. The South-West ionization cone, revealed by the [O III] 5007/H excitation map, shows high emission line ratios not completely supported by simple photoionization. Composite models which account for the combined effects of photoionization and shock show that such high [O III]/H line ratios are emitted by low density (=30 ) gas inside large (D1 pc) shocked clouds (=100 ) reached by a relatively low flux from the active nucleus. The data of the VEELR in the North-East cone by Yoshida et al. (2002) have been modeled. The results confirm that photoionization is the prevailing mechanism, but nontheless weak shocks are under way between colliding clouds with small (1 pc) sizes and low densities 100 , moving outward at relatively low velocities (=100 ).
Key Words.:
Techniques: spectroscopic – Galaxies: nuclei – Galaxies: Seyfert – Shock Waves – Galaxies: individual: NGC 43881 Introduction
The prevailing picture of an AGN structure, the so-called Unified Model,
provides for a central supermassive Black-Hole (BH), whose gravitational
potential energy is the ultimate source of the AGN luminosity. Matter falling
into the BH loses angular momentum through viscous and turbulent processes in
an accretion disk, resulting into emission of photons in the ultraviolet,
soft-X and hard-X ray wavelength domains (Urry & Padovani (1995)).
According to the Unified Model the central source is surrounded by a dense
obscuring thick torus which is able to restrict the emergent radiation from
the nucleus to a bipolar cone with an opening angle determined by the torus
geometry (Pogge (1989)).
Imaging in optical emission lines shows in some cases high ionization regions
with a conical and/or biconical morphology. These so-called ionization
cones are direct evidence that radiation escapes anisotropically
(Mulchaey et al. (1994)).
In this frame we have carried out an observational campaign to study the
circumnuclear and extranuclear environment of a spectroscopically selected
sample of Seyfert galaxies (Rafanelli et al. (1995)) by means of the integral field
spectroscopy. This technique offers much more advantages than the
traditional long-slit spectroscopy, because it allows us to observe
extended regions of nearby galaxies providing simultaneously recorded
spectral information () along two spatial directions
( and ).
Here we present results from the observations of the Seyfert-2 galaxy
NGC 4388, a nearby (z=0.0084) highly inclined spiral galaxy
( 75°), believed located in the core of the Virgo cluster.
Indeed observed distortions in the outermost optical isophotes are a
clue of the possible interaction between this galaxy and the other members
of the cluster.
The IUE spectra of NGC 4388 revealed the presence of an UV source occulted
from direct view and producing an ionizing continuum with a steep spectral
slope (Ferland & Osterbrock (1986); Kinney et al. (1991); Kinney et al. (1993)).
Narrow-band H +[N II] and [O III] 5007 images pointed
out the presence of emission line regions with highly ionized gas
distributed into two opposite cones: a S-W cone extended to 30″ and a
N-E plume extended up to 50″ above the galactic disk.
Spectroscopic analysis confirmed the photoionization by the central
power-law continuum as the principal excitation mechanism
(Pogge (1988); Petitjean & Durret (1993)).
Kinematic data obtained with Fabry-Perot Interferometer (Veilleux et al. 1999b )
revealed non-rotational blueshifted velocities in the extraplanar gas
northeast of the nucleus, likely produced by a bipolar outflow.
Using deep narrow-band imaging obtained with the Suprime-Cam mounted at the
Subaru Telescope, Yoshida et al. (2002; hereafter YOS02) have recently found a
very large emission line region (VEELR) extended up to 35 kpc northeast
of the nucleus. It consists of
many gas clouds or filaments, part of which (within 12 kpc) are clearly ionized by
the nuclear radiation. They claim that the most plausible origin of this
ionized gas is tidal debris due a past interaction with a gas-rich dwarf
galaxy.
Moreover at radio wavelengths NGC 4388 shows a two sided, asymmetric structure
with a flat spectrum central component, offset by =1.2″
and = 2.6″ from the
apparent optical nucleus, a diffuse blob to the North and an elongated feature
to the South with a compact blob in it (Hummel & Saikia (1991)).
Several radio maps have shown that this feature is clearly associated with the
S-W ionization cone, suggesting the possibility of an interaction
between the radio jet and clouds of the ionized gas (Falcke et al. (1998)).
Such interaction generates shock fronts, which cannot be neglected in the
interpretation of the spectra.
In this paper we investigate the physical conditions in the extended biconical ionized gas of NGC 4388 through the modeling of the optical emission line and continuum spectra observed in different regions. Both the ionizing radiation from the active nucleus and the shock effects are consistently accounted for. In Sect. 2 the observations and modeling of the S-W cone are presented. In Sect. 3 the N-E cone is considered and the VEELR is modeled on the basis of YOS02 data. The continuum SED is discussed in Sect. 4. Concluding remarks follow in Sect. 5.
2 The South-West cone
2.1 Observations and data reduction
NGC 4388 was observed in March 1998 at the 6-m telescope of the Special Astrophysical Observatory (Russia) with the MultiPupil Fiber Spectrograph (MPFS), an integral field unit made by an array of microlenses coupled with a close-packed bundle of optical fibers, which carry the incoming signal to the spectrograph. Each of the 240 elements was covering a region of 1″1″ corresponding to a total field of view of about 2.62.4 kpc (assuming H0 = 75 km s-1 Mpc-1). Two 600 sec exposures were taken using a TK-1024 CCD, which has a pixel size of 24 m, and orienting the largest side of the array at P.A. 34° (Fig. 1). The grating was chosen to give a spectral range of 4400–7100 Å, with a resolution of 10 Å and a dispersion of 5.3 Å/px.
The reduction of the data was carried out by means of a software
package, developed within our group, and running under IRAF111
IRAF is distributed by the National Optical
Astronomy Observatories, which are operated by the Association of Universities
for Research in Astronomy, Inc., under cooperative agreement with the
National Science Foundation environment.
After the usual steps of bias and dark subtraction, all the frames were
cross-correlated, in order to compensate for the shifts between them caused by
mechanical flexions of the instrument. Then a flat field was chosen as
reference image to obtain the geometrical scheme of the spectra arrangement:
the position, width and layout along the dispersion direction of every
spectrum stored in it were defined and the resulting scheme was subsequently
applied to all the images in order to extract for each of them the 240 1-D
spectra. The dispersion solution for wavelength calibration was determined
by fitting the line positions of He-Ne-Ar lamp exposures with low order
Chebyshev polynomial functions.
The sky subtraction was performed by averaging the output of 8 fibers devoted
to the night sky observation and placed at a
distance of 4.5′ from the center of the field of view.
Then the data were flux calibrated by observing the spectrophotometric
standard star HZ 44: all its flat-fielded, wavelength calibrated and sky
subtracted spectra were summed together in order to collect the total incoming
flux, to obtain the function necessary to convert counts in physical units and
to account for the sensitivity response of the system at different wavelengths.
Finally, cosmic rays were removed by combining corresponding spectra of
the two exposures of NGC 4388 and a correction for Galactic extinction
() was applied.
Fig. 3 shows some examples of the reduced
spectra chosen with different signal-to-noise ratio in the field of view.
The positions, widths and fluxes of all the emission lines detectable
3 over the continuum were measured using the IRAF task SPLOT.
In case of close blending like H +[N II] 6548,6583 or
[S II] 6717,6731, better results in performing an interactive
multigaussian fit of the total profile could be obtained by using
the MIDAS package ALICE, whose input parameters (a first estimate of
amplitude, center and sigma of the fitting gaussian) are independently fixable.


2.2 Data analysis
In order to get accurate estimate of line fluxes and ratios it is necessary to take into account that emission lines in galaxies are generally affected, and in some cases even dominated, by the underlying starlight contribution. It is possibile to remove the stellar features by subtracting an absorption-line ”template” galaxy spectrum built by means of spectral synthesis techniques (see e.g. Bonatto et al. (1989)), or directly obtained from the observation of early-type spirals. In our case the second approach was used, chosing a spectrum of a S0 galaxy extracted from our database which best matched the stellar features of most of NGC 4388 spectra, and following the suggestions given by Ho et al. (1993). As a whole, the resulting correction was considered satisfactory (an example is given in Fig. 3). The metallic lines (Mg I 5175, Fe I 5269 and Na I 5892) were almost always canceled out after the subtraction. Only in some cases the stellar features of the template have been strengthened to better match the H absorption, producing an overcorrection of the metallic absorptions. This can happen since stellar populations cannot be omogeneus everywhere in the field of view. The resulting variations of line intensities have been estimated weak (% for H ) in spectra with very bright emission lines, significant (%) in most of the spectra and very important in few spectra (up to 60%).
The emission line fluxes, measured after the starlight contamination removal, were corrected for internal reddening by means of the theoretical Balmer decrement value H /H = 2.86 for Case B recombination at electronic temperature =104 K and assuming the reddening law by Miller & Mathews (1972).
Several images of the galaxy within the field of view were reconstructed at different wavelengths, as for instance the map of the visible continuum at 5500 Å. The position of its maximum intensity is located to the N-W of the observed peak of the emission line maps, which we have decided to assume as position of the photoionization source (hereafter nucleus). We do not confirm the large offset between the location of the radio source with flat spectrum and the visible continuum peak indicated in Hummel & Saikia (1991) and references therein: the radio source, the visible continuum and the emission lines have their maxima intensities close to each other (separation ″). We have discarded the idea to adopt the position of the radio source, which should indicate the real location of the AGN, as nucleus in our field of view since the spatial resolution of our data is only 1 ″/px and an accurate astrometric calibration of the integral field images is very hard to obtain.
The map of the [O III] 5007/H emission line ratios revealed part of the S-W ionization cone (Fig. 4). The cone has the axis at P.A. 200° and an aperture angle of 70° , less than the value measured by Pogge (1988), probably due to our smaller field of view.

The gaseous regions within the ionization cone have been investigated. Their intrinsic FWHM, estimated from the gaussian analysis of the emission lines after having removed the instrumental component (10 Å), range in the interval 200–700 , with a median value of 480 , velocities usually observed in the Narrow Line Regions of Seyfert galaxies. The diagnostic emission line ratios [N II] 6583/H , [O I] 6300/H , [S II] 6716+6731/H and [O III] 5007/H (Veilleux & Osterbrock (1987)), show the typical properties of gas ionized by a non-thermal source (Fig. 5).
Moreover the spatial distribution of the ionization degree within the cone,
evaluated by means of the [O III] 5007/H ratio as a function of the distance from the nucleus, indicates that
the gas is highly ionized even at large distances from the AGN.
In order to understand if the AGN could account for such observed ionization,
the H luminosity of each spectrum was calculated from the reddening
corrected H fluxes.
Then the number of ionizing photons needed to produce such luminosities,
photons sec-1
(Kennicutt (1998)),
was evaluated and later compared with ,
where is the number of photons coming from the nucleus, diluted by
the covering factor , and
is the solid angle of a region seen from the nucleus.
By assuming that the nuclear source is an isotropic emitter of radiation
occulted along our line of sight, we attempted to estimate by
taking the average of the calculated number of photons ionizing the regions
surrounding the nucleus, after having removed the effect of the covering
factor ().
A value of photons sec-1 was
obtained, in good agreement with the 4.981052 photons sec-1
computed by Colina (1992) using the IUE spectrum of the galaxy and the flux
at 912 Å.
The resulting ratio concentrates around a value
of 2.5. This indicates that the active nucleus is the dominant ionizing source
for the regions within our field of view, in agreement with what observed
in the VO diagrams.
In spite of that, the ionization parameter ,
calculated within the cone as a function of the distance
r0 from the nucleus, ranges between and , a result
clearly in contrast with the already pointed out high ionization level of
almost all the regions. A total hydrogen density
is assumed, on the basis of the the electron
density values estimated over the whole field, using the
[S II] 6717/6731 ratio and assuming T=104 K (except
where the sulphur lines were not visible or extremely blended).
The problem of the missing data has been solved taking the average value of
independent linear interpolations of the [S II] ratios along the two
orthogonal directions of the spectral array. The resulting Ne distribution
presented values 103 cm-3, with a median of 300 cm-3.
Of course due to the uncertainties of the [S II] emission line strengths,
the estimation of the electron density is not very accurate and just a simple
decrease by a factor of 10 can account for the ionization parameter in the
regions far from the nucleus.
2.3 The models
The contribution of the shocks to the line intensities is tested by comparing calculated with observed spectra. The code SUMA (Contini & Viegas 2001, and references therein ), which accounts consistently for the photoionization flux from an external source and for the shocks is adopted.
The general model assumes matter bound gaseous and dusty clouds, which move outwards from the source and emit the line and continuum spectra. A shock front forms on the outer edge of the clouds, while the inner edge is reached by the radiation flux from the source.
The input parameters are : the radiation flux intensity, (in photons at 1 Ryd), the spectral index, (= 1.5 for all models), the shock velocity, , the preshock density, , the preshock magnetic field, (= gauss), the dust-to-gas ratio, d/g, and the geometrical thickness, D, of the emitting clouds. Cosmic relative abundances (Allen (1973)) are adopted.
Composite models lead to a complex distribution of the temperature and the density throughout the clouds. In radiation dominated (RD) models the effect of the flux from the active center (AC) prevails on the shock, while in shock dominated (SD) models the flux is absent (= 0). When shocks and photoionizing fluxes act on the opposite sides of the cloud, two regions of relative high temperature appear near the edges (see Sect. 2.4). Higher temperatures correspond to higher shock velocities (T 2), while the radiation flux cannot heat the gas to 2 - 3 104 K. This temperature leads to high O+2/O oxygen fractional abundance, so the [OIII] line strength depends on .
The cooling rate ( n2, where n is the density of the gas) increases with compression downstream of the shock leading to cool gas in the internal region of the cloud. The larger the cool region the strongest the low ionization level lines. The relative sizes of the hot and cool gas regions depend, therefore, on the shock velocity, on the intensity of the flux from the AC, on the preshock density, and on the geometrical thickness of the clouds.
A large grid of models is calculated in order to select the most suitable parameters to the observational evidences for each region in the galaxy. Recall that a first choice is roughly obtained considering that the [O III] 5007 line flux depends on the intensity of the nuclear radiation flux, the [S II] 6717/6731 line ratio depends on the density, as seen before, and the intensity ratios of high to low ionization lines depend on the geometrical thickness of the clouds and on the shock velocity (see Contini & Viegas 2001). The input parameters are then changed consistently in order to obtain the best fit of all the observed data.
2.4 [O III]/H and [O I]/H
The observations cover the SW cone providing line ratios
in many different regions.
We focus on [O III] 4959+5007/H and
[O I] 6300+6363/H line ratios, because [O III] lines
are generally strong in Seyfert 2 galaxies and are emitted
by gas ionized by the radiation flux from the active nucleus, while [O I]
lines are emitted from gas at lower temperatures and are generally strong in
the presence of shocks.
Moreover, Veilleux et al. (1999a) claim that dynamical processes such as entrainment by
AGN-powered radio jets generally have a stronger effect on the kinematics of
the highly ionized [O III] emitting gas than on those of the low-ionization
H emitting material.
Therefore, by modeling the observed spectra it is possible to determine the distribution of the radiation flux intensity and of other parameters, e.g. the shock velocity of the gas, the density, and the geometrical thickness of the clouds in the observed region. The reliability of the models is checked comparing the observed spectral energy distribution (SED) of the continuum with model results (see Sect. 4).
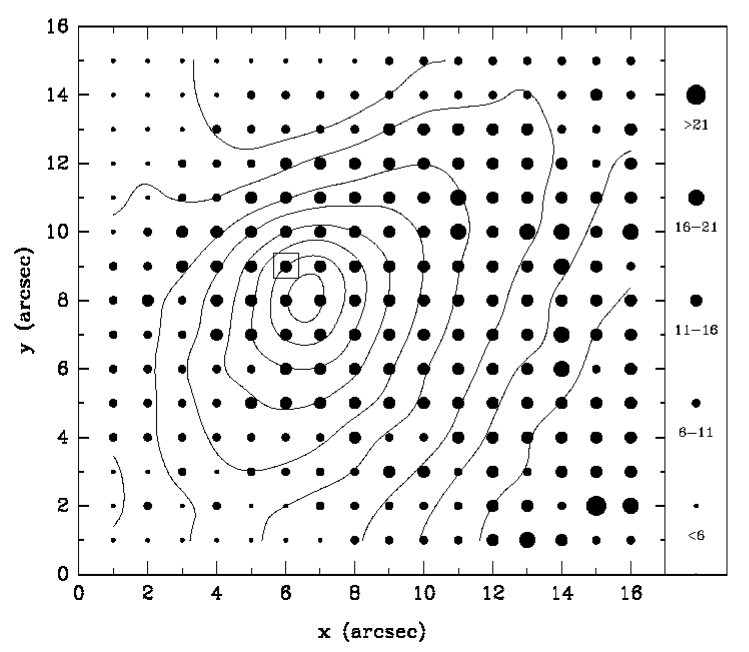
The observed [O III]/H line ratios overlaid to the continuum of the galaxy at 5500 Å are shown in Fig. 6 in a synthetic representation. The [O III]/H distribution is not smooth. Particularly, high [O III]/H ratios appear in some regions far from the active center. This suggest that the clouds in those regions have abnormal intrinsic conditions.

In Fig. 7 [O III]/H versus [O I]/H from the observations (black triangles) is compared with model calculations. All the models correspond to =100 . Higher velocities are less fitting, and velocities lower by a factor 2 lead to similar results. The thick solid line refers to shock dominated models with line ratios increasing with decreasing D and . The bulk of the data, however, is scattered throughout a region of the diagram better fitted by radiation dominated models. The thin solid line determines roughly the right edge of this region. The numbers in Fig. 7 refer to Table 1, where the models are described. The dashed lines connect models calculated with different D (increasing from left to right) but all corresponding to the same flux intensity , while the dotted lines connect models calculated with different (increasing from left to right) and corresponding to the same D. Fig. 7 shows that the trend of both types of models is different from the observed one, i.e. [O III]/H increasing with [O I]/H .
The increasing trend of the line ratios can be explained either by a slightly larger D and stronger (models 1 in Table 1) or by very large clouds (D 1 pc, models 2 in Table 1), corresponding to a lower density, and a flux intensity not exceeding the characteristic values calculated for most of the observed regions inside the cone. The other observed lines at each position are too few and too uncertain to constrain the models, therefore, we suggest that the clouds reached by a strong nuclear flux (model 1) are located in the central region of the cone, while clouds showing the same high [OIII]/H ratios, but characterized by a low density and a large geometrical thickness (model 2), are located in some external regions of the cone. Extended clouds of rarefied gas appear in the terminal region of jets and winds.
| () | D (1017 cm) | 1 | |
|---|---|---|---|
| 1 | 50. | 9, 10, 12 | 1.5 |
| 2 | 30. | 30, 40, 50 | 0.9 |
| 3 | 50. | 7. | 0.7, 1.0, 1.2 |
| 4 | 50. | 5, 6, 7 | 1. |
| 5 | 50. | 3.5, 4, 5 | 0.7 |
| 6 | 100. | 0.6 | 0.8, 1.0, 1.2 |
| 7 | 100. | 0.4 | 0.6, 0.8, 0.9 |
| 8 | 100. | 0.2, 0.25, 0.3 | 0.6 |
1 in units of 109 photons cm-2 s-1 eV-1 at 1 Ryd
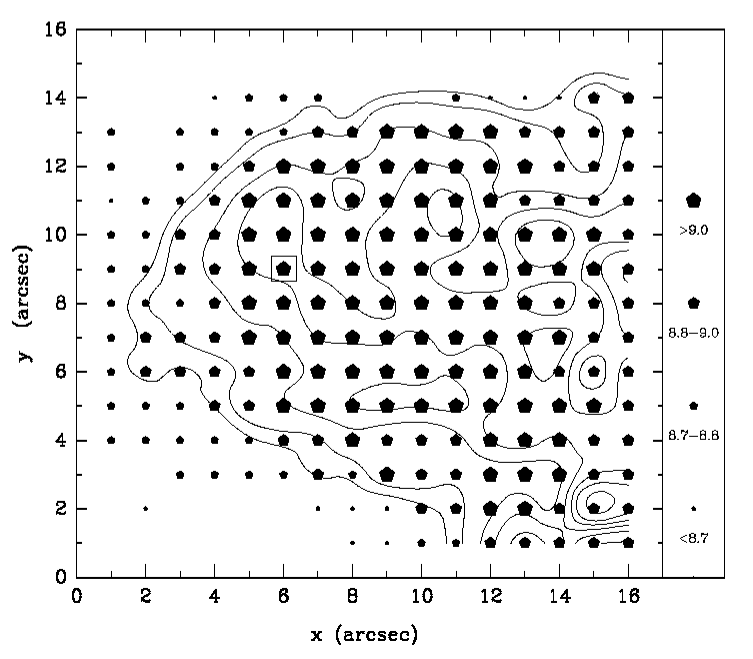
The distribution of in the different regions of the cone, as it results from modeling is shown in Fig. 8. The range of the corresponding ionization parameters U is 2 10-5 - 5 10-4.
To better understand the results obtained above, the distributions of the electron temperature (dotted line) and density (solid line) throughout a cloud are given for different models in Figs. 9 and 10. Each figure is divided by a solid vertical line in two halves. The horizontal axis scale is logarithmic and symmetric to have a comparable view of the two sides of the cloud. The shock front is on the left and the radiation flux from the source reaches the right edge.


The geometrical thickness D is a crucial parameter to low-level and, particularly, to neutral lines, because they are emitted from rather cold gas. Therefore, in the bottom pannels the distribution of the fractional abundance of /O (dotted line), /O (short-dash line), /O (long-dash line), and /H (solid line) have been plotted. Fig. 9 corresponds to D= 3 cm (0.01 pc) and Fig. 10 to D= 4 cm (1.3 pc). It can be noticed that two zones of gas emit the [O III] lines, one from the side of the shock, where collisional ionization prevails, and the other from gas ionized by radiation. The ionization rate due to the photoionization flux from the nuclear source, dominates in a large region of the cloud, particularly in models calculated with =100 , where the gas density and optical thickness are rather low. A large region of cool gas appears inside clouds corresponding to a large geometrical thickness and low density, leading to relatively strong [O I] lines.
2.5 [S II]/H
Fig. 11 shows [S II] 6717+6731/H versus [S II] 6717/6731. The low ionization lines are strongly affected by shocks. For models accounting for the shock a large range of electron densities follows from compression in the downstream region. The lines, calculated integrating through the geometrical thickness of the clouds, account for the different conditions of the gas (see section 2.4).

Some significant models, which are the same as those adopted to explain the [O III]/H ratios in Fig. 7, are indicated by open circles. They show a good agreement to the observed [S II] 6717/6731 line ratio between 1 and 1.3 in Fig. 11. The low density model gives [S II] 6717/6731 1.4. Notice, however, that the [S II] 6717+6731/H ratios are higher by a factor 2 than the data for most models, indicating that the S/H relative abundance is lower than cosmic. This is a common characteristic to Seyfert 2 galaxies where sulphur is depleted from the gaseous phase. The models are calculated adopting d/g (by number) = 10-14 - 10-13, indicating that dust is indeed present in the NGC 4388 cone region.
Reminding that compression increases with , models calculated with higher densities and velocities (=300 ) fit the data corresponding to low [S II] 6717/6731 (1), although their observed errors are large. Finally, models with =500 hardly fit any data, suggesting that high velocity clouds are relatively few (see Sect. 4).
The results show that the bulk of the shock velocities is lower than the velocities corresponding to the FWHM of the emission lines (200-700 ), indicating that strong shocks do not form in the observed region of NGC 4388, but rather low shock velocities =100 and low densities 100 dominate.
3 The North-East cone
We now consider the N-E cone and the very extended emission-line region (VEELR) discovered by YOS02 in order to have a larger view of the ionization conditions in NGC 4388. The nuclear region of the galaxy has been successfully investigated by Petitjean & Durret (1993), but only a few emission lines were observed at 21″, 25″, and 38″ from the nucleus.
YOS02 observed the [O III] 5007 and H +[N II] 6548,6583 fluxes from different clouds in the VEELR, which extends northeastward of the galaxy, very far outside the galaxy disk. The ionization cone is traced by the N-E plume and a high ionization cloud located at 10″-15″ northwest of the nucleus. They claim that there is a sudden change in the excitation state of the gas around the line at P.A. 65°, which coincides with the extrapolation of the northern edge line of the S-W cone. Notice that these authors assume as distance of NGC 4388, the distance of the Virgo cluster (16.7 Mpc), which is different from that one used by us for the S-W cone (33.6 Mpc). Therefore, all the distances should be scaled by a factor of 2.
In Figs. 12, 13, and 14 we compare the results of models calculated with the code SUMA with the YOS02 data. The errorbars refer to the typical uncertainty of 20 % estimated by YOS02. In all the diagrams the fluxes of [O III] versus H +[N II] (in ) are presented. Recall that models are calculated at the emitting nebula, while data are observed at Earth. Therefore, we have multiplied the data by d2/r2, where is the distance of each cloud from the center of the galaxy and is the distance of NGC 4388 from Earth.
All models are calculated adopting a geometrical thickness, D = 3 pc, and = 10-5 gauss, which is similar to the magnetic field in the ISM ( = 10-6-10-5 gauss).


Shock dominated models, calculated considering only heating and ionization of the clouds by the shock (=0), are presented in Fig. 12. The models are labeled by the shock velocity in . Large squares correspond to =10 , small squares to =2 . Relatively low preshock densities lead to the best agreement with the data, however, the SD models give a poor fit to the observed trend. This confirms YOS02 suggestion that gas excitation depends also on the flux from the active nucleus even at such large distances. We have used, therefore, RD models to fit the data. Recall that RD models are also composed because they account for the shock, even if the effect of the photoionizing flux prevails.
We present in Figs. 13 and 14 radiation dominated models calculated with different velocities and fluxes, adopting = 10 and 2 , respectively. Higher densities do not fit. In Fig. 13 black triangles indicate models calculated with =50 , white triangles in the left side of the diagram corresponding to =30 and at the right to =70-90 . The models are labeled by the values of log(). The maximum [N II]+H value is explained by =150 . Dotted lines join the results of models calculated with = 90 . Notice that, roughly, all the data can be reached by the models represented by the grid.
In Fig. 14 the models are calculated with =50 (black triangles), =70 (small white triangles), and =100 (large white triangles). The adopted fluxes range between log = 7. and 9. It can be noticed that the calculated trends do not correspond to the observed one, however, some data are well reproduced by the models. In particular, the maximum and minimum observed [N II]+H are not explained by these models.
We have chosen the best fitting models from Figs. 13 and 14 and we present in Fig. 15 consistent modeling of the entire dataset. The selected models represented by open circles are described in Table 2.
| M1 | M2 | M3 | M4 | M5 | |
|---|---|---|---|---|---|
| () | 2. | 2. | 2. | 2. | 10. |
| () | 35. | 50. | 70. | 100. | 150. |
| log() | 6.5 | 7.3 | 7.5 | 7.9 | 9.5 |
The fluxes of [O III] and H +[N II] are given in Fig. 16 as function of distance from the center. The data refer to the fluxes observed at the clouds. Fig. 16 shows that the line fluxes decrease with distance, however, different conditions coexist in the VEELR leading to the large scattering.

The emission line flux from the cloud, identified by YOS02 (see their Fig. 3) as C20, located at the extreme northern edge of the cone, is explained by a low flux (log = 6.5) , = 2 , and a low shock velocity (35 ). The largest H + [N II] flux is emitted by the cloud identified as C26, located in the nebula at the southern edge of the eastern cloud. It corresponds to relatively high (log =9.5) and high shock velocity ( 150 ). Also cloud C25 is slightly dislocated from the correlating curve in Fig. 15. Therefore, it shows conditions different from those of the other clouds. Cloud C1 shows the lowest distance from center and is modeled by log = 9, = 70 , and = 10 (Fig. 11). However, C1 also corresponds to a shock dominated model (Fig. 13) with =80 and =10 . We have not enough data to constrain the model and we conclude that many different conditions coexist in the clouds corresponding to the observations; in fact, the flux from the active nucleus, screened by the intervening matter, cannot reach all of the filaments within the observed clouds. The geometrical thickness adopted in the models is D= 3 pc, while the observed clouds show dimensions of the order of 100 pc. Shock dominated models are radiation bound, so the results should not change even adopting lower geometrical thickness.
To fit the data in Figs. 12, 13 and 14, we multiply the models by factors of 10-5, 10-8 and 10-6.5, respectively. They account for the filling factor. Cloud C20 has a surface area of S = 60 190 pc2 and the distance from center is r = 14.9 kpc (Yoshida et al. (2002), Table 2). From S/(4 r2) ff = 10-6.5 the filling factor results ff = 0.08. For cloud C26, which corresponds to gas with a higher density, we obtain ff = 1.3 10-4. Regarding cloud C1, ff= 1.4 10-4 results for the radiation dominated filaments and ff= 0.14 for the shock dominated filaments.
YOS02 claim that the inner region (r 12 kpc) of the VEELR may be excited by nuclear ionizing radiation, while the excitation mechanism of the outer region (r 12 kpc) is unclear. Our analysis is not complete because the [O III] line fluxes were not observed for r 15.6 kpc. It is found, however, that clouds C19-C22 correspond to lower fluxes and lower velocities, because the nuclear flux from the AC is diluted by distance. The ionization parameter U that results from modeling the VEELR ranges between 10-5 and 1.5 10-3. The shock velocities (50-150 ) are in agreement with the radial velocities in the N-E plume, i.e. 100-200 (Yoshida et al. (2002)).
4 The SED of the continuum
The consistency of the models is checked in Fig. 17 where the SED of the bremsstrahlung radiation and re-radiation by dust from different clouds within NGC 4388 is compared with the data. Therefore, in Fig. 17 two lines correspond to each model, one indicating the bremsstrahlung from the gas and the other emission from dust in the infrared. The observational data (from the NED222NASA/IPAC Extragalactic Database) are taken from Boroson et al. (1983), Scoville et al. (1983), de Vaucouleurs & Longo (1988), Soifer et al. (1989), Moshir et al. (1990), Becker et al. (1991), de Vaucouleurs et al. (1991), Gregory & Condon (1991), Kinney et al. (1993), Fabbiano et al. (1992), Zwicky et al. (1961), Douglas et al. (1996), Dressel & Condon (1978), Spinoglio et al. (1995) and Mould et al. (1980). The two data in the soft X-ray range come from Einstein (Fabbiano et al. 1992), integrated on 0.2-4.0 keV, and from ROSAT (Halderson et al. 2001), integrated on 0.1-2.4 keV.

Indeed, the data from the NED were taken with different precisions and in different epochs. Nevertheless, they are very significant because they correspond to the main contributions to the continuum in the different frequency ranges by 1) bremsstrahlung from the photoionized gas ( 5 1013- 5 1015 Hz), 2) bremsstrahlung from the hot gas in the downstream region of shocked clouds ( 1016 Hz), 3) emission from the old star population ( 5 1013-1015 Hz), 4) dust reradiation in the infrared range ( 1012-1014 Hz), and 5) radio emission ( 1011 Hz).
Besides the line and continuum spectra, the SUMA code calculates reradiation from dust in a consistent way. Dust is heated by the nuclear radiation flux; moreover, gas and dust mutually heat each other by collisions in shock turbulent regimes (Viegas & Contini 1994). Therefore, the frequency corresponding to the dust reradiation peak depends on the shock velocity. At high the grains will reach high temperatures in the post shock region and dust reradiation will peak in the mid-IR, while at low velocities the peak appears in the far-IR. The peak intensity depends on the dust-to-gas ratio.
Sputtering of the grains, which depends on the shock velocity, is calculated throughout the clouds. Small grains are rapidly sputtered, therefore we adopt silicate grains with an initial radius of 0.2 m.
Emission in the radio range corresponds to bremsstrahlung from cool gas as well as to synchrotron radiation due to Fermi mechanism at the shock front.
The continuum SED corresponding to single clouds are shown in Fig. 17 in order to explain the role of the different models. Then, the contributions from all the clouds are summed up to fit the data consistently in all the frequency domains.
The models obtained for the S-W cone are used to model the SED of NGC 4388, because the emission in the VEELR is very low and can hardly affect the continuum observed from the entire galaxy. The models presented in Fig. 17 are selected from those which better fit the bulk of the data shown in Fig. 7. We will consider three significant models, regarding the shock velocity, the preshock density, the geometrical thickness of the cloud, and the dust-to-gas ratio. The short-dashed lines refer to a model calculated with =100 , =100 , D=0.17 pc and d/g=1.5 10-14. Notice that d/g = 10-14 by number corresponds to 4.1 10-4 by mass (Draine & Lee 1984) which is the dust-to-gas ratio in the Galaxy adopting a silicate density of 3 g . Dotted lines represent the SED of the model calculated with D=10 pc, =30 , log = 9.8, and d/g=. Considering that the FWHM of the line profiles show velocities up to 500 , we have added in Fig. 17 also the continuum of a SD model corresponding to = 500 , =300 , and d/g =1.5 10-13, in order to fit the data at higher frequencies. This relatively high shock velocity leads to a temperature in the immediate postshock region of 3.7 106 K. Consequently bremsstrahlung radiation peaks in the soft X-ray domain.
Indeed, the analysis of the ROSAT HRI observations by Matt et al (1994) has shown that the 0.1-2.4 keV X-ray emission is dominated by an extended component ( 4.5 pc). It is interpreted as thermal emission from a collisionally heated plasma and a collection of discrete sources. The corresponding temperature of 0.4 keV ( K) is in agreement with the temperature of 4 106 K calculated by =500 . No correlation of the soft X-ray emission with the optical ionization cones has been found (Matt et al.). This confirms our previous results (Sects. 2 and 3) showing that rather low ( 100 ) shock velocities dominate in the cones.
Fig. 17 shows that the SED of single models calculated with =100 nicely fit the data corresponding to the lowest fluxes in the optical-UV range. The data between 1014 and 1015 Hz are, however, contaminated by radiation from old population stars and are explained by a black body model corresponding to 5 103 K (dash-dotted line). This is common to the continua of Seyfert 2 galaxies (Contini & Viegas (2000)).
Recall that dust and gas mutually heat each other across the shock front, therefore, dust re-radiation from high velocity clouds (= 500 ) peaks in the mid-IR (see Contini et al. (2002)). Our results show that these clouds are rather dusty.
The data in the radio range do not follow exactly the slope corresponding to bremsstrahlung from a cool gas. Yet, they do not fit a power-law distribution (thin solid line), which could be explained by synchrotron radiation created by Fermi mechanism at the shock front. Fig. 17 shows that both mechanisms contribute to the radio emission flux.
Finally, the thick solid lines in Fig. 17 represent the weighted sum of the single-cloud models for gas bremsstrahlung and dust reradiation, separately. The line is interrupted at frequencies lower than 1010 Hz, because self-absorption, which increases with wavelength, strongly reduces bremsstrahlung emission in the radio domain.
The model best fit to the data is obtained adopting different weights for different models. The weights account for the relative number of clouds corresponding to the model.
The ratio of the weights used to fit the data by the three models is 1 : 0.2 : 0.03, the maximum weight corresponding to =100 and D=0.17 pc and the minimum to =500 . This confirms that velocities of 100 and relatively small D ( 1 pc) dominate.
5 Concluding remarks
The central regions of the Seyfert-2 galaxy NGC 4388 have been observed by
means of the integral field spectroscopy technique.
The [O III] 5007/H map revealed part of the S-W
ionization cone, with P.A. 200° and aperture angle of
70°.
The analysis of the spectra within the cone shows the
non-thermal active nature of the emission line regions, whose ionization
degree remain high and almost constant even at large distances from the
nucleus.
With simple energy balance calculations we estimate the number of the
ionizing photons produced by the engine and we demonstrate that even if the
photoionization is the main physical process responsible for the excitation
of the gas inside the cone, it cannot be considered the only one under way,
since it cannot explain the observed high ionization far from the source.
We verify our hypothesis by applying to our spectroscopic data the SUMA code, which accounts for the combined effect of the photoionization from an external source and of the shocks. The results of the models, whose reliability is cross-checked by comparing them with the observed SED of the continuum, show that the ionization cone is characterized by a mixture of low density colliding clouds with large (D 1 pc) and small (D0.1 pc) geometrical thickness. Collisions, in fact, cause turbulence and R-T and K-H instabilities which lead to fragmentation of matter. In particular we are able to explain the high [O III]/H line ratios observed in the outer edges of the S-W cone by the coupled effect of a low density gas in large clouds (D 1 pc).
The models show that the bulk of the emitting clouds within the S-W cone has shock velocity of 100 , definitively lower than those corresponding to the observed FWHM of the line profiles (200 - 700 ). Adopting the hypothesis that the extraplanar material in NGC 4388 may represent the tidal debris from a recent encounter with a small gas-rich galaxy (Pogge (1988); Veilleux et al. 1999b ), we suggest that head-on-back shocks accompany the outwards motion of the clouds, which result when an incoming gas catches up with preexistent gaseous clouds moving in the same direction with a different velocity.
To complete the analysis of the biconical structure of NGC 4388 we have modeled the emission line fluxes observed by YOS02 in the VEELR of the N-E cone. We find that the physical conditions are in agreement with those found in the S-W cone, taking into consideration dilution with distance from the AGN. The results lead to log = 8.3 - 10.5 (U = 2 10-5 - 5 10-4), = 30 - 100 , and 100 -300 in the S-W cone, and log = 6.5 - 9.5 (U = 10-5 - 1.5 10-3), = 2 - 10 , and = 30 - 150 in the VEELR of the N-E cone. We prefer to compare the radiation fluxes instead of the ionization parameter, because U depends on the density of the gas in the edge of the cloud facing the radiation source. So, considering that the density decreases outward the galaxy, dilution is less prominent. The values of U in the nuclear region, calculated by Petitjean & Durret (1993), are much higher, U = 5 10-3 - 0.014, indicating that different conditions characterize the gas in this region.
Concluding, densities, shock velocities, and the magnetic field are lower in the VEELR, suggesting that beyond the edges of the VEELR the emitting clouds are merging with the ISM.
Acknowledgements.
We are very grateful to the referee, D. Alloin, for precious comments which highly improved the presentation of the paper. M. Contini is grateful to the Astrophysikalisches Institut Potsdam and the Department of Astronomy Padova for warm hospitality. We are grateful to Prof. V. Afanasiev and Dr. S. Dodonov of the Special Astrophysical Observatory (Russia) for their decisive contribution in observations and useful discussions about data reduction and analysis. This research has made use of the NASA/IPAC Extragalactic Database (NED) which is operated by the Jet Propulsion Laboratory, California Institute of Technology, under contract with the National Aeronautics and Space Administration.References
- Allen (1973) Allen, C.W. 1973, Astrophysical Quantities (3rd ed.; Athlone Press)
- Becker et al. (1991) Becker, R.M., White, R.L., & Edwards, A.L. 1991, ApJS, 75, 1
- Bonatto et al. (1989) Bonatto, C., Bica, E., & Alloin, D. 1989, A&A, 226, 23
- Boroson et al. (1983) Boroson, T.A., Strom, K.M., & Strom, S.E. 1983, ApJ, 274,39
- Colina (1992) Colina, L. 1992, ApJ, 386, 59
- Contini & Viegas (2000) Contini, M. & Viegas, S.M. 2000, ApJ, 535, 721
- (7) Contini, M. & Viegas, S.M. 2001, ApJS, 132, 211
- Contini et al. (2002) Contini, M., Radovich, M., Rafanelli, P., & Richter, M. G. 2002, ApJ, 572, 124
- de Vaucouleurs & Longo (1988) de Vaucouleurs, A. & Longo, G. 1988, Catalogue of Visual and Infrared Photometry of Galaxies from 0.5 m to 10 m (1961-1985) (Austin: University of Texas)
- de Vaucouleurs et al. (1991) de Vaucouleurs, G., de Vaucouleurs, A., Corwin, J.R. et al. 1991, Third Reference Catalogue of Bright Galaxies (New York :Springer-Verlag)
- Douglas et al. (1996) Douglas, J.N., Bash, F.H., Bozyan, A., Torrence, G.W., & Wolfe, C., 1996, AJ, 111, 1945
- Dressel & Condon (1978) Dressel, L.L., & Condon, J.J., 1978, ApJS, 36, 53
- Fabbiano et al. (1992) Fabbiano, G., Kim, D-W, & Trinchieri, G. 1992, ApJS, 80, 531
- Falcke et al. (1998) Falcke, H., Wilson, A.S. & Simpson, C. 1998, ApJ, 502, 199
- Ferland & Osterbrock (1986) Ferland, J.G. & Osterbrock, D.E. 1986, ApJ, 300, 658
- Gregory & Condon (1991) Gregory, P.C. & Condon, J.J. 1991, ApJS, 75, 1011
- Halderson et al. (2001) Halderson, E.L., Moran, E.C., Filippenko, A.V., & Ho, L.C. 2001, AJ, 122, 637
- Ho et al. (1993) Ho, L.C., Filippenko, A.V. & Sargent, W.L.W. 1993, ApJ, 417, 63
- Hummel & Saikia (1991) Hummel, E. & Saikia, D. 1991, A&A, 249, 43
- Kennicutt (1998) Kennicutt, R.C. 1998, ARA&A, 36, 189
- Kinney et al. (1991) Kinney, A.L., Antonucci, R.R.J., Ward, M.J., Wilson, A.S. & Whittle, M. 1991, ApJ, 377, 100
- Kinney et al. (1993) Kinney, A.L., Bohlin, R.C., Calzetti, D., Panagia, N. & Wyse, R.F.G. 1993, ApJS, 86, 5
- Matt et al (1994) Matt, G., Piro, L., Antonelli, L.A. et al. 1994, A&A292, L13
- Miller & Mathews (1972) Miller, J.S. & Mathews, W.G. 1972, ApJ, 172, 593
- Moshir et al. (1990) Moshir, M., Kopan, G.; Conrow, T. et al. 1990, IRAS Faint Source Catalogue, version 2.0
- Mould et al. (1980) Mould, J., Aaronson, M., & Huchra, J. 1980, ApJ, 238, 458
- Mulchaey et al. (1994) Mulchaey, J.S., Koratkar, A., Ward, M.J. et al. 1994, ApJ, 436, 586
- Petitjean & Durret (1993) Petitjean, P. & Durret, F. 1993, A&A, 277, 365
- Pogge (1988) Pogge, R.W. 1988, ApJ, 332, 702
- Pogge (1989) Pogge, R.W. 1989, ApJ, 345, 730
- Rafanelli et al. (1995) Rafanelli, P., Violato, M. & Baruffolo, A. 1995, AJ, 109, 1546
- Scoville et al. (1983) Scoville, N.Z., Becklin, E.E., Young, J.S. & Capps, R.W. 1983, ApJ, 271, 512
- Soifer et al. (1989) Soifer, B.T., Boehmer, L., Neugebauer, G. & Sanders, D.B. 1989 AJ, 98, 766
- Spinoglio et al. (1995) Spinoglio, L., Malkan, M.A., Rush, B., Carrasco, L., & Recillas-Cruz, E. 1995, ApJ, 453, 616
- Urry & Padovani (1995) Urry, C.M. & Padovani, P. 1995, PASP, 107, 803
- Veilleux & Osterbrock (1987) Veilleux, S. & Osterbrock, D.M. 1987, ApJS, 63, 295
- Veilleux et al. (1999a) Veilleux, S., Bland-Hawthorn, J., & Cecil, G. 1999a, AJ, 118, 2122
- (38) Veilleux, S., Bland-Hawthorn, J., & Cecil, G. , Tully, R.B. & Miller, S.T. 1999b, ApJ, 520, 111
- Viegas & Contini (1994) Viegas, S.M. & Contini, M. 1994 ApJ, 428, 113
- Yoshida et al. (2002) Yoshida, M., Yagi, M., Okamura, S., et al. 2002, ApJ, 567, 118
- Zwicky et al. (1961) Zwicky, F., Herzog, E., & Wild, P. 1961, CGCG1