The Starburst-AGN of NGC 1808 Observed with XMM-Newton ††thanks: Based on observations obtained with XMM-Newton, an ESA science mission with instruments and contributions directly funded by ESA Member States and NASA
Abstract
NGC 1808 is a nearby spiral galaxy that harbours an active central region with an extent of ( kpc). Previous X-ray and optical/NIR observations have provided convincing evidence for the existence of a starburst and an AGN. We present here preliminary results of the analysis of XMM-Newton data. We show a weak high-resolution soft X-ray spectrum with only emission lines typical of a starburst. Our analysis of the EPIC-pn spectrum shows two thermal components, but there is an additional, hard X-ray power law tail that is most likely due to an obscured active nucleus. Thus, our data show for the first time the presence of emission from both components, AGN and starburst, in one observation.
1 Introduction
NGC 1808, classified as a Sbc pec galaxy [1] is located at a distance of 10.9 Mpc (H0=75 kms -1Mpc-1, 1′′= 53 pc). Images in different wavebands suggest a high star-formation level in the central region with (i.e., a diameter of kpc): there are several optical hot spots associated with HII regions, luminous and compact knots in radio and IR [2, 3], that do not coincide with the optical hot spots and probably are supernova remnants (SNR) or complexes of unresolved SNRs; dust filaments explained as outflowing material driven by supernovae [4]. A recent interaction of NGC 1808 with its companion NGC 1792 could explain both the intense star-formation activity and the peculiar morphology of the galaxy [5, 6].
The nature of the nucleus is unclear: it is classified as Seyfert 2, using the optical nuclear emission lines [7]; it was classified as an obscured Seyfert but also as a hidden starburst based on measurements of polarized optical light [8]; the nucleus is claimed to have a strong non-stellar component because only 10% of the IR radiation observed by ISO could be interpreted as emission related to star formation [9]. In the X-ray band, Dahlem et al. [5] and Junkes et al. [10] favour a stellar origin based on ROSAT observations (0.1–2.4 keV) but do not discard other hypotheses. Awaki and Koyoma [11] interpret the Ginga X-ray data (1.5-37 keV) with an obscured nucleus, however, Awaki et al. [12], using ASCA (2–10 keV) point out that the hard X-ray spectrum may be the result of starburst activity and but the long-term variability from the Ginga and ASCA observations suggests a Seyfert nature of the nucleus.
A Chandra image of the central region of NGC 1808 shows that the X-ray emission is extended and consists of various circumnuclear sources that coincide with ultraviolet (UV) HII regions as observed with the HST [13].
The spectral analysis of the XMM-Newton data shown here sheds new light on the nature of the nuclear activity. In this work, we present preliminary results of the analysis of the optical, UV and X-ray XMM-Newton observations.
2 The Data: Observations and Images
e The XMM-Newton observations were performed on April 6, 2002. The EPIC-pn exposure time was 36000 s, in extended full frame mode and with the thin filter. The RGS time was 40000 s. OM was used with the U, UVW1 and UVW2 broad band filters, plus the two, optical and UV, grisms. The data has been processed with the Science Analysis System, SAS, version 5.3.0 for EPIC-pn andOM and 5.3.3 for RGS.
We have compared the Chandra , EPIC-pn and OM UV images. As shown in Fig. 1, the maximum emission in each of these images coincides with the location of the VLA radio nucleus [2]. The X-ray emission is extended and elongated in the direction of the UV structure.
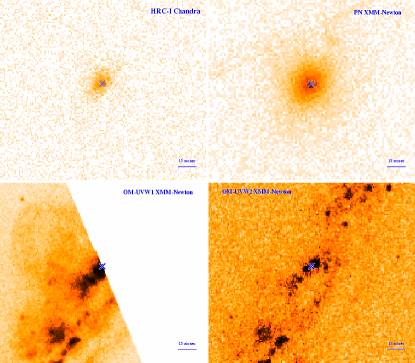
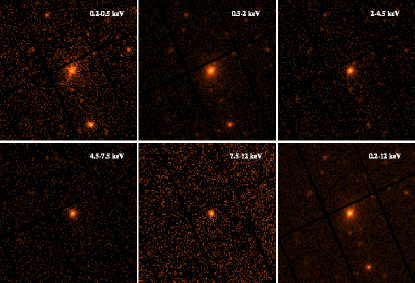
Fig. 2 shows EPIC-pn images of NGC 1808 in several energy bands. As the energy increases, the nuclear emission becomes more focused and the non-nuclear sources disappear.
3 Spectral Analysis of the EPIC-pn Data
EPIC-pn data have been used to perform a spectral analysis of NGC 1808 in the 0.15-15 keV energy band with moderate resolution (80 eV at 1 keV) and using single and double events.
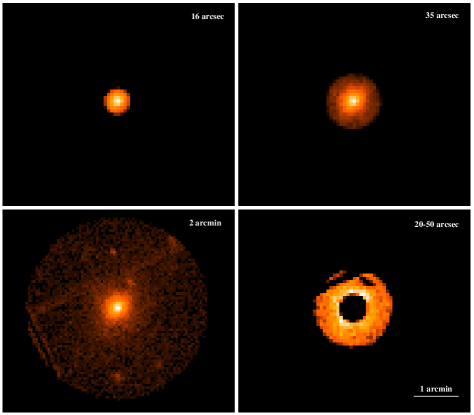
In order to search for differences in the X-ray spectrum of the nucleus and its surrounding HII regions, we have considered three circular regions and one annulus. The circles have radii of 16′′ (850 pc), 35′′ (1.9 kpc) and 2′ (6.4 kpc) and the annulus has external and internal radii of 20′′ and 50′′ (1-2.7 kpc) and also excluding an extra-nuclear source. Figures 3 and 4 show the extraction regions and the spectra, respectively.
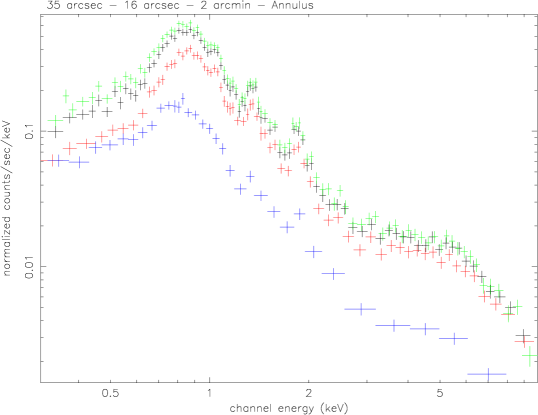
The spectra of the 35′′ and 2′ regions are very similar both in shape and intensity. The spectrum of the 16′′ region, although in good agreement with the two previous ones above 2 keV, is clearly weaker in the soft band.
3.1 The EPIC-pn Nuclear Spectrum
The EPIC-pn spectrum of the NGC 1808 nucleus, r=16′′, shows prominent Si and Mg emission lines. Fig. 5 shows the 0.5–10 keV spectrum, the best fit model, =1.04 for 88 dof, and the residuals. The model includes, apart from the galactic absorption due to the Galaxy with N cm-2, a power law, , absorbed by an extra Hydrogen column of NH=5.4 cm-2 and two thermal components with temperatures of kT=0.53 keV and kT=0.62 keV, the former also absorbed by an extra Hydrogen column of NH=1.3cm-2. The abundances of O, Ne, Mg and Si, let free in the fits, are 1.6, 1.9, 1.4 and 0.7 times the solar value, respectively. No Fe K line is included.

The r=16′′ region luminosities corrected for absorption are shown in Table 1. The thermal components dominate in the soft X-ray band while the power law is dominant in the 2-10 keV band. Table 1 also shows the luminosity of a r=625 region measured with EPIC-pn and with ROSAT [10]. The large discrepancy could be due to a long-term variability over several years, from February 1991 to April 2002, already suggested by Awaki et al. [12] when comparing Ginga and ASCA data. Short-term variability has not been detected during the XMM-Newton observation.
| Region | L | L |
| radius | erg s-1 | erg s-1 |
| 16′′ | 9.5 | 15 |
| Power law | 0.3 () | 14 () |
| Thermal | 9.2 () | 1.2 () |
| 625 | 12 | 15.5 |
| 625 ROSAT | 140 | - |
4 Spectral Analysis of the High Resolution RGS Data
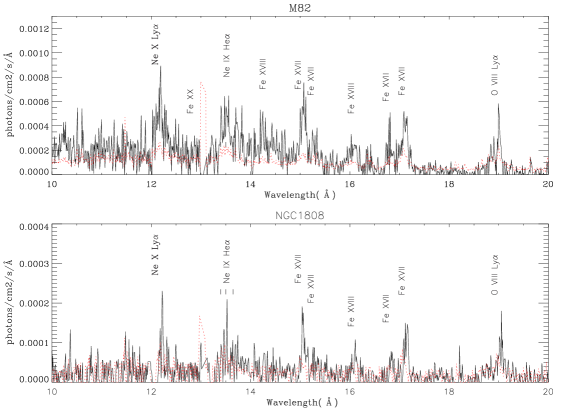
Fig. 6 compares the combined RGS1 and RGS2 spectrum of NGC 1808 with that of M82, a proto-typical starburst galaxy. Both spectra have been generated with the rgsfluxer SAS 5.3.3 task. The RGS spectrum of NGC 1808 shows no continuum emission above the noise level, but it does exhibit emission lines. Fig. 6 shows that these have wavelengths and relative intensity ratios very similar to the strongest lines identified in M82 [14]. They correspond to Ly emission lines from Ne X and O VIII, transitions of He-like Ne IX ions, and Fe-L emission lines from Fe XVII and Fe XVIII. The weaker lines visible in the spectrum of M82 are not detected in NGC 1808, because of the lower signal-to-noise ratio. The similarity in the line ratios suggests that there is a common origin of the soft X-ray emission in both galaxies, i.e. thermal emission from a hot and extended gas component as shown for M82 [14]. This result confirms the detection of the starburst in NGC 1808 which dominates the soft X-ray band emission.
5 Summary and Conclusions
The XMM-Newton EPIC images show extended X-ray emission in agreement with previous HRI-Chandra results. There is a correlation between X-ray and ultraviolet emission: the location of the maximum luminosity corresponds to an unresolved point-like source and coincides in both spectral ranges. Comparing EPIC-pn spectra of several regions in the central part of NGC 1808, it is inferred that the bulk of the emission originates from the nucleus, although in the soft X-ray band the contribution of the circumnuclear regions is not negligible. The EPIC-pn spectrum of the nucleus (r=16′′, 850 pc) is explained by two thermal components which account for the main part of the soft X-ray emission, but an additional power law component is required to explain the hard X-rays. The luminosity of the unresolved nucleus in the 0.2–10 keV band is erg s-1. The EPIC-pn result suggests the presence of an additional obscured AGN-like component. The data obtained with RGS exhibit emission lines similar in wavelength and relative intensity ratios to the ones found for the prototypical starburst galaxy M82. This result confirms the detection of a nuclear starburst in NGC 1808 which dominates the total emission spectrum including the continuum in the soft X-ray regime.
References
- [1] Sandage, A. & Tammann, G. A. 1987, Carnegie Institution of Washington Publication, Washington: Carnegie Institution, 1987, 2nd ed.
- [2] Saikia, D. J., Unger, S. W., Pedlar, et al. 1990, MNRAS, 245, 397
- [3] Kotilainen, J. K., Forbes, D. A., Moorwood, A. F. M., van der Werf, P. P., & Ward, M. J. 1996, A&A, 313, 771
- [4] Heckman, T. M., Armus, L., & Miley, G. K. 1990, APJS, 74, 833
- [5] Dahlem, M., Bomans, D. J., & Will, J. 1994, ApJ, 432, 590
- [6] Koribalski, B., Dahlem, M., Mebold, U., & Brinks, E. 1993, A&A, 268, 14
- [7] Véron-Cetty, M.-P. & Véron, P. 1985, A&A, 145, 425
- [8] Scarrott, S. M., Draper, P. W., Stockdale et al. 1993, MNRAS, 264, L7
- [9] Siebenmorgen, R., Krügel, E., & Laureijs, R. J. 2001, A&A, 377, 735
- [10] Junkes, N., Zinnecker, H., Hensler et al. 1995, A&A, 294, 8
- [11] Awaki, H. & Koyama, K. 1993, Advances in Space Research, 13, 221
- [12] Awaki, H., Ueno, S., Koyama et al. 1996, PASJ, 48, 409
- [13] Zezas A.,Ward M., Fabbiano G. et al. 2002111http://hea-www.harvard.edu/HEAD-preprints/2000/November/zezas/paper.ps
- [14] Read, A. M. & Stevens, I. R. 2002, MNRAS, 335, L36