Emission Line Galaxies in the STIS Parallel Survey I: Observations and Data Analysis111Based on observations made with the NASA/ESA Hubble Space Telescope, obtained from the data archive at the Space Telescope Science Institute, which is operated by the Association of Universities for Research in Astronomy, Inc., under NASA contract NAS 5-26555.
Abstract
In the first three years of operation STIS obtained slitless spectra of fields in parallel to prime HST observations as part of the STIS Parallel Survey (SPS). The archive contains fields at high galactic latitude () with spectroscopic exposure times greater than 3000 seconds. This sample contains 220 fields (excluding special regions and requiring a consistent grating angle) observed between 6 June 1997 and 21 September 2000, with a total survey area of square arcminutes. At this depth, the SPS detects an average of one emission line galaxy per three fields. We present the analysis of these data, and the identification of 131 low to intermediate redshift galaxies detected by optical emission lines. The sample contains 78 objects with emission lines that we infer to be redshifted [OII]3727 emission at . The comoving number density of these objects is comparable to that of H-emitting galaxies in the NICMOS parallel observations. One quasar and three probable Seyfert galaxies are detected. Many of the emission-line objects show morphologies suggestive of mergers or interactions. The reduced data are available upon request from the authors.
1 Introduction
The relative pointing of instruments on the Hubble Space Telescope allows for parallel observation during targeted science exposures. Parallel fields are essentially random pointings on the sky, being separated by 5-8 arcminutes from the prime target. Extensive imaging of parallel fields was possible with WFPC2, and the Medium Deep Survey obtained hundreds of fields (c.f. Griffiths et al. 1994). With the addition of the slitless spectroscopic capabilities of STIS (Kimble et al. 1998) and NICMOS (Thompson et al. 1998), parallel observations now allow HST to conduct redshift surveys in large numbers of random fields without negatively impacting the duty cycle of the telescope (see Gardner et al. 1998, McCarthy et al. 1999, Yan et al. 1999). These untargeted redshift surveys explore a new regime in galaxy evolution, as they are less subject to a bias induced by cosmic variance than pencil beam surveys (e.g. Cohen et al. 2000) and detect fainter objects than wide field surveys (e.g. CFRS; Hammer et al. 1997). The slitless spectroscopy requires comparable deep imaging for object identification; thus the redshift survey is accompanied by high resolution imaging.
In this paper, we present the analysis of the deepest spectroscopic fields in the STIS parallel survey (SPS). STIS parallel spectra were taken over the 5300-10000 Å range during the course of the program. We have searched for emission line galaxies, in particular [OII]-emitting galaxies at redshift . Our motivation is to determine the comoving density of star-formation at these redshifts as inferred from [OII] emission (Teplitz et al. 2002; hereafter Paper II). We will discuss the target selection in section 2, the data reduction, line identification and measurement in section 3, and the results in sections 4 and 5.
2 Target Selection
The SPS data were obtained in pairs of spectroscopic exposures and direct images of each field. The spectroscopic (dispersed) exposures were taken with the G750L low resolution grating, which has a dispersion of 4.92 Å per pixel and a point source resolving power of at 7500 Å. The resolving power decreases for extended objects in slitless spectroscopy, as the resolution element is convolved with the galaxy profile. The spectra cover the range of approximately 5300-10000 Å, depending on object position within the field. The sensitivity falls off sharply at the blue end and gradually at the red end. We can detect [OII] at , [OIII]5007 at , and H at . The spectroscopic exposures are binned by a factor of two in the spatial dimension in order to improve read noise. The SPS includes G750L observations with the grating angle set to provide different center wavelengths. To ensure as uniform a dataset as possible, we limit our dataset to spectra with a center wavelength of 7751Å. Direct imaging data are taken without a filter, providing photometry integrated over CCD-response limited wavelength range ( Å, see Baum et al. 1996), referred to as 50CCD magnitudes.
During the period 6 June 1997 and 21 September 2000, STIS observed parallel fields. Our goal is to study optical emission lines at intermediate redshift, so our targets will be faint, and we select only the deepest exposures. Through trial and error we determined that 3000 seconds were needed to reliably detect emission line objects in random fields. We also require a deep image (300 seconds) to establish the wavelength scale, properly identify the objects, and measure their photometric characteristics.
STIS parallel fields lie 5 to 8 arcminutes from the targeted position, depending on which instrument is prime. Only those fields that are not contaminated by the prime science target are usable for this study. Thus targets near the galactic plane (), nearby galaxies, or galaxy clusters are excluded.
The data were taken under a variety of observing plans. In some cases all imaging (or spectroscopic) exposures had the same integration time, in other cases the integration times were optimized to fill the orbit. The cosmic ray (CR) rejection algorithm is more effective in cases of equal integration time, and this should be considered in planning of future surveys. In a few fields the automated CR-rejection algorithm failed to produce acceptable results, and we discard those fields from the survey.
After rejecting contaminated fields, 219 SPS fields meet our requirements. The sample contains fields with more than seconds of integration time, but the distribution is strongly weighted towards the shortest allowed exposure time (3000 seconds; see Figure 2).
Dithering of the observation was determined by the prime instrument. Typically this provided a few tens of pixels in both the and directions. The regions on the edges with poor overlap are not included in the survey. Similarly, a bright star or local galaxy can obscure significant area of the background sky. These obscured regions are not included in the survey area. Table 1 lists the exposure time for both imaging and spectroscopic exposures for each field, together with the pointing information and limiting flux (see below), and the areal coverage of the good region.
We searched the NASA/IPAC Extragalactic Database (NED) for known objects in each field. Three fields contain objects with previously reported redshifts, and many fields contain previously reported objects without certain redshifts. NED objects are described in Table 2.
3 Data Reduction
The first step in the data reduction was identification of fields with common pointing. Observations were considered as co-pointed if they were centered within 5′′ of each other, and they were processed as a group. Each exposure was processed through the basic data reduction software, calstis. This software was developed by the STIS Investigation Definition Team (IDT), and it is similar to the IRAF version available from STScI. Briefly, the data were bias and dark subtracted, flat fielded, and bad pixels were repaired. The bias subtraction included an overscan fit to account for small temporal variations. Since the 2D spectroscopic exposures are binned by a factor of two in , the dark was binned in software before subtraction. We do not find that this binning introduces any artifacts, but it is a step that must be checked carefully when applied. The flat fielding was performed in two steps: first, a pixel-to-pixel flat was applied, and then a correction was made for low frequency variation across the CCD induced by vignetting. The flat fields are monochromatic and so do not correct for fringing at long wavelengths in the spectra. Fringing can cause increased noise in the measurement of line fluxes at the % level. The bad pixel repair was based on the best available (i.e., taken closest in time) bad pixel mask from the archive. Each bad pixel was replaced by the average of its neighbors, and that pixel was flagged in the error array. For direct images the eight nearest pixels were used, but for dispersed images only the left and right neighbors were averaged in order to use data in the same spectrum. A second bad pixel correction was also performed on the output from calstis in order to “preclean” the data before CR rejection. This second correction checked for single, isolated pixels with outlying data values.
After the “calstis” reduction, the offsets between dithered exposures were calculated. The offsets were determined by cross-correlation of source positions in each image. Spectroscopic exposures were assumed to have the same offset as the image taken in the pair. In some cases, however, there were spectroscopic exposures that were taken without a direct image at the exact position, and the shift needed to be determined from the astrometry in the FITS header. In these cases the shifts are good to about a pixel, but are not as accurate as the subpixel shifts determined from the extracted sources. In order to measure source positions in each image, a crude CR rejection must be performed. The algorithm looks for groups of high count-rate pixels that are too compact or too highly peaked to be real objects. Since it is not necessary to preserve all real sources at this step, the precleaning parameters are set to make the rejection severe. Sources were identified using the SExtractor software (Bertin & Arnouts 1996).
Once offsets had been determined, individual exposures were registered, with bilinear interpolation for subpixel shifts. Cosmic rays in the images were identified in background subtracted copies of the images. The background was determined in the direct images using two dimensional smoothing after source removal. This procedure is modelled on the SExtractor background subtraction. For the spectroscopic images, a one dimensional column-by-column median was used for background subtraction. The stack of registered images was cleaned by omitting outliers in the distribution of pixel values separately at each pixel position. The cleaned images were combined into a final frame using the mean of pixels remaining at each position. The reduced data were normalized to counts per second per unbinned pixel.
3.1 Identifying, Extracting, and Measuring Emission Lines
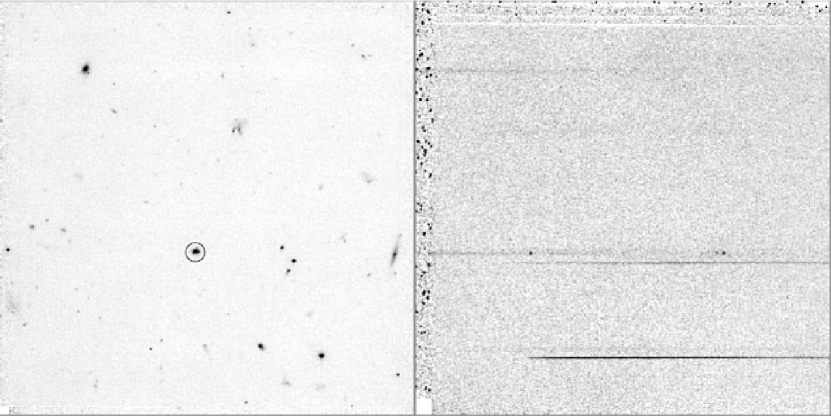
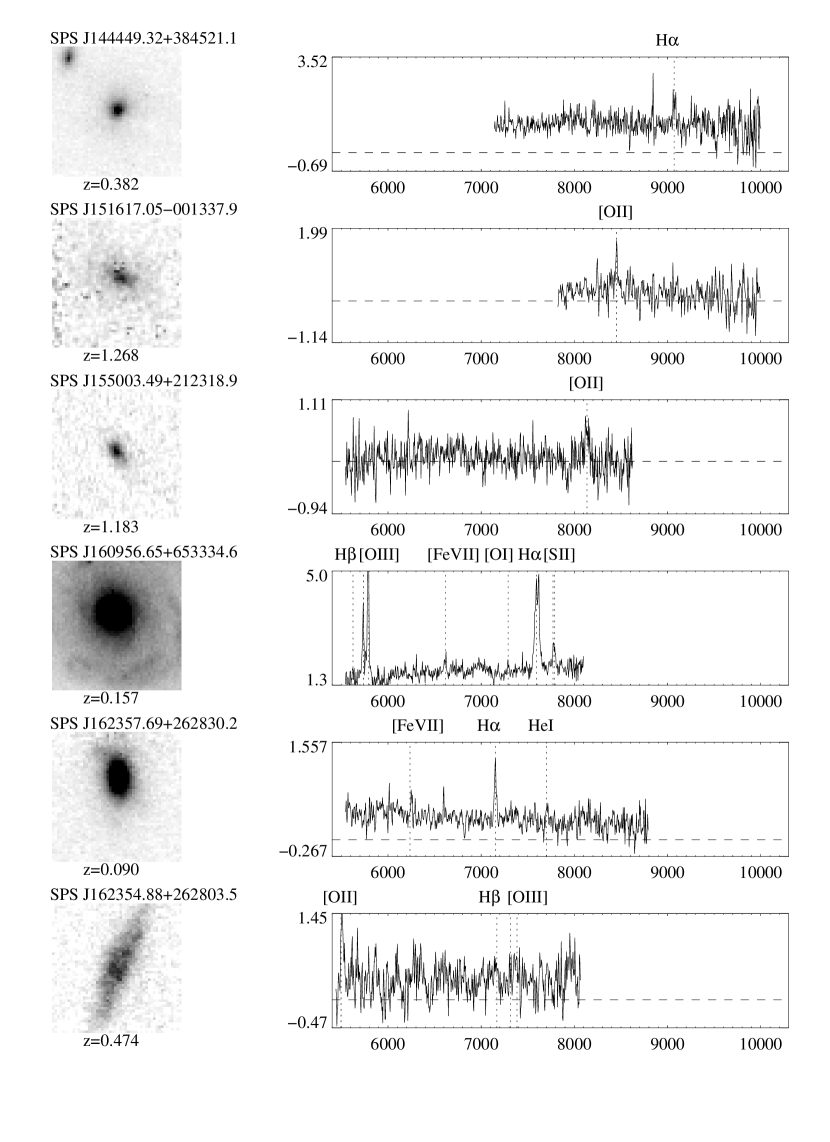
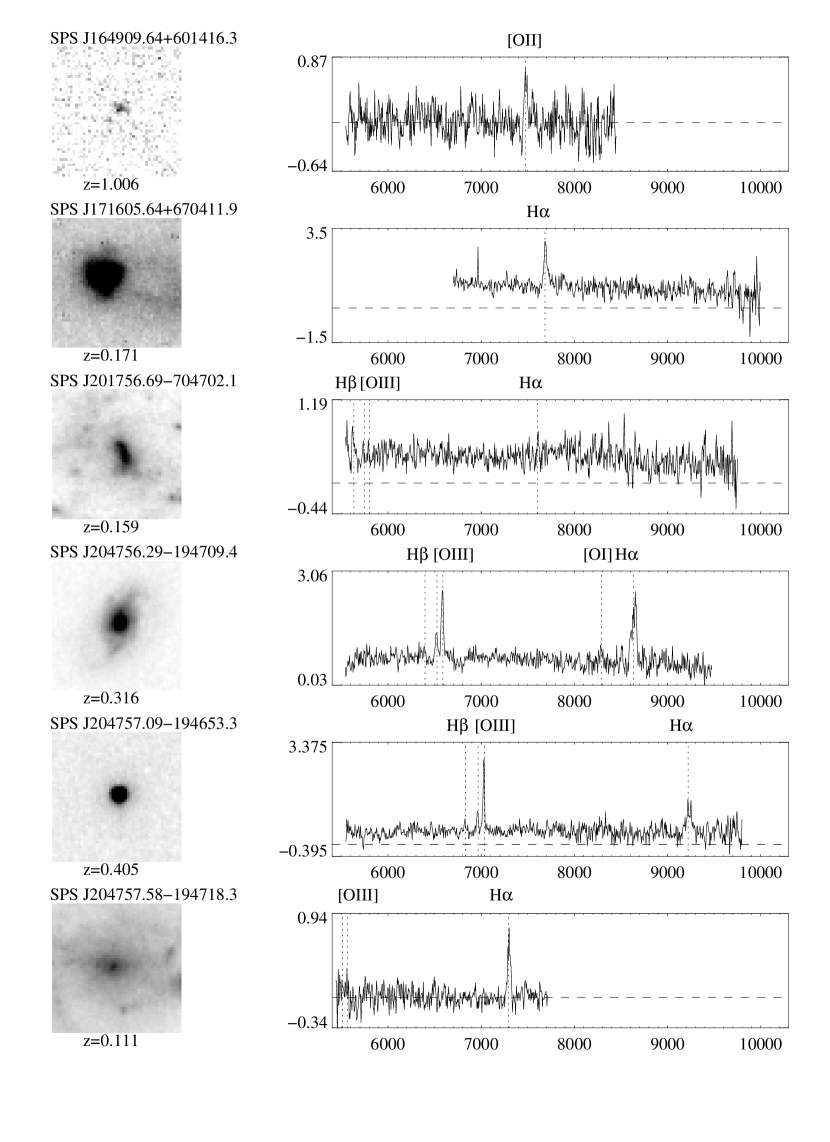
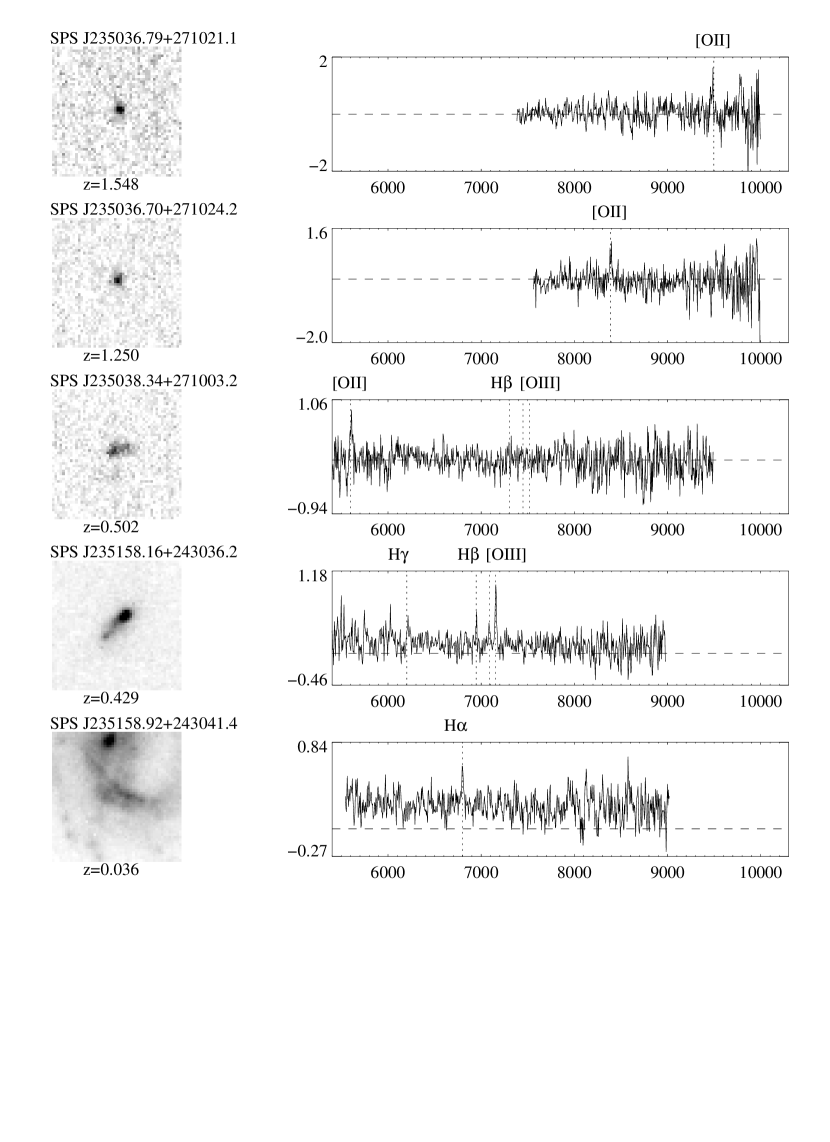
Each reduced spectroscopic frame was searched by eye for emission lines. Three of us (HIT, NRC, JR) examined every field. Lines were only considered real if there was unanimous agreement (though independent discovery of each line was not required). Figure 1 shows an imaging/slitless spectrum pair, with strong emission lines. In many frames, bad pixels are present that must be examined carefully by hand to distinguish them from real emission lines. At a minimum, a real line is required to have significant flux in multiple pixels. We set a significance threshold of for the strongest emission line in an object in order for it to be considered. Further, we do not consider any possible emission lines that cannot be associated with an object in the direct image. We detect emission lines in 134 objects. Objects at low redshift () are well resolved and the emission lines often appear to originate in small knots; in those cases we did not measure the line flux, but we will present the object identification and redshift.
For extraction, the position of the spectrum in the 2D frame must be known relative to the source position in the image. The dispersed frames have a small anamorphic magnification (less than 2%), which is included in the extraction. Contemporaneous wavelength calibrations cannot be taken for each individual parallel observation. The wavelength scale is determined from an empirical fit to on-orbit data taken early in the project. This scale appears to be stable at the pixel level, with variations arising from mechanism non-repeatability and thermal motion. The wavelength scale for an extracted spectrum with pixels, is
| (1) |
where () are the pixel position of the galaxy center in the direct image, and the value of the constants depends on the grating settings. For the SPS, and Å. We use a linear wavelength scale, as the quadratic terms in the solution would be at the subpixel level. The value of () are accurate on the integer pixel level. Combined with the repeatability of the scale, wavelength calibration uncertainty is pixels. Emission line wavelengths are measured to within 1 pixel, so the total redshift uncertainty is on the order of 3 pixels ( for [OII] at ).
Spectra were extracted by simple summation along the columns covered by the wavelength range. The width of the extraction box was set by hand for each object. A small (%) ”slit correction” was applied to the extraction based on the width of the box, compared to the profile of the object. Spectra were sky-subtracted based on two sky windows, one on either side of the spectrum. The width of these windows, and their offset from the spectrum, were adjusted manually for extraction, to achieve minimal contamination from other objects in the field. For each column in the spectrum, the average pixel value in that column in each sky window is measured, and a line is fit to the two points, giving a sky value at each pixel in the spectrum. Before subtracting, these interpolated sky values are smoothed row by row, using a median filter followed by two iterations of a mean filter. The extracted spectra were divided by the sensitivity function to convert from DN/s/pixel to flux units.
Lines were measured in extracted spectra by interactively fitting a gaussian to the line profile and integrating. Continuum measurements were made in the spectra themselves in regions near the line. For several bright objects the flux calibrated continuum measurements were checked against the continuum value inferred from the clear aperture photometry. There is a trade off between the poor signal-to-noise in the spectroscopic continuum, and the uncertainty in the slope of the continuum needed to use the aperture photometry to infer the continuum. For consistency, the equivalent width (EW) of each line was calculated from the local continuum measurement rather than the photometric value. This procedure leads to poor EW measurements in the faintest, high EW objects. However, for the scientific analysis, we will need to know the EW value with the greatest certainty for objects with low EW values, and thus objects with better continuum measurements (see Paper II).
3.2 Single Line Objects
We detect only single lines in 94 of the 131 objects. In order to assign a rest wavelength to single-line objects, it is necessary to appeal to common sense constraints. We assume that any lone emission line is either H or the next strongest optical line associated with star-formation, [OII]3727 (Kennicutt 1998). Ly emission at is is not considered a possibility, as there is often some flux detected blueward of the line, and in most cases the objects are relatively bright.
The [OIII] doublet at 4959, 5007 Å is also sometimes strong in star-forming galaxies. The ratio of the double is 1:3.1, so it is possible that a low signal to noise detection of a single line could be 5007 (which would also imply weak H emission at 4861Å). Typically, at low redshift [OIII] is undetected in galaxies with EW(H) Å, but can be 30% the strength of H in the most vigorously star-forming objects (Kennicutt 1992). In low metallicity galaxies and HII regions, [OIII] can be as strong as H or even stronger in some cases (Terlevich et al. 1991; Izotov, Thuan, & Lipovetsky 1994). At high redshift (), [OIII] has also been detected galaxies with a line strength comparable to H in lower metallicity () galaxies (Pettini et al. 2001; Teplitz et al. 2000).
However, in our spectra [OIII]5007 is not the most likely identification for a single line. At , H-alpha would still be in the nominally observable wavelength range, and at higher redshifts [OII] would be be in the range at the blue end, and in some cases [OII] can be 50-200% the strength of [OIII] (e.g. Kobulnicky, Kennicutt, & Pizagno 1999). In addition, for the single line objects with good () detections, one might expect to see some evidence of either [OIII]4959 or H if the line were [OIII]5007.
We do not necessarily expect to see [NII] emission from the H emitters, as [NII] can be 0.1 to 0.3 the strength of H. Also, at low redshift [NII] may be hard to resolve from H, given that spectra lose resolution for larger objects.
Given only the choice of [OII] and H, any line at wavelengths shortward of 6563 Å must be [OII]. Similarly an emission line that would place an H-emitter at a low redshift () might be expected to appear noticeably large and bright in the image. We make this assumption, and thus do not consider the possibility that the survey might detect extremely low mass galaxies at low redshift.
The ratio of H to [OIII]5007 emission is typically 2-3 to 1 (Kennicutt 1992) and the ratio of H to H is 2.86 to one. Thus a single line at the red end of the spectrum is taken to be [OII] if there is no evidence of [OIII] or H where they would have been expected had the line been H.
Finally, there are 28 objects that give no indication as to the rest wavelength of the line. Since the survey covers considerably more volume for [OII] emitters, we assume that these lines are [OII]. It should be kept in mind, then, that the density of [OII] emitters inferred is an upper limit and that some downward correction (25% or less) might be expected.
The large percentage of single line objects in the sample is in part a result of the limited spectral coverage. Since objects near the edge of the field of view have their spectral range truncated, [OII]-emitters for example are very likely to be single line objects. Indeed, 40 of the 64 objects identified as single line [OII] emitters are at redshifts that place the next strong line (H) beyond the red end of the spectrum. The observed wavelength range of each spectrum is listed in Table 3.
A quality flag is assigned to the redshift of each galaxy. A value of 4
indicates that there are multiple emission lines and the redshift
is secure. A
value of 3 is assigned to galaxies for which there is a strong
reason for the assignment; that is one of the
following:
-
•
(a) the wavelength of the single line is less than 6563Å, or
-
•
(b) the wavelength of the single line would place a faint () and/or compact object at , or
-
•
(c) the redshift of the object if it were an H-emitter would imply a non-detection of [OIII]5007.
A quality flag of 2 indicates that there is some potential problem with the assignment. Usually this indicates that the line is at a blue wavelength (option above) but that no [OIII]5007 is detected at the red end of the spectrum. In a few cases, this non-detection is in a region of poor spectroscopic sensitivity ( Å) and a quality flag of 1.5 is assigned to differentiate it. A non-detection of [OIII] in an [OII] emitter is possible, depending on the conditions in the galaxy. The [OII] : [OIII] ratio can vary from 0.1 to 10. These non-detections, if confirmed, would imply that these galaxies had unusual metallicities or ionization parameters. A quality flag of 1 indicates that the redshift is poor, and that it is based solely on the volume of the survey.
3.3 Measuring the Noise
Given a weak or virtually nonexistent continuum detection (as in many SPS spectra), it is hard to measure the signal to noise ratio of an emission line from the extracted spectrum. Instead, the noise is measured in each image and compared to the signal in the line. Since each line is a two dimensional pixel region before extraction, the noise can measured in the sky in much the same manner as it would be for photometry in imaging. The specific method is to randomly extract a box the size of the line at thousands of positions across the frame. The size is determined in the direction by the width of the extraction box. In the direction, the size is determined from the measured FWHM of the line. Each extraction includes a sky subtraction from neighboring sky windows, just as in the spectroscopic extraction. The extracted values should have a median of zero if there is no residual spatial variation in the sky. The standard deviation of the extractions is the noise in the frame for a line with that spatial and spectroscopic extent. Table 1 lists the typical limiting fluxes for each field, based on an emission line from a galaxy with ′′, and a 7 pixel wide extraction box. This size is slightly larger than the median for detected lines.
4 Results
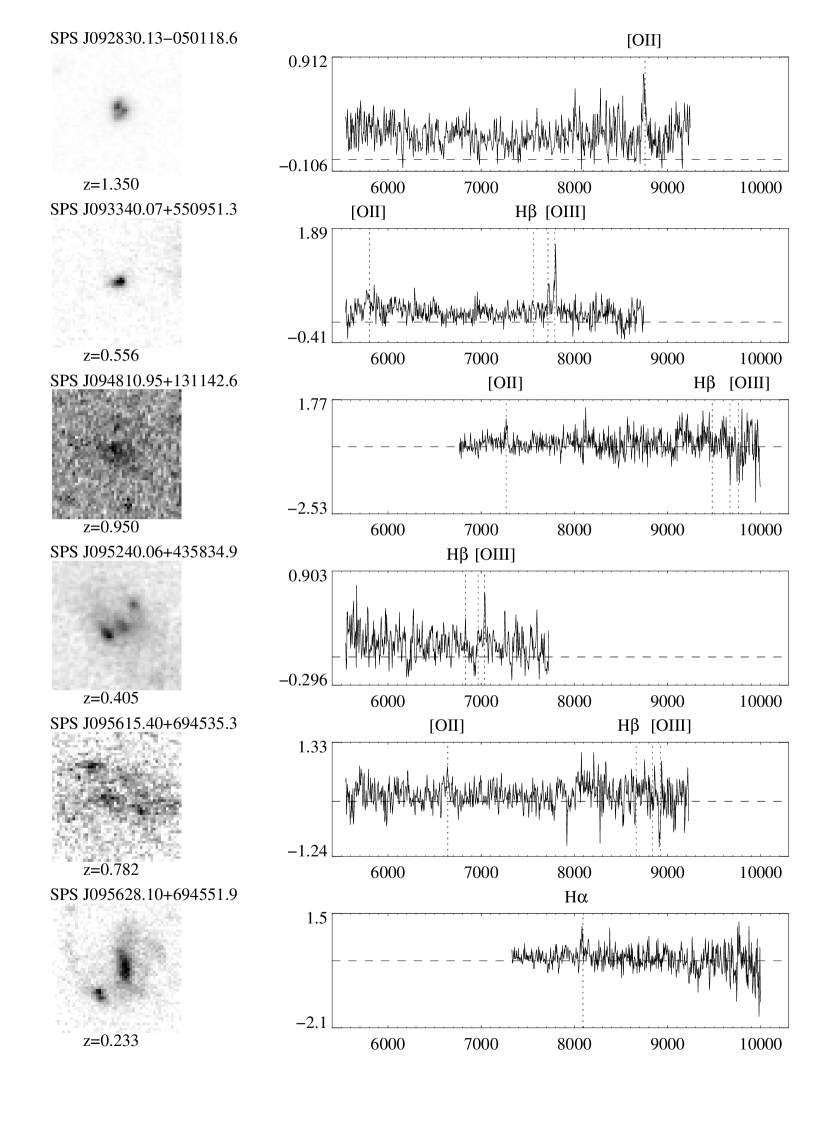
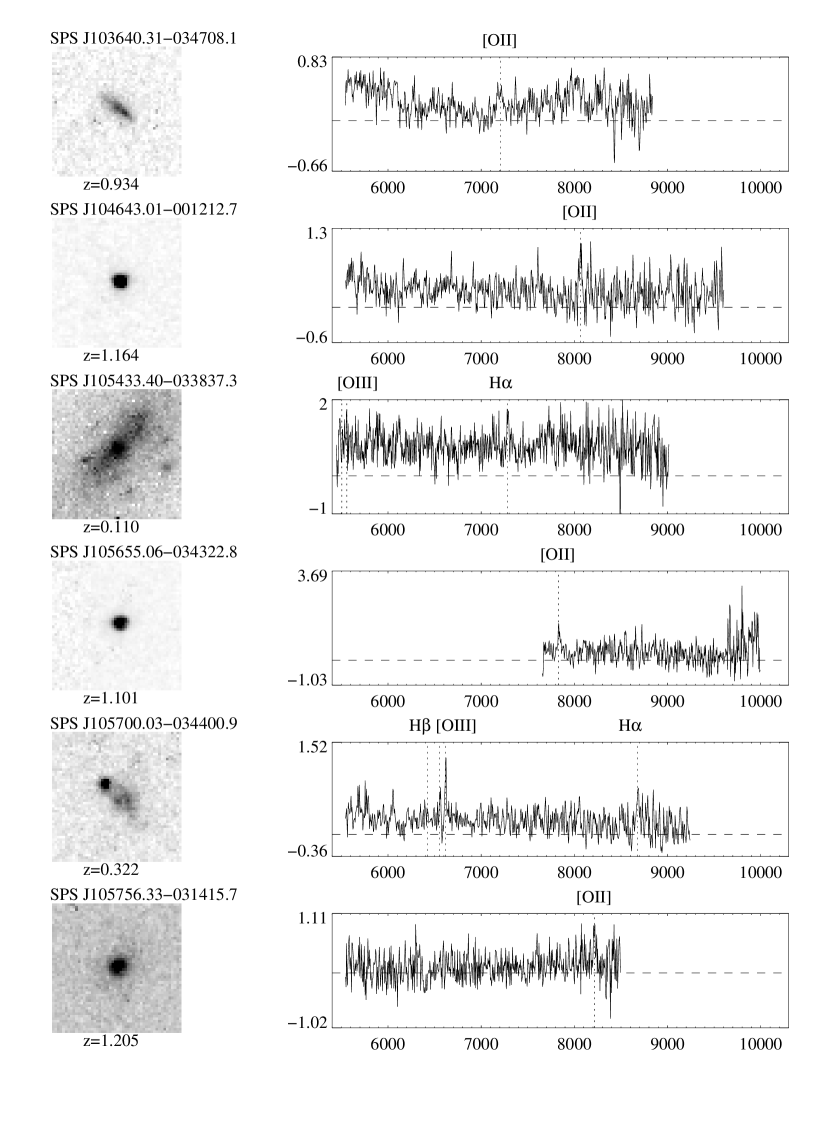
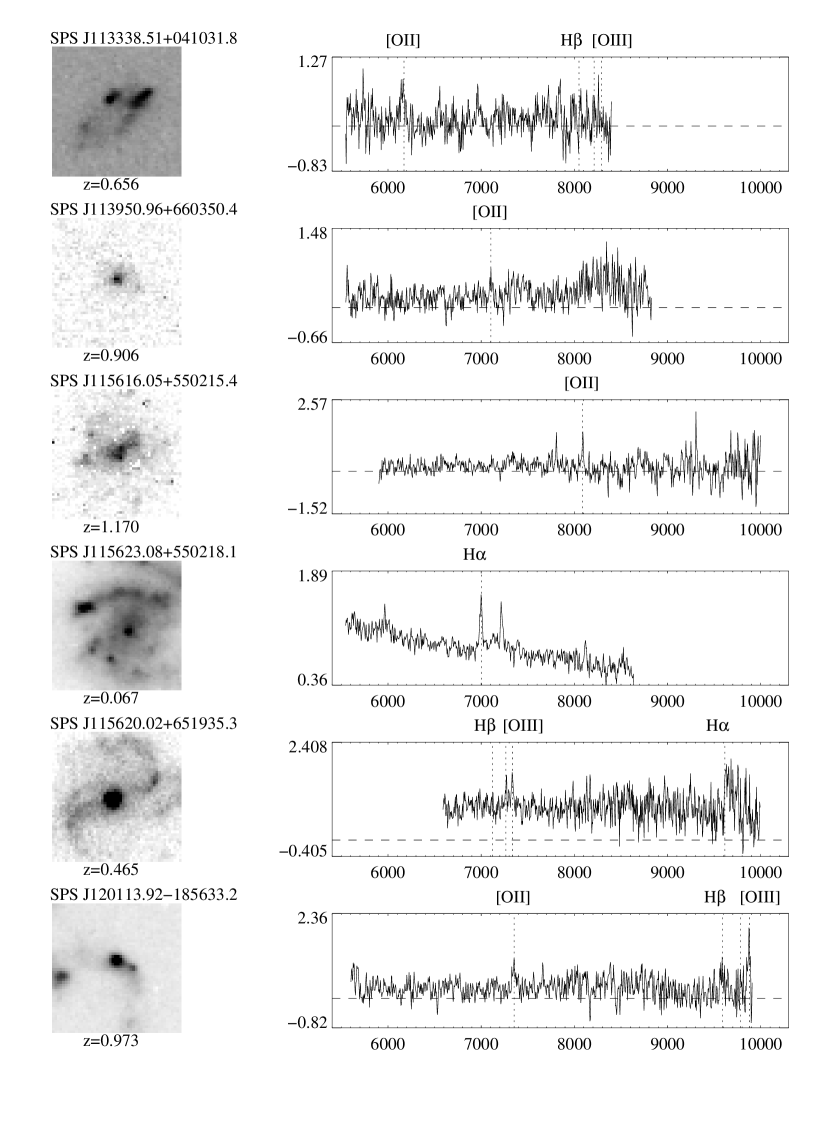
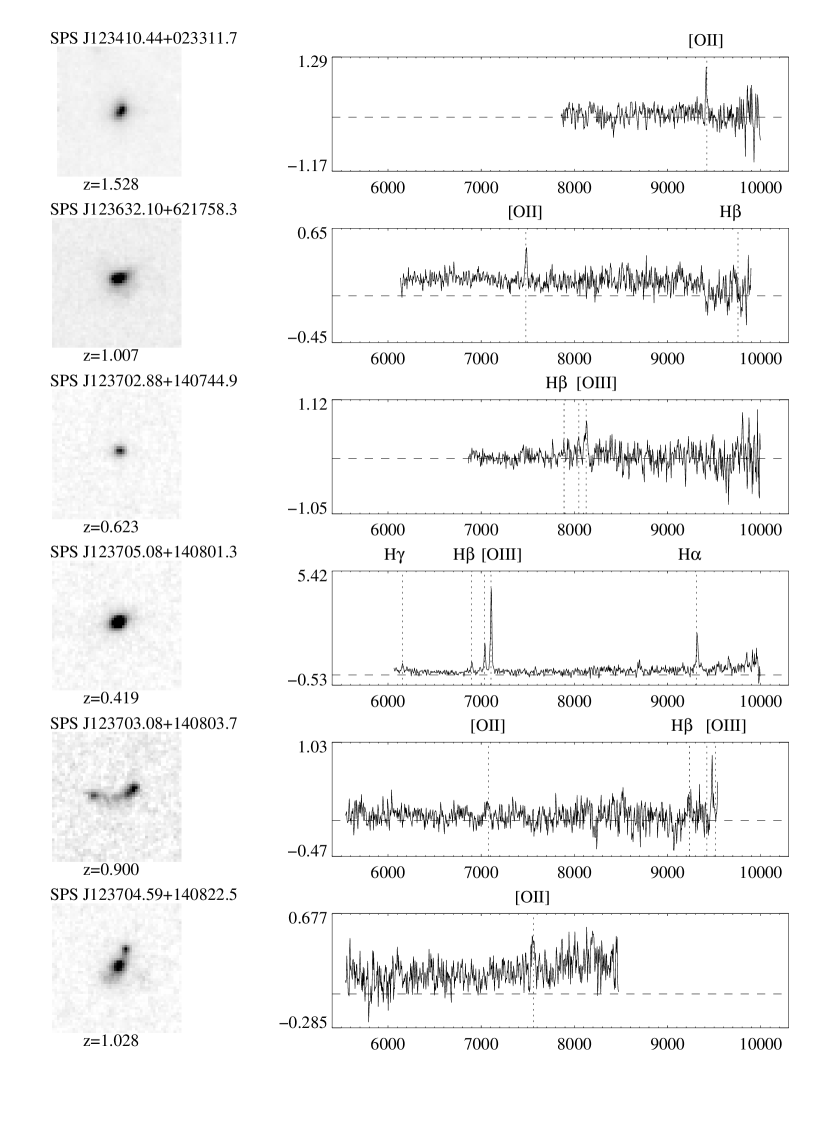
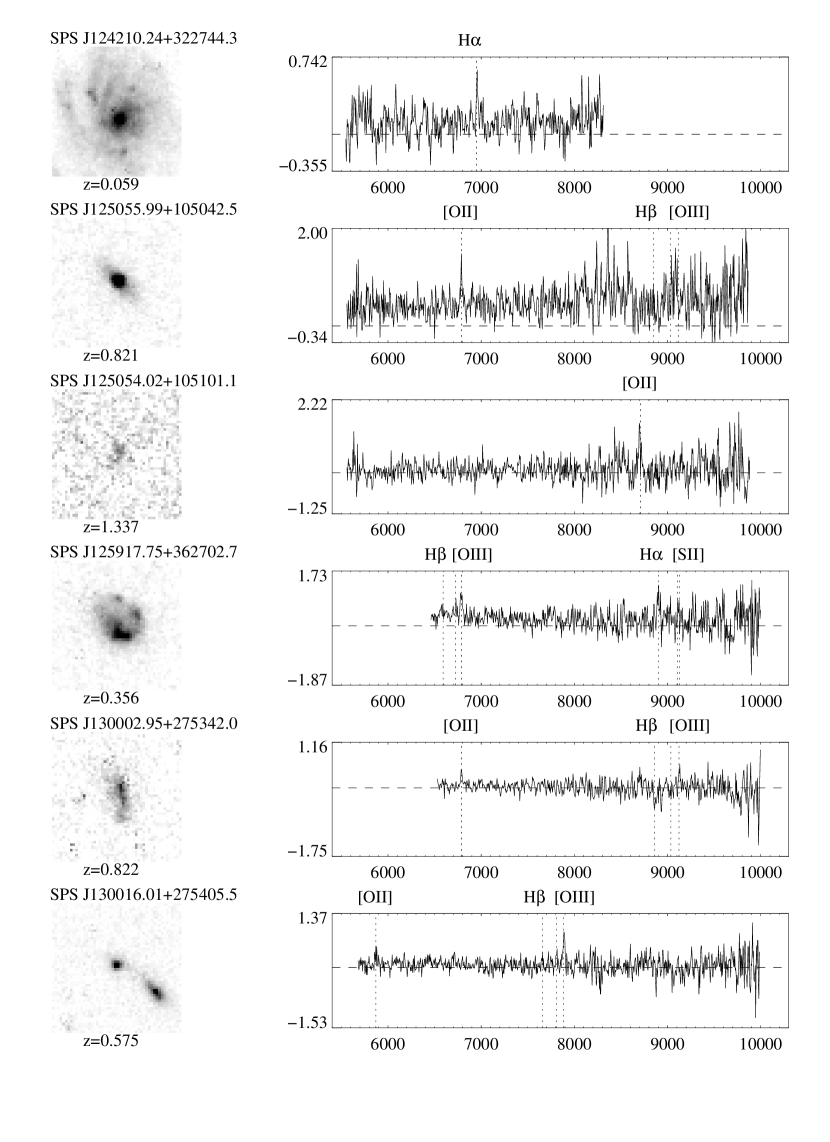
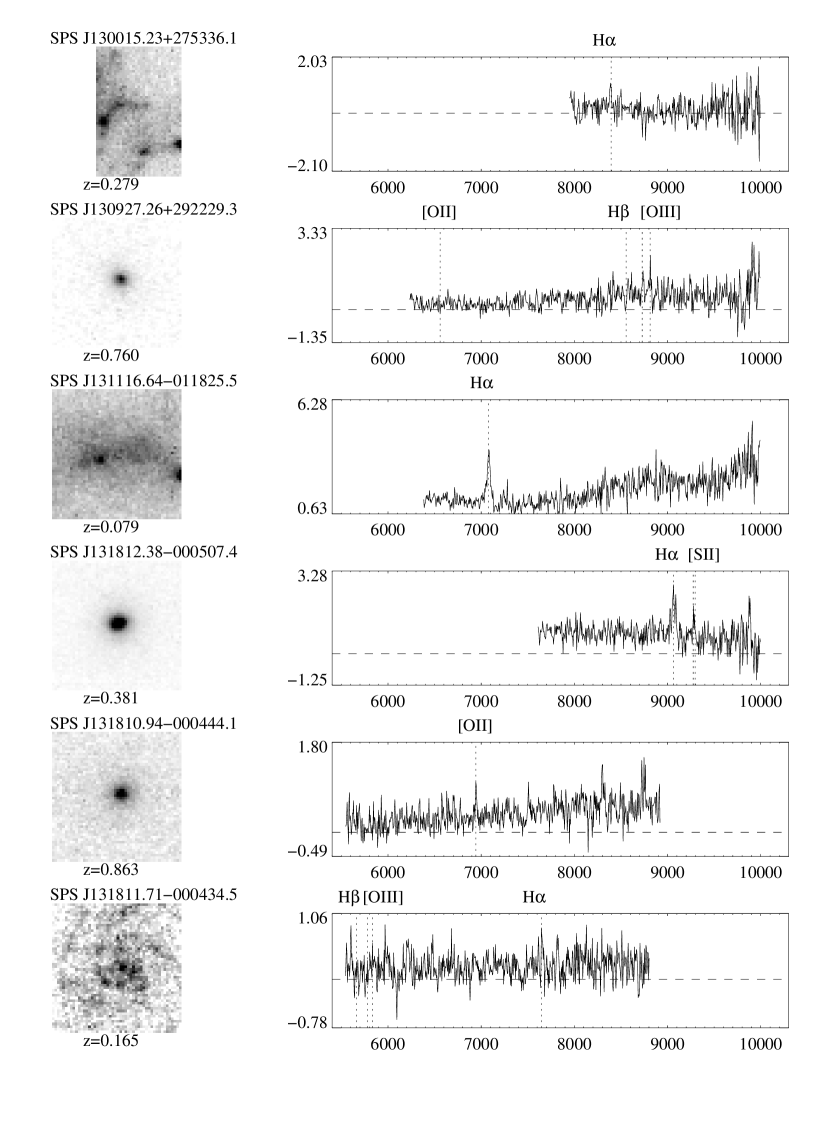
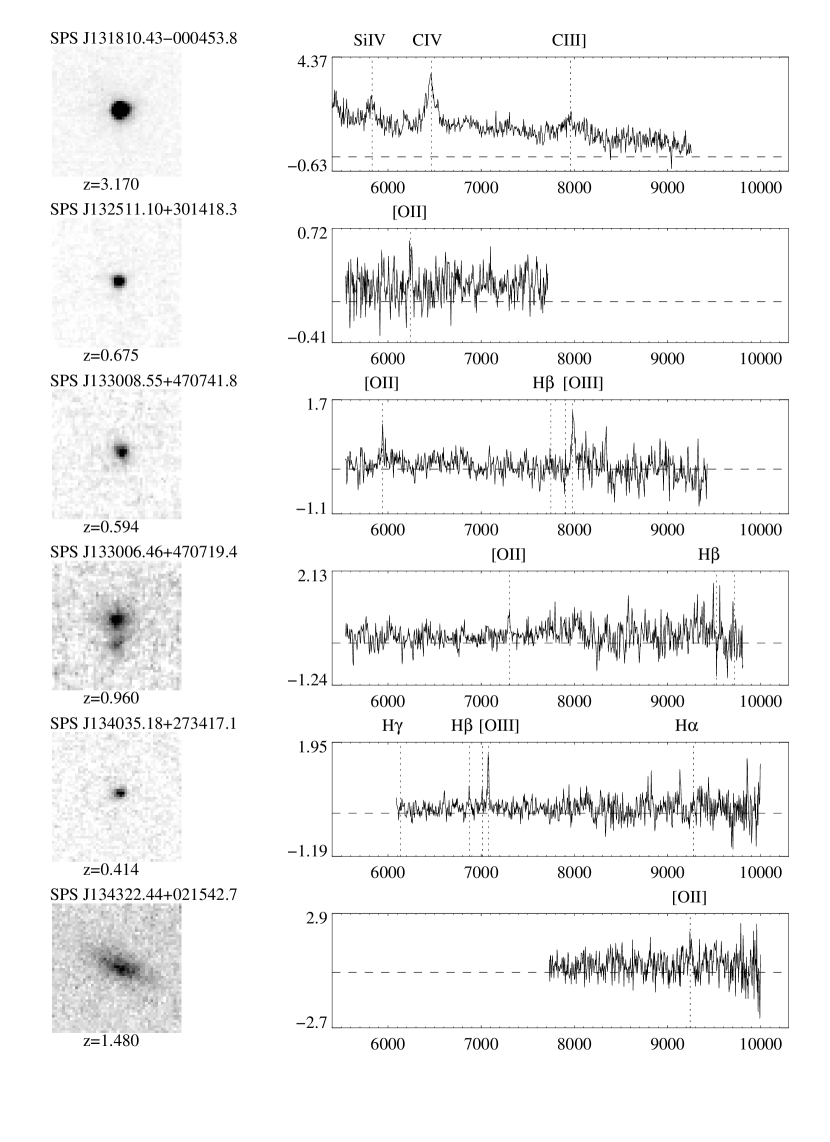
We detected 131 emission line objects in the deep SPS fields. The direct image and extracted spectrum of each object are shown in figure 3-24. Each object is described in Table 3. Column (1) lists the name of the object; columns (2) and (3) give the position of the object based on the SExtractor pixel coordinates transformed to the World Coordinate System, which for HST images is good to better than 1′′; column (4) gives the redshift, and column (5) the redshift quality flag; column (6) lists the photometric magnitude in the filterless direct image; columns (7)-(9) give morphological parameters measured by SExtractor; and column (10) lists the strongest lines detected in the spectrum. Line fluxes were only measured for those objects where the integrated flux for the entire galaxy could be obtained; low redshift objects with hotspot or diffuse emission were not measured, and are flagged with redshift quality flag 0. Table 4 gives the emission line measurements. Column (1) is the object name and column (2) is the measured line; columns (3)-(5) give the line flux, its signal-to-noise ratio, and the equivalent width; column (6) gives the approximate continuum signal-to-noise in one resolution element near the wavelength of the line. The continuum is measured over many resolution elements; however, the low signal-to-noise in the continuum measurements demonstrates the large uncertainty in the EW measurements.
4.1 Notes On Individual Objects
SPS J082344.12+292351.3 – The [OIII]4959 line may be contaminated by a bad pixel.
SPS J095240.06+435834.9 – This object shows three strong nuclei, suggesting either a triple nucleus or a projection of three edge on galaxies which appear “stacked.” Emission lines are detected only from the nucleus closest to the bottom of the image.
SPS J095628.10+694551.9 – This bright spiral shows probable H emission from knots on the spiral arm.
SPS J100051.56+250858.6 – There are two objects in the same row that could be associated with the emission line. We assume that the line is associated with the brighter one.
SPS J103640.31-034708.1 – The blue end of the continuum (up to 6000 Å) is contaminated by a bright object in the same row.
SPS J105700.03-034400.9 – The object has a bright nucleus, perhaps indicating AGN, and a region of extended continuum suggesting a tail or jet. The continuum is contaminated by bright galaxy on the same row.
SPS J105708.69-034310.8 – There is a slight difference in inferred redshift from [OIII] and H. They differ by 5Å from the prediction of the other.
SPS J105708.06-034320.1 – This object has multiple nuclei in a “train wreck” morphology.
SPS J112057.83+232306.6 – This object has a single emission line from the nucleus, although it has arm-like extensions from which no emission is seen.
SPS J115623.08+550218.1 – This spiral or irregular galaxy does not show a strong nucleus in the direct image, but has very bright knots, at least 3 of which show strong H emission.
SPS J120113.92-185633.2 – This object appears to have two nuclei, perhaps indicating that it is the result of an interaction or merger, but only one of the nuclei shows strong line emission.
SPS J123102.59+121424.8 – This late-type spiral or irregular galaxy has many knots. The nucleus shows clear H,[OIII], and H emission.
SPS J123348.78+023212.4 – The object is very diffuse; nevertheless, the line looks definite on the dispersed image.
SPS J123703.08+140803.7 – The objects appears to be the result of a merger or interaction of two objects. They are spatially separated along .
SPS J130015.23+275336.1 – This spiral/irregular galaxy has many knots of bright continuum emission. Some of the galaxy is outside the frame. The nucleus and a few of the knots have a weak emission line, most likely H.
SPS J131810.43-000453.8 – A point source with strong rest-frame UV emission lines, identified to be a quasar at z=3.17.
SPS J132511.10+301418.3 – The continuum spectrum may be contaminated by other objects in the same row.
SPS J134429.63-000909.6 – This object is a spiral galaxy with bright knots and also faint, extended continuum. The emission line from the bar looks double in spectrum, so it maybe emitted from two hotspots, though they are hard to match up with direct image.
SPS J134608.36+015922.6 – This object shows an emission line from a double nucleus. The line appears offset in wavelength in the spectrum, because it is offset along the row. The flux measurement is the sum of the flux from both nuclei.
SPS J134721.93+021407.2 and SPS J134721.97+021405.7 – A bright galaxy and a faint companion with a double nucleus appear to be at the same redshift, though perhaps the companions are simply knots in the outer regions of the galaxy itself. The companion shows relatively stronger oxygen emission than the galaxy. Also, the spacing between the nuclei is the same as the spacing between 5007 and 4959, so that the 5007 line from the left nucleus coincides with 4959 from right nucleus; we measure 5007 from the right nucleus.
SPS J160956.65+653334.6 – This bright galaxy shows strong emission lines including [FeVII]5721 and [OI]6300, at . The direct image of the source is not dominated by a bright nucleus, and we infer that the object is a Seyfert.
SPS J162357.69+262830.2 – This object has strong emission lines including [FeVI], and is likely a Seyfert 1. The direct image shows a strong nucleus, but the lines appear to originate mostly in the nebulosity offset from the nucleus by pixels.
SPS J162354.88+262803.5 – This bright galaxy has a previously reported redshift of as a member of the galaxy cluster MS , which is centered at near this field, by the Canadian Network for Observation Cosmology survey (CNOC; Ellingson et al. 1997). The [OII] line that was likely the basis of the CNOC redshift is clearly detected in the SPS spectrum, but there the H and [OIII] doublet are absent (they would not have been within the wavelength coverage for CNOC). The CNOC redshift is supported by its membership in the galaxy cluster, and thus it is likely that this galaxy is an example of a strong [OII] emitter which we would have flagged as a problem (quality flag 2).
SPS J162341.40+263433.0 – The continuum may be contaminated by another object along . This object has previously been reported by Ellingson et al. (1997) to be a likely member of the z=0.4275 cluster MS1621.5+2640. There is a strong line in the spectrum that we interpret as H at z=0.369. If the cluster redshift were accurate, that line would be [OI]6300, but no [OIII] or H would be present in the spectrum.
SPS J164042.82+463843.1 – This spiral galaxy shows stronger line emission from the lower arm than the nucleus.
SPS J171605.64+670411.9 – The direct image of this galaxy shows strong continuum emission from a regular, S0 type morphology, but connected to a fainter “loop”. Likely H emission is seen both in the galaxy and faintly in the loop. The morphology is suggestive of an interaction.
SPS J201756.69-704702.1 – This object is a low redshift spiral with many knots. At least one knot has a clearly detectable emission line, most likely H.
SPS J204757.09-194653.3 – This object shows strong [OIII] emission but relatively weak Balmer emission, suggestive of an AGN. The direct image is only marginally resolved (FWHM = 2.8 pixels).
SPS J204757.58-194718.3 – This huge spiral galaxy has at least 15 distinct knots in the direct image, most showing H emission in the spectrum. The inferred redshift of is consistent within the uncertainty with the previously reported value of ( De Carvalho et al. 1997).
SPS J224025.90-054736.3 – This object appears to have three nuclei, with line emission clearly visible from all three in the dispersed image.
SPS J224015.89-055449.7 – This spiral galaxy has at least ten knots of continuum emission, some of which also show clear H emission.
SPS J235158.92+243041.4 – This spectacular spiral has many knots in the direct image, some of which show probable H emission.
4.2 Notes On Individual Fields
J094317.0+465333.3 – This field represents a surprising non-detection. The field is located near the z=0.41 cluster Abell 0851, and contains a candidate cluster member from the [OII] emission-line search conducted by Martin et al. (2000). The wavelength of redshifted [OII] at z=0.41 is not accessible to the SPS, but the candidate object shows no [OIII],H, or H emission in the SPS spectrum. The on-band flux excess of the Martin et al. candidate would have been in the spectrum. The morphology of the object is extremely irregular, and the galaxy covers many pixels. If the line emission is not primarily from a single hotspot it is likely that the emission lines are too faint to be detected in the spectrum.
J123630.1+621745.5 – This field is one of the deepest STIS parallels. Chen et al. (1999, 2000) searched this field for high redshift Ly-emitters, but none were conclusively detected (see also Stern et al. 2000). We only detect two emission line objects at .
5 Discussion
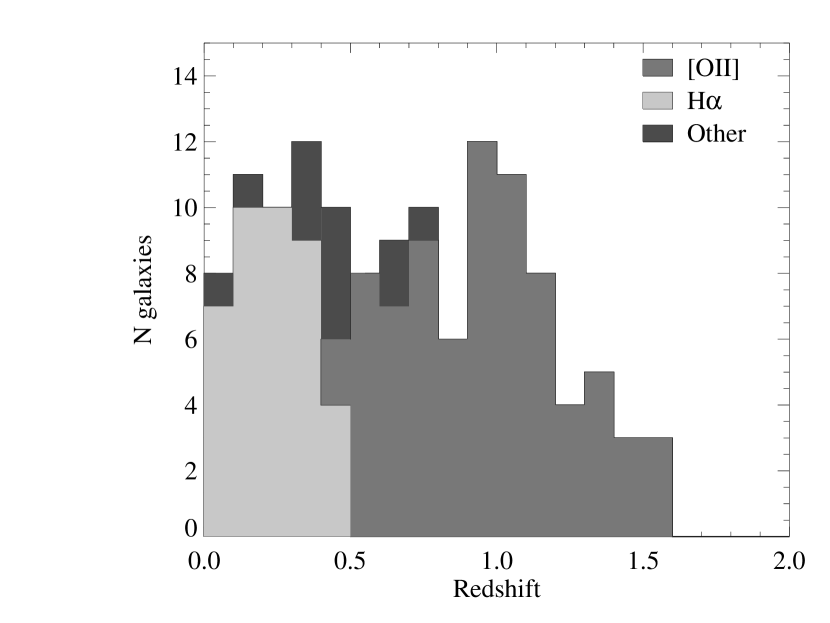
The deep SPS fields cover 160 square arcminutes (with 141 square arcminutes of usable area) along 219 distinct lines of sight. 131 objects with emission lines were identified. Forty-four fields have multiple emission line objects. Emission-line redshifts are inferred ranging from z=0.034 to z=1.548. Seventy-eight objects are identified as having [OII] emission, of which 13 also have other emission lines. Forty objects are identified primarily with H emission, and 13 with [OIII] or H in the absence of H and [OII]. Of these, 37 have secure redshifts (multiple lines; quality 4), 25 have quality 3, 28 have poor redshifts (quality 1), 15 have problem redshifts (quality 1.5 or 2), and 26 appear to have H emission for which we do not measure line fluxes.
Figure 25 shows the distribution of inferred redshifts. The detection of objects falls off at the edges of the wavelength range as the sensitivity drops. At the lowest redshifts, the falloff in H objects is attributable to the small volume covered by the survey. Figure 26 shows the distribution of apparent magnitude.
A rough calculation of the density of detected objects can be made by considering the [OII]-emitters detected at the redshifts that place the [OII] line in the good regions of the sensitivity curve, (). The SPS surveys a comoving volume of Mpc3 for (or Mpc3 for ) between those redshifts, and detects 63 [OII]-emitters, giving a comoving number density of Mpc-3. This density is slightly higher than that detected by the NICMOS parallels at (McCarthy et al. 1999). As McCarthy et al. (1999) point out, this density is lower than the density of galaxies brighter than today (Ellis et al. 1996), not all of which are star-forming, but is comparable to that of Lyman Break Galaxies at (Steidel et al. 1996). The SPS sample of [OII] emitters is sufficient to measure the comoving star-formation density at a median , and we will present that analysis in Paper II.
The SPS fields provide promising results for the detection of intermediate redshift galaxies in optical slitless spectroscopy of random fields. While the survey is subject to a number of biases (towards compact objects and away from low equivalent width lines), it is an efficient means to detect distant, faint galaxies. The high resolution of the direct images should also enable a study of the morphological properties of intermediate redshift galaxies. The installation of the Advanced Camera for Surveys (ACS; Ford et al. 2001) on HST will make a more extensive survey possible in the coming years. With its larger field of view and filtered imaging capabilities, ACS will refine the procedures developed for the SPS program.
References
- (1)
- (2) Baum, S., et al. 1996, STIS Instrument Handbook, Version 1.0 (Baltimore, STScI)
- (3)
- (4) Becker, R. H., White, R. L., & Helfand, D. J. 1995, ApJ, 450, 559
- (5)
- (6) Bertin, E. & Arnouts, S. 1996, A&AS, 117, 393
- (7)
- (8) Chen, H.-W., Lanzetta, K. M., & Pascarelle, S. 1999, Nature, 398, 586
- (9)
- (10) Chen, H.-W., Lanzetta, K. M., Pascarelle, S., & Yahata, N. 2000, Nature, 408,562
- (11)
- (12) Cohen, J. G., Hogg, D. W., Blandford, R., Cowie, L. L., Hu, E., Songaila, A., Shopbell, P., & Richberg, K. 2000, ApJ, 538, 29
- (13)
- (14) Cristiani, S.,et al. 2000, A&A, 359, 489
- (15)
- (16) De Carvalho, R. R., Ribeiro, A. L. B., Capelato, H. V., & Zepf, S. E. 1997, ApJS, 110, 1
- (17)
- (18) Dressler, A., & Gunn, J. E. 1992, ApJS, 78, 1
- (19)
- (20) Ellingson, E., Yee, H. K. C., Abraham, R. G., Morris, S. L., Carlberg, R. G., & Smecker-Hane, T. A. 1997, ApJS, 113,1
- (21)
- (22) Ellis, R. S., Colless, M., Broadhurst, T., Heyl, J., & Glazebrook, K. 1996, MNRAS, 280,235
- (23)
- (24) Ford, H. C.; Advanced Camera for Surveys Science Team 2001, BAAS, 199.0802
- (25)
- (26) Gardner, J.P., et al. 1998, ApJ, 492, L99
- (27)
- (28) Giacconi, R., et al. 2002, ApJS, 139, 369
- (29)
- (30) Godwin, Metcalfe, & Peach 1983, MNRAS, 202, 113
- (31)
- (32) Griffiths, R.E., et al. 1994, ApJ, 435, L19
- (33)
- (34) Gruppioni, C., Zamorani, G., De Ruiter, H. R., Parma, P., Mignoli, M., & Lari, C. 1997, MNRAS, 286, 470
- (35)
- (36) Hammer, F., et al. 1997, ApJ, 481, 49
- (37)
- (38) Hu, E. M., McMahon, R. G., & Egami, E. 1996, ApJ, 459, L53
- (39)
- (40) Infante, L., Pritchet, C. J., & Hertling, G. 1995, Journal of Astronomical Data, 1, 2
- (41)
- (42) Izotov, Y. I., Thuan, T. X., Lipovetsky, V. A. 1994, ApJ, 435, 647
- (43)
- (44) Kennicutt, R.C., Jr. 1992, ApJ, 338, 310
- (45)
- (46) Kennicutt, R. C., Jr. 1998, ARA&A, 36, 189
- (47)
- (48) Kimble, R.A., et al. 1998, ApJ, 492, L83
- (49)
- (50) Kobulnicky, H.A., Kennicutt. R.C. Jr., & Pizagno, J.L. 1999, ApJ 514, 544
- (51)
- (52) Maddox, S. J., Sutherland, W. J., Efstathiou, G., & Loveday, J. 1990, MNRAS, 243, 692
- (53)
- (54) Margoniner, V., & De Carvalho, R. 2000, AJ, 119, 1562
- (55)
- (56) Martin, C., Lotz, J., & Ferguson, H. 2000, ApJ, 543, 97
- (57)
- (58) McCarthy, P.J., et al. 1999, ApJ,520, 548
- (59)
- (60) Oort, M. 1987, A&AS, 71,221
- (61)
- (62) Pettini, M., Shapley, A.E., Steidel, C.C., Cuby, J.-G., Dickinson, M., Moorwood, A.F.M., Adelberger, K.L., & Giavalisco, M. 2001, ApJ, 554, 981
- (63)
- (64) Steidel, C.C., Giavalisco, M., Pettini, M., Dickinson, M., & Adelberger, K.L., 1996, ApJ Letters 462, L17
- (65)
- (66) Stern, D., Eisenhardt, P., Spinrad, H., Dawson, S., van Breugel, W., Dey, A., de Vries, W., & Stanford, S.A. 2000, Nature, 408, 560
- (67)
- (68) Storrie-Lombardi, L. J., McMahon, R. G., Irwin, M. J., & Hazard, C. 1996, ApJ, 468, 121
- (69)
- (70) Teplitz, H.I., et al. 2000,ApJ, 533, L65
- (71)
- (72) Teplitz, H.I, Collins, N.R, Gardner, J.P., Hill, R.S., & Rhodes, J. 2002 submitted
- (73)
- (74) Terlevich, R., Melnick, J., Masegosa, J., Moles, M., Copetti, M. V. F. 1991, A&AS, 91, 285
- (75)
- (76) Thompson, R. I., Rieke, M., Schneider, G., Hines, D. C., & Corbin, M. R. 1998, ApJ, 492, L95
- (77)
- (78) Williams, R.E., et al. 1996, AJ, 112, 1335
- (79)
- (80) Yan, L., McCarthy, P.J., Freudling, W., Teplitz, H.I., Malumuth, E.M., & Weymann, R.J., Malkan, M.A. 1999, ApJ, 519, L47
- (81)
- (82)
- (83)
| (2000) | (2000) | Img. Exptime | Spc. Exptime | 1 flux11( erg cm-2 s-1) | area |
|---|---|---|---|---|---|
| (s) | (s) | (sq. arcmin.) | |||
| 00 16 2.0 | +15 47 9.5 | 600 | 3638 | 5 | 0.63 |
| 00 16 27.9 | +16 01 46.9 | 600 | 3631 | 5 | 0.43 |
| 00 17 17.1 | +16 02 20.8 | 600 | 3630 | 4 | 0.64 |
| 00 17 26.8 | +15 48 8.2 | 600 | 3632 | 5 | 0.64 |
| 00 37 25.7 | +09 07 28.9 | 1350 | 5239 | 19 | 0.55 |
| 00 38 4.3 | +13 18 11.8 | 1700 | 4284 | 5 | 0.58 |
| 01 00 31.9 | -33 28 21.6 | 1200 | 7200 | 4 | 0.67 |
| 01 03 29.8 | +13 15 15.3 | 7296 | 4953 | 4 | 0.64 |
| 01 04 13.4 | +21 51 47.7 | 4634 | 5391 | 5 | 0.67 |
| 01 07 36.9 | +16 36 35.3 | 1400 | 3507 | 5 | 0.67 |
| 01 37 58.5 | -24 30 34.9 | 2200 | 5562 | 4 | 0.67 |
| 02 10 48.6 | -39 33 26.1 | 1668 | 5071 | 5 | 0.63 |
| 02 28 5.1 | +00 42 36.1 | 700 | 3384 | 8 | 0.67 |
| 02 28 26.6 | -01 14 29.4 | 1000 | 4362 | 6 | 0.67 |
| 02 28 33.7 | +01 19 15.2 | 736 | 3546 | 11 | 0.67 |
| 02 35 25.4 | +03 51 50.1 | 600 | 3600 | 6 | 0.67 |
| 02 36 21.0 | +06 50 31.1 | 600 | 3600 | 5 | 0.67 |
| 02 40 29.5 | -01 34 35.5 | 600 | 3600 | 5 | 0.65 |
| 02 40 30.4 | -01 36 33.3 | 1450 | 6000 | 4 | 0.67 |
| 02 40 31.7 | -01 35 41.9 | 900 | 5400 | 5 | 0.67 |
| 02 42 5.0 | -34 02 1.4 | 1200 | 7200 | 4 | 0.67 |
| 03 02 10.9 | +00 11 55.3 | 300 | 3321 | 6 | 0.65 |
| 03 02 20.8 | +00 11 53.9 | 300 | 3326 | 6 | 0.65 |
| 03 02 30.8 | +00 12 12.6 | 300 | 3294 | 7 | 0.66 |
| 03 12 40.6 | -55 25 36.9 | 1250 | 4247 | 4 | 0.44 |
| 03 13 9.1 | -55 25 21.1 | 2921 | 3384 | 4 | 0.50 |
| 03 13 53.8 | -55 01 14.1 | 2600 | 3440 | 4 | 0.53 |
| 03 14 1.8 | -55 25 8.4 | 600 | 4500 | 5 | 0.57 |
| 03 14 20.3 | -54 55 21.9 | 600 | 4500 | 4 | 0.65 |
| 03 14 40.6 | -55 06 17.4 | 1550 | 5382 | 4 | 0.52 |
| 03 15 24.2 | -55 39 9.5 | 1550 | 5382 | 4 | 0.61 |
| 03 15 47.8 | -55 15 35.1 | 3042 | 4580 | 4 | 0.46 |
| 03 20 21.5 | +15 29 12.8 | 1300 | 6678 | 7 | 0.66 |
| 03 24 20.4 | -36 28 16.4 | 1400 | 3448 | 5 | 0.67 |
| 03 28 49.9 | +03 00 51.3 | 1580 | 7385 | 4 | 0.67 |
| 03 31 44.8 | -27 44 57.4 | 3900 | 3386 | 6 | 0.67 |
| 03 31 49.9 | -27 41 24.4 | 2700 | 3602 | 5 | 0.66 |
| 03 32 6.0 | -27 44 15.4 | 3900 | 3497 | 5 | 0.66 |
| 03 41 36.2 | -44 55 32.4 | 1976 | 8961 | 4 | 0.66 |
| 03 42 4.7 | -29 50 49.0 | 4800 | 31800 | 5 | 0.64 |
| 03 54 31.0 | -49 39 32.8 | 3200 | 16677 | 3 | 0.63 |
| 03 59 51.1 | -44 30 41.4 | 450 | 3290 | 5 | 0.67 |
| 04 14 21.2 | +04 14 3.3 | 1350 | 4973 | 8 | 0.67 |
| 04 24 26.6 | +02 00 48.1 | 603 | 3884 | 5 | 0.67 |
| 04 54 35.1 | -53 25 14.6 | 11100 | 7777 | 4 | 0.67 |
| 05 46 24.6 | -51 08 6.1 | 450 | 3392 | 5 | 0.67 |
| 08 18 44.1 | +56 50 29.8 | 1200 | 4864 | 4 | 0.65 |
| 08 19 31.6 | +70 50 21.3 | 1900 | 3000 | 9 | 0.63 |
| 08 23 45.7 | +29 23 43.2 | 600 | 6000 | 5 | 0.66 |
| 08 28 36.8 | +34 37 56.0 | 1400 | 3226 | 6 | 0.67 |
| 08 37 33.7 | +69 50 47.2 | 5834 | 4923 | 6 | 0.67 |
| 08 42 2.5 | +70 42 39.2 | 1900 | 3000 | 9 | 0.65 |
| 08 48 38.2 | +44 48 37.5 | 1500 | 13578 | 3 | 0.55 |
| 08 49 3.3 | +44 52 45.7 | 4350 | 4432 | 45 | 0.56 |
| 08 49 5.2 | +44 50 17.9 | 6300 | 3591 | 7 | 0.67 |
| 08 49 10.7 | +37 26 12.1 | 700 | 3000 | 9 | 0.58 |
| 08 49 14.9 | +44 54 59.2 | 3250 | 3216 | 6 | 0.59 |
| 09 19 43.1 | +33 40 21.8 | 900 | 4167 | 6 | 0.67 |
| 09 22 13.6 | +50 51 25.4 | 3700 | 11606 | 4 | 0.67 |
| 09 27 0.0 | -05 34 1.0 | 750 | 4467 | 5 | 0.67 |
| 09 28 6.6 | -05 05 4.5 | 603 | 4045 | 5 | 0.64 |
| 09 28 30.2 | -05 01 26.1 | 2250 | 14252 | 3 | 0.66 |
| 09 31 28.4 | -04 41 55.0 | 2723 | 3656 | 5 | 0.67 |
| 09 33 39.5 | +55 09 39.6 | 1200 | 7266 | 3 | 0.67 |
| 09 43 15.0 | +48 08 18.7 | 2250 | 11164 | 4 | 0.64 |
| 09 43 16.9 | +46 56 3.3 | 600 | 3036 | 11 | 0.66 |
| 09 43 17.0 | +46 53 33.3 | 600 | 3153 | 5 | 0.64 |
| 09 45 54.6 | -08 41 24.2 | 635 | 4523 | 5 | 0.67 |
| 09 48 10.0 | +13 11 50.0 | 450 | 4410 | 5 | 0.67 |
| 09 52 37.1 | +43 58 36.3 | 2603 | 5696 | 4 | 0.66 |
| 09 56 18.3 | +69 45 37.0 | 1300 | 4800 | 5 | 0.66 |
| 09 56 23.8 | +69 45 40.6 | 1050 | 6000 | 5 | 0.67 |
| 09 56 30.3 | +47 29 8.9 | 1500 | 7158 | 4 | 0.67 |
| 09 57 6.6 | +69 36 48.7 | 867 | 3838 | 4 | 0.65 |
| 10 00 52.8 | +25 08 36.6 | 1800 | 3162 | 5 | 0.66 |
| 10 07 41.9 | +10 20 45.9 | 1450 | 5830 | 5 | 0.67 |
| 10 20 50.7 | +36 52 10.6 | 606 | 3902 | 5 | 0.67 |
| 10 24 28.3 | +47 13 31.3 | 1650 | 3147 | 5 | 0.67 |
| 10 24 28.3 | +47 13 31.7 | 2150 | 11213 | 3 | 0.67 |
| 10 35 47.9 | -03 41 34.4 | 900 | 3600 | 5 | 0.61 |
| 10 35 49.8 | -03 41 21.4 | 900 | 3600 | 5 | 0.68 |
| 10 36 41.0 | -03 47 12.5 | 1547 | 7317 | 4 | 0.66 |
| 10 38 58.2 | +41 46 45.7 | 5200 | 21000 | 15 | 0.54 |
| 10 46 42.7 | -00 12 18.7 | 2200 | 4098 | 5 | 0.66 |
| 10 54 5.8 | -03 43 53.0 | 1609 | 7412 | 5 | 0.62 |
| 10 54 32.8 | -03 38 56.9 | 610 | 3232 | 5 | 0.67 |
| 10 54 32.9 | -03 39 47.0 | 472 | 3380 | 5 | 0.67 |
| 10 56 24.7 | -04 19 34.4 | 1515 | 9353 | 4 | 0.65 |
| 10 56 54.8 | -03 42 58.5 | 2268 | 4010 | 5 | 0.66 |
| 10 56 59.4 | -03 44 8.2 | 3388 | 4861 | 5 | 0.61 |
| 10 56 59.6 | -03 40 38.2 | 3388 | 4799 | 5 | 0.59 |
| 10 57 4.2 | -03 41 47.3 | 2618 | 4001 | 5 | 0.66 |
| 10 57 8.9 | -03 42 57.7 | 3788 | 4925 | 5 | 0.67 |
| 10 57 25.9 | -03 38 12.1 | 756 | 4464 | 5 | 0.63 |
| 10 57 31.1 | -03 19 2.8 | 1359 | 8132 | 4 | 0.67 |
| 10 57 58.1 | -03 14 16.5 | 1095 | 3306 | 5 | 0.68 |
| 11 01 38.4 | -12 11 23.4 | 300 | 3516 | 5 | 0.67 |
| 11 03 34.7 | +34 44 46.6 | 1247 | 5550 | 7 | 0.67 |
| 11 18 23.4 | +58 52 1.5 | 1437 | 9868 | 4 | 0.67 |
| 11 18 24.3 | +07 41 28.9 | 450 | 3796 | 18 | 0.66 |
| 11 20 58.0 | +23 23 14.0 | 1200 | 7769 | 4 | 0.66 |
| 11 20 58.4 | +23 25 0.2 | 2708 | 3863 | 5 | 0.67 |
| 11 33 37.7 | +04 10 46.0 | 2723 | 3656 | 5 | 0.66 |
| 11 39 47.2 | +66 03 54.2 | 1700 | 4889 | 5 | 0.67 |
| 11 39 50.6 | +66 03 36.8 | 1440 | 9094 | 4 | 0.67 |
| 11 44 13.3 | +19 52 23.9 | 1050 | 3522 | 7 | 0.67 |
| 11 45 6.9 | +49 47 13.4 | 900 | 9363 | 4 | 0.64 |
| 11 56 14.0 | +55 02 27.0 | 1050 | 3532 | 5 | 0.62 |
| 11 56 17.3 | +65 19 36.9 | 1550 | 4630 | 4 | 0.64 |
| 11 56 21.4 | +55 02 7.8 | 7610 | 42517 | 6 | 0.74 |
| 11 58 14.7 | +43 53 1.2 | 700 | 3322 | 7 | 0.42 |
| 12 01 14.7 | -18 56 25.1 | 5100 | 6059 | 5 | 0.66 |
| 12 05 23.1 | -07 42 33.5 | 2160 | 11317 | 3 | 0.75 |
| 12 13 41.5 | +17 14 2.1 | 1650 | 10424 | 5 | 0.66 |
| 12 17 17.2 | -03 15 49.2 | 1000 | 3320 | 8 | 0.67 |
| 12 19 3.9 | +47 08 20.6 | 4070 | 12279 | 3 | 0.67 |
| 12 26 27.2 | +31 07 34.2 | 1550 | 5096 | 13 | 0.67 |
| 12 28 23.1 | +12 36 22.4 | 2785 | 8038 | 4 | 0.67 |
| 12 28 34.5 | +02 07 25.1 | 12762 | 7206 | 4 | 0.61 |
| 12 30 20.2 | +12 28 55.0 | 900 | 4800 | 6 | 0.67 |
| 12 30 28.1 | +12 31 46.2 | 850 | 3217 | 5 | 0.65 |
| 12 31 0.8 | +12 14 20.7 | 1700 | 7518 | 6 | 0.67 |
| 12 31 1.3 | +12 14 18.3 | 1800 | 4722 | 17 | 0.67 |
| 12 31 1.7 | +12 14 16.1 | 1750 | 8517 | 6 | 0.67 |
| 12 31 4.1 | +12 14 38.6 | 3167 | 6778 | 7 | 0.63 |
| 12 31 9.2 | +12 16 0.1 | 753 | 5781 | 4 | 0.67 |
| 12 33 47.9 | +02 32 0.7 | 900 | 4991 | 6 | 0.64 |
| 12 34 2.2 | +02 49 26.2 | 820 | 5204 | 9 | 0.66 |
| 12 34 10.9 | +02 33 39.9 | 10200 | 51140 | 3 | 0.61 |
| 12 36 30.1 | +62 17 45.5 | 13400 | 48600 | 2 | 0.64 |
| 12 37 3.6 | +14 08 2.2 | 3350 | 17033 | 3 | 0.67 |
| 12 42 10.7 | +32 27 27.4 | 2043 | 7699 | 5 | 0.67 |
| 12 48 5.9 | +34 29 28.7 | 4649 | 8959 | 5 | 0.67 |
| 12 50 55.3 | +10 50 48.4 | 1000 | 3975 | 5 | 0.67 |
| 12 59 17.0 | +36 27 8.7 | 600 | 3548 | 5 | 0.67 |
| 12 59 41.5 | +36 12 17.1 | 647 | 3522 | 7 | 0.54 |
| 13 00 3.2 | +27 53 53.5 | 1848 | 10764 | 4 | 0.67 |
| 13 00 15.1 | +27 54 1.7 | 1546 | 7410 | 7 | 0.67 |
| 13 01 58.6 | +27 32 45.3 | 4400 | 20654 | 3 | 0.66 |
| 13 05 39.2 | +36 43 46.4 | 750 | 3870 | 4 | 0.65 |
| 13 08 45.5 | +29 11 11.7 | 1050 | 3315 | 6 | 0.64 |
| 13 08 59.9 | +29 20 34.4 | 450 | 3740 | 6 | 0.67 |
| 13 09 5.6 | +29 21 50.1 | 700 | 3422 | 6 | 0.67 |
| 13 09 27.4 | +29 22 40.0 | 600 | 3617 | 4 | 0.64 |
| 13 09 45.8 | +32 17 28.1 | 1200 | 5023 | 4 | 0.65 |
| 13 11 17.3 | -01 18 28.6 | 450 | 3774 | 24 | 0.61 |
| 13 12 55.6 | -19 26 25.6 | 1450 | 5622 | 7 | 0.64 |
| 13 18 11.5 | -00 04 51.3 | 750 | 4861 | 6 | 0.67 |
| 13 25 9.0 | +30 14 33.0 | 2150 | 6808 | 4 | 0.67 |
| 13 25 43.1 | -11 31 57.7 | 850 | 4056 | 6 | 0.66 |
| 13 30 8.3 | +47 07 33.7 | 750 | 4546 | 15 | 0.67 |
| 13 40 36.6 | +27 34 30.7 | 600 | 6000 | 4 | 0.67 |
| 13 43 23.8 | +02 15 54.8 | 606 | 3821 | 6 | 0.64 |
| 13 43 31.1 | +01 18 20.6 | 427 | 3001 | 6 | 0.52 |
| 13 43 40.2 | +01 22 2.2 | 606 | 3768 | 5 | 0.66 |
| 13 44 29.0 | -00 09 35.9 | 1700 | 5527 | 46 | 0.61 |
| 13 46 7.2 | +01 59 13.3 | 606 | 3709 | 5 | 0.67 |
| 13 47 22.1 | +02 13 46.8 | 427 | 3001 | 6 | 0.57 |
| 13 47 29.8 | +02 17 50.6 | 606 | 3764 | 5 | 0.67 |
| 13 47 54.3 | +07 46 40.1 | 2307 | 6570 | 4 | 0.67 |
| 13 52 59.0 | +31 29 13.9 | 1450 | 5212 | 6 | 0.48 |
| 14 00 50.4 | +62 19 30.7 | 600 | 4494 | 4 | 0.56 |
| 14 01 41.7 | +15 08 48.5 | 1744 | 5678 | 5 | 0.67 |
| 14 15 47.3 | +52 03 39.1 | 1098 | 4104 | 5 | 0.63 |
| 14 18 26.8 | +52 34 16.9 | 900 | 5400 | 4 | 0.57 |
| 14 24 26.8 | +23 00 6.3 | 1300 | 5943 | 4 | 0.67 |
| 14 29 52.7 | +42 05 12.4 | 710 | 3570 | 5 | 0.65 |
| 14 29 56.3 | +42 07 20.4 | 600 | 6000 | 4 | 0.49 |
| 14 41 30.9 | +53 24 35.0 | 2700 | 16200 | 4 | 0.61 |
| 14 44 50.5 | +38 45 11.9 | 450 | 4252 | 5 | 0.67 |
| 14 50 41.4 | +63 14 31.6 | 600 | 4306 | 4 | 0.68 |
| 15 08 18.3 | +02 32 43.7 | 753 | 5912 | 5 | 0.67 |
| 15 14 21.4 | +36 52 46.4 | 1713 | 5610 | 5 | 0.63 |
| 15 16 15.6 | -00 13 24.4 | 1750 | 5712 | 10 | 0.64 |
| 15 16 51.9 | +06 56 48.2 | 1500 | 9000 | 5 | 0.67 |
| 15 39 48.2 | +66 08 54.5 | 428 | 3407 | 23 | 0.67 |
| 15 50 4.9 | +21 23 19.9 | 900 | 5400 | 4 | 0.67 |
| 15 50 5.2 | +21 20 59.7 | 900 | 5400 | 5 | 0.61 |
| 16 02 5.0 | +43 14 47.0 | 850 | 4688 | 18 | 0.67 |
| 16 04 44.2 | +43 26 9.4 | 2900 | 12600 | 3 | 0.67 |
| 16 09 58.7 | +65 33 55.3 | 2400 | 14400 | 3 | 0.55 |
| 16 11 7.9 | +14 51 59.9 | 4350 | 11325 | 5 | 0.68 |
| 16 23 42.6 | +26 34 35.6 | 750 | 5086 | 11 | 0.68 |
| 16 23 57.1 | +26 28 5.2 | 1550 | 5394 | 13 | 0.65 |
| 16 24 43.3 | +23 40 58.5 | 5900 | 3476 | 5 | 0.67 |
| 16 25 13.3 | +23 48 58.1 | 1950 | 3000 | 7 | 0.69 |
| 16 32 18.0 | +37 28 43.5 | 600 | 3342 | 4 | 0.67 |
| 16 40 43.1 | +46 38 59.7 | 1600 | 10157 | 3 | 0.65 |
| 16 44 34.3 | +23 42 19.7 | 600 | 3000 | 16 | 0.58 |
| 16 45 31.0 | +46 23 25.0 | 2183 | 6614 | 17 | 0.68 |
| 16 49 6.7 | +60 14 15.4 | 600 | 6660 | 4 | 0.68 |
| 17 01 28.4 | +64 15 58.0 | 837 | 4932 | 4 | 0.66 |
| 17 16 7.4 | +67 04 17.7 | 1860 | 8707 | 5 | 0.67 |
| 17 22 42.9 | +50 00 28.9 | 600 | 3600 | 5 | 0.62 |
| 17 23 21.3 | +50 01 17.4 | 1080 | 4320 | 5 | 0.82 |
| 20 17 57.9 | -70 46 58.3 | 5364 | 8057 | 5 | 0.66 |
| 20 47 56.6 | -19 46 59.0 | 2850 | 10861 | 5 | 0.60 |
| 20 50 51.2 | -57 05 3.4 | 303 | 3121 | 8 | 0.67 |
| 22 05 29.8 | +13 02 28.7 | 1244 | 5084 | 8 | 0.59 |
| 22 17 48.3 | +00 13 6.2 | 2500 | 4970 | 4 | 0.67 |
| 22 32 3.6 | +02 43 15.7 | 903 | 8645 | 5 | 0.60 |
| 22 40 14.6 | -05 54 52.0 | 1623 | 10746 | 5 | 0.64 |
| 22 40 24.1 | -05 48 3.2 | 900 | 3600 | 5 | 0.66 |
| 22 40 24.9 | -05 47 34.0 | 900 | 3600 | 5 | 0.66 |
| 22 46 32.6 | -00 47 25.3 | 750 | 4642 | 7 | 0.67 |
| 22 53 15.4 | -14 25 26.9 | 3350 | 24612 | 5 | 0.43 |
| 23 12 33.0 | +00 59 35.3 | 450 | 3840 | 6 | 0.67 |
| 23 12 37.7 | +00 58 25.4 | 450 | 3775 | 8 | 0.67 |
| 23 13 4.5 | +00 53 34.5 | 712 | 3785 | 6 | 0.67 |
| 23 13 4.5 | +00 51 14.5 | 604 | 3507 | 6 | 0.67 |
| 23 17 43.8 | -04 36 59.9 | 750 | 3595 | 14 | 0.66 |
| 23 24 36.2 | +28 04 6.2 | 592 | 3649 | 14 | 0.59 |
| 23 29 25.4 | +00 09 29.9 | 300 | 3750 | 6 | 0.67 |
| 23 48 41.8 | +00 56 48.7 | 6150 | 6011 | 4 | 0.64 |
| 23 50 38.0 | +27 10 4.6 | 900 | 8910 | 7 | 0.66 |
| 23 51 57.9 | +24 30 22.7 | 2826 | 10913 | 4 | 0.61 |
| 02 34 58.0 | +03 34 56.0 | 300 | 3600 | 5 | 0.66 |
| 12 35 24.2 | +62 14 32.4 | 2950 | 7200 | 4 | 0.61 |
| 12 35 24.7 | +62 14 55.8 | 2950 | 7200 | 4 | 0.66 |
|
|
| (2000) | (2000) | NED Objects | ref. 11
1 – Maddox et al. (1990); 2 – Gruppioni et al. (1997); 3 – Cristiani et al. (2000);
|
|---|---|---|---|
| 03 12 40.6 | -55 25 36.9 | APMUKS(BJ) B031118.74-553640.9 | 1 |
| 03 13 53.8 | -55 01 14.1 | [GZd97] 1.4GHz 20 & 21 | 2 |
| 03 14 1.8 | -55 25 8.4 | APMUKS(BJ) B031242.66-553605.6 | 1 |
| 03 14 40.6 | -55 06 17.4 | APMUKS(BJ) B031319.21-551732.9 | 1 |
| 03 32 6.0 | -27 44 15.4 | CDF-S22This field is a few arcminutes from the center of the Chandra Deep Field South (Giacconi et al. 2002).; EIS U21; z=3.462 | 3 |
| 08 48 38.2 | +44 48 37.5 | 65W 106 | 4 |
| 08 49 10.7 | +37 26 12.1 | FIRST J084910.4+37263 | 5 |
| 09 43 16.9 | +46 56 3.3 | ABELL 0851:[DG92] 044 | 6 |
| 09 43 17.0 | +46 53 33.3 | ABELL 0851:[MLF2000] 0756 | 7 |
| 10 56 24.7 | -04 19 34.4 | APMUKS(BJ) B105350.62-040334.8 | 1 |
| 12 05 23.1 | -07 42 33.5 | QSO 2MASSi J1205231-07423 (z=4.694)33This field was included in the Hu et al. (1996) Lyman- search for quasar companions. | 8 |
| 12 36 30.1 | +62 17 45.5 | HDF adjacent44This field, parallel to the Hubble Deep Field North (Williams et al. 1996) was analyzed independently by Chen et al. (1999,2000) and Stern et al. (2000). | |
| 13 00 15.1 | +27 54 1.7 | ABELL 1656:[GMP83] 2808 & 2835 | 9 |
| 13 08 45.5 | +29 11 11.7 | NGPFG 03247 & 05987 | 10 |
| 13 08 59.9 | +29 20 34.4 | NGPFG 04214,55512,05776, 08918,05777 | 10 |
| 13 09 5.6 | +29 21 50.1 | NGPFG 59295,08840,55461,08824, 48290 | 10 |
| 13 09 27.4 | +29 22 40.0 | NGPFG 08582, 04413,05510,04421,04405,04390,05521,04442 | 10 |
| 13 11 17.3 | -01 18 28.6 | Abell 1689 adjacent 55This field contains: APMUKS(BJ) B130842.46-010229.8, B130844.25-010243.7 (z=0.209498), [MD2000] J131117.984-011812.47, [MD2000] J131118.783-011843.00, [MD2000] J131119.214-011830.18 | 1,11 |
| 13 43 31.1 | +01 18 20.6 | APMUKS(BJ) B134057.62+013313.7, B134058.48+013347.0 | 1 |
| 16 23 42.6 | +26 34 35.6 | MS 1621.5+2640:[EYA97] 101200,101286,101376,101302, 101148,101311 | 12 |
| 16 23 57.1 | +26 28 5.2 | MS 1621.5+2640:[EYA97] 301086 z=0.47473 | 12 |
| 20 47 56.6 | -19 46 59.0 | HCG 087:[dRC97] 18 z=0.11526 | 13
|
| obj name | (2000) | (2000) | Redshift11The redshift uncertainty is . | z flag22Redshift flag:
|
50CCD33Photometry for the filterless direct image, given on the STMAG system. | FWHM | a/b | P.A. | range | Strong Lines |
|---|---|---|---|---|---|---|---|---|---|---|
| (arcsec) | (deg.) | (Å) | Detected | |||||||
| SPS J001716.56+160239.5 | 00:17:16.56 | 16:02:39.5 | 1.074 | 1 | 25.03 0.09 | 0.45 | 1.0 | -85 | 6343-10000 | [OII] |
| SPS J010030.43-332823.4 | 01:00:30.43 | -33:28:23.4 | 0.702 | 3 | 24.61 0.05 | 1.34 | 1.7 | -40 | 5300-8467 | [OII] |
| SPS J010329.80+131508.9 | 01:03:29.80 | 13:15:08.9 | 0.819 | 4 | 22.64 0.03 | 0.33 | 1.2 | -27 | 5392-10000 | [OII]-H-H-H-[OIII] |
| SPS J021048.23-393308.0 | 02:10:48.23 | -39:33:08.0 | 0.593 | 2 | 26.17 0.08 | 0.38 | 1.2 | 37 | 5300-8598 | [OII] |
| SPS J022828.08-011434.0 | 02:28:28.08 | -01:14:34.0 | 0.151 | 0 | 21.14 0.03 | 2.79 | 1.8 | 45 | 7123-10000 | H |
| SPS J030221.47+001150.644 SPS J030221.47+001150.6 is detected in the J030220.8+001153.9 field, while SPS J030210.18+001140.0 is detected in the J030210.9+001155.3 field. | 03:02:21.47 | 00:11:50.6 | 0.920 | 3 | 24.41 0.09 | 0.97 | 1.9 | -19 | 5300-9180 | [OII] |
| SPS J030210.18+001140.044 SPS J030221.47+001150.6 is detected in the J030220.8+001153.9 field, while SPS J030210.18+001140.0 is detected in the J030210.9+001155.3 field. | 03:02:10.18 | 00:11:40.0 | 1.092 | 1 | 25.20 0.13 | 0.45 | 1.3 | 50 | 5375-10000 | [OII] |
| SPS J031357.20-550113.5 | 03:13:57.20 | -55:01:13.5 | 0.688 | 3 | 23.13 0.03 | 0.72 | 1.3 | 62 | 5300-8445 | [OII] |
| SPS J032022.38+152854.1 | 03:20:22.38 | 15:28:54.1 | 1.344 | 1 | 24.12 0.04 | 0.39 | 1.1 | -83 | 7227-10000 | [OII] |
| SPS J033146.65-274453.5 | 03:31:46.65 | -27:44:53.5 | 0.707 | 3 | 25.14 0.04 | 1.48 | 1.6 | -55 | 5300-8187 | [OII] |
| SPS J033144.66-274518.7 | 03:31:44.66 | -27:45:18.7 | 0.217 | 0 | 20.57 0.03 | 0.46 | 1.4 | 63 | 5300-9738 | [OIII]-H |
| SPS J035431.21-493924.0 | 03:54:31.21 | -49:39:24.0 | 0.828 | 4 | 24.69 0.03 | 0.20 | 1.0 | 79 | 5300-9773 | [OII]-H-[OIII] |
| SPS J035430.34-493914.3 | 03:54:30.34 | -49:39:14.3 | 0.227 | 0 | 20.96 0.03 | 0.87 | 2.0 | 60 | 5300-10000 | H |
| SPS J041420.84+041417.6 | 04:14:20.84 | 04:14:17.6 | 1.028 | 1 | 23.86 0.03 | 1.89 | 1.4 | -39 | 5300-8852 | [OII] |
| SPS J045437.34-532514.1 | 04:54:37.34 | -53:25:14.1 | 0.357 | 1 | 22.88 0.03 | 0.37 | 1.4 | 24 | 6541-10000 | H |
| SPS J082344.12+292351.3 | 08:23:44.12 | 29:23:51.3 | 0.147 | 4 | 24.40 0.05 | 0.16 | 1.0 | -73 | 5300-8961 | H-[OIII]-H |
| SPS J082346.66+292323.3 | 08:23:46.66 | 29:23:23.3 | 1.324 | 1 | 25.46 0.17 | 0.50 | 1.2 | 79 | 7389-10000 | [OII] |
| SPS J084837.09+444819.8 | 08:48:37.09 | 44:48:19.8 | 0.644 | 4 | 21.67 0.03 | 0.13 | 1.1 | 83 | 6814-10000 | H-[OIII] |
| SPS J084837.63+444845.3 | 08:48:37.63 | 44:48:45.3 | 0.841 | 3 | 23.98 0.03 | 1.72 | 1.2 | 44 | 5300-9419 | [OII] |
| SPS J084840.29+444845.8 | 08:48:40.29 | 44:48:45.8 | 0.348 | 4 | 21.31 0.03 | 3.35 | 1.6 | -81 | 5300-9651 | H-H-[OIII]-H |
| SPS J084904.39+445308.5 | 08:49:04.39 | 44:53:08.5 | 0.423 | 4 | 25.02 0.03 | 0.12 | 1.0 | -56 | 5300-8736 | H-[OIII] |
| SPS J084916.65+445457.7 | 08:49:16.65 | 44:54:57.7 | 1.528 | 1 | 26.00 0.10 | 0.78 | 1.3 | -3 | 6874-10000 | [OII] |
| SPS J092658.16-053358.8 | 09:26:58.16 | -05:33:58.8 | 0.075 | 0 | 20.34 0.03 | 2.22 | 3.0 | -47 | 5300-8225 | H |
| SPS J092829.86-050121.9 | 09:28:29.86 | -05:01:21.9 | 0.904 | 3 | 24.78 0.03 | 0.23 | 1.1 | 67 | 5300-9659 | [OII] |
| SPS J092830.13-050118.6 | 09:28:30.13 | -05:01:18.6 | 1.350 | 1 | 23.39 0.03 | 0.33 | 1.0 | 20 | 5300-9540 | [OII] |
| SPS J093340.07+550951.3 | 09:33:40.07 | 55:09:51.3 | 0.556 | 4 | 24.34 0.03 | 0.21 | 1.0 | 48 | 5300-9042 | [OII]-H-[OIII] |
| SPS J094810.95+131142.6 | 09:48:10.95 | 13:11:42.6 | 0.950 | 1.5 | 24.38 0.06 | 0.95 | 1.1 | -50 | 6412-10000 | [OII] |
| SPS J095240.06+435834.9 | 09:52:40.06 | 43:58:34.9 | 0.405 | 4 | 23.36 0.03 | 1.31 | 1.2 | -4 | 5300-7998 | H-[OIII] |
| SPS J095615.40+694535.355 SPS J095615.40+694535.3 is detected in the J095618.3+694537.0 field, while SPS J095628.10+694551.9 is detected in the J095623.8+694540.6 field. | 09:56:15.40 | 69:45:35.3 | 0.782 | 2 | 23.42 0.03 | 2.59 | 1.9 | 82 | 5300-9566 | [OII] |
| SPS J095628.10+694551.955 SPS J095615.40+694535.3 is detected in the J095618.3+694537.0 field, while SPS J095628.10+694551.9 is detected in the J095623.8+694540.6 field. | 09:56:28.10 | 69:45:51.9 | 0.233 | 0 | 21.95 0.03 | 2.78 | 1.2 | -17 | 6952-10000 | H |
| SPS J100051.56+250858.6 | 10:00:51.56 | 25:08:58.6 | 0.663 | 3 | 23.32 0.03 | 0.45 | 1.2 | -18 | 5300-8024 | [OII] |
| SPS J100051.67+250853.0 | 10:00:51.67 | 25:08:53.0 | 1.138 | 1 | 23.80 0.03 | 1.33 | 1.3 | 51 | 5300-8563 | [OII] |
| SPS J100052.03+250839.2 | 10:00:52.03 | 25:08:39.2 | 1.077 | 3 | 25.57 0.08 | 0.57 | 1.0 | -86 | 5300-9885 | [OII] |
| SPS J100743.50+102045.7 | 10:07:43.50 | 10:20:45.7 | 0.158 | 0 | 19.79 0.03 | 0.24 | 1.7 | -13 | 7368-10000 | H-[SII] |
| SPS J102049.27+365226.3 | 10:20:49.27 | 36:52:26.3 | 0.717 | 3 | 22.79 0.03 | 0.35 | 1.4 | -65 | 5300-8219 | [OII] |
| SPS J102429.80+471314.2 | 10:24:29.80 | 47:13:14.2 | 0.723 | 3 | 24.35 0.03 | 0.36 | 1.1 | 22 | 5300-8364 | [OII] |
| SPS J103640.31-034708.1 | 10:36:40.31 | -03:47:08.1 | 0.934 | 3 | 24.46 0.03 | 0.80 | 1.2 | -29 | 5300-9121 | [OII] |
| SPS J104643.01-001212.7 | 10:46:43.01 | -00:012:12.7 | 1.164 | 1 | 23.14 0.03 | 0.09 | 1.0 | 81 | 5300-9913 | [OII] |
| SPS J105433.40-033837.3 | 10:54:33.40 | -03:38:37.3 | 0.110 | 0 | 21.43 0.03 | 3.79 | 2.5 | 59 | 5300-9312 | H |
| SPS J105655.06-034322.8 | 10:56:55.06 | -03:43:22.8 | 1.101 | 1 | 23.09 0.03 | 0.11 | 1.0 | 28 | 7517-10000 | [OII] |
| SPS J105700.03-034400.9 | 10:57:00.03 | -03:44:00.9 | 0.322 | 4 | 24.05 0.03 | 1.86 | 1.3 | -41 | 5300-9488 | [OIII]-H-H |
| SPS J105756.33-031415.7 | 10:57:56.33 | -03:14:15.7 | 1.205 | 1 | 23.49 0.03 | 0.27 | 1.1 | 65 | 5300-8755 | [OII] |
| SPS J105705.12-034137.2 | 10:57:05.12 | -03:41:37.2 | 0.395 | 4 | 22.87 0.03 | 2.44 | 1.3 | -87 | 5300-9199 | H-H-[OIII]-H |
| SPS J105702.81-034158.3 | 10:57:02.81 | -03:41:58.3 | 0.320 | 4 | 24.29 0.03 | 1.86 | 1.6 | 7 | 6252-10000 | [OIII]-H |
| SPS J105708.69-034310.8 | 10:57:08.69 | -03:43:10.8 | 0.403 | 4 | 23.85 0.03 | 0.41 | 1.4 | -89 | 6465-10000 | H-[OIII]-H |
| SPS J105708.06-034320.1 | 10:57:08.06 | -03:43:20.1 | 1.052 | 4 | 22.89 0.03 | 0.64 | 1.1 | -27 | 7355-10000 | [OII]-H |
| SPS J110137.18-121131.1 | 11:01:37.18 | -12:11:31.1 | 0.538 | 2 | 25.28 0.15 | 0.39 | 1.1 | -86 | 5300-8664 | [OII] |
| SPS J112057.83+232306.6 | 11:20:57.83 | 23:23:06.6 | 1.066 | 1 | 23.34 0.03 | 1.95 | 1.4 | 73 | 5662-10000 | [OII] |
| SPS J113338.51+041031.8 | 11:33:38.51 | 04:10:31.8 | 0.656 | 2 | 23.16 0.03 | 2.36 | 1.6 | 61 | 5300-8676 | [OII] |
| SPS J113950.96+660350.4 | 11:39:50.96 | 66:03:50.4 | 0.906 | 3 | 24.07 0.04 | 0.71 | 1.2 | 69 | 5300-9117 | [OII] |
| SPS J115616.05+550215.4 | 11:56:16.05 | 55:02:15.4 | 1.170 | 1 | 22.79 0.03 | 2.13 | 1.0 | -35 | 5543-10000 | [OII] |
| SPS J115623.08+550218.1 | 11:56:23.08 | 55:02:18.1 | 0.067 | 0 | 20.72 0.03 | 5.84 | 1.5 | 59 | 5300-8943 | H |
| SPS J115620.02+651935.3 | 11:56:20.02 | 65:19:35.3 | 0.465 | 0 | 21.41 0.03 | 0.48 | 1.4 | 25 | 6236-10000 | [OIII]-H |
| SPS J120113.92-185633.2 | 12:01:13.92 | -18:56:33.2 | 0.973 | 4 | 22.82 0.03 | 0.51 | 2.0 | 23 | 5300-10000 | [OII]-H |
| SPS J120112.82-185622.5 | 12:01:12.82 | -18:56:22.5 | 1.113 | 1 | 23.63 0.03 | 1.78 | 1.4 | -7 | 6932-10000 | [OII] |
| SPS J121340.03+171406.2 | 12:13:40.03 | 17:14:06.2 | 0.119 | 0 | 21.59 0.03 | 0.80 | 2.8 | -35 | 5300-8866 | H |
| SPS J121716.05-031607.0 | 12:17:16.05 | -03:16:07.0 | 1.249 | 1 | 23.97 0.04 | 1.65 | 1.3 | -43 | 6210-10000 | [OII] |
| SPS J121901.51+470804.6 | 12:19:01.51 | 47:08:04.6 | 1.425 | 1 | 23.40 0.03 | 0.21 | 1.4 | -1 | 7187-10000 | [OII] |
| SPS J121904.77+470754.4 | 12:19:04.77 | 47:07:54.4 | 1.479 | 1 | 22.99 0.03 | 1.22 | 1.6 | 10 | 7532-10000 | [OII] |
| SPS J122821.87+123625.3 | 12:28:21.87 | 12:36:25.3 | 1.063 | 1 | 23.72 0.03 | 0.24 | 1.1 | -25 | 5300-9440 | [OII] |
| SPS J122821.28+123636.9 | 12:28:21.28 | 12:36:36.9 | 0.965 | 3 | 25.27 0.05 | 0.91 | 1.3 | -14 | 5300-8140 | [OII] |
| SPS J123103.19+121422.6 | 12:31:03.19 | 12:14:22.6 | 0.746 | 4 | 23.71 0.03 | 0.64 | 1.2 | 34 | 5505-10000 | [OII]-H-[OIII] |
| SPS J123100.06+121419.4 | 12:31:00.06 | 12:14:19.4 | 0.248 | 0 | 23.05 0.03 | 1.49 | 1.3 | -37 | 5300-9878 | H |
| SPS J123102.59+121424.866 This object is detected in both the J1213008+121420.7 and J1213013+121418.3 fields. | 12:31:02.59 | 12:14:24.8 | 0.498 | 0 | 22.15 0.03 | 2.88 | 1.4 | -72 | 5410-10000 | H-[OIII]-H |
| SPS J123108.68+121542.7 | 12:31:08.68 | 12:15:42.7 | 0.958 | 3 | 23.76 0.03 | 0.14 | 1.0 | 2 | 7074-10000 | [OII] |
| SPS J123348.78+023212.4 | 12:33:48.78 | 02:32:12.4 | 0.690 | 2 | 23.09 0.03 | 1.50 | 1.9 | -40 | 5300-8636 | [OII] |
| SPS J123410.44+023311.7 | 12:34:10.44 | 02:33:11.7 | 1.528 | 1 | 23.72 0.03 | 0.31 | 1.2 | 3 | 7514-10000 | [OII] |
| SPS J123632.10+621758.3 | 12:36:32.10 | 62:17:58.3 | 1.007 | 1.5 | 23.91 0.03 | 0.27 | 1.1 | -77 | 5816-10000 | [OII] |
| SPS J123702.88+140744.9 | 12:37:02.88 | 14:07:44.9 | 0.623 | 4 | 25.05 0.03 | 0.18 | 1.0 | -34 | 6517-10000 | H-[OIII] |
| SPS J123705.08+140801.3 | 12:37:05.08 | 14:08:01.3 | 0.419 | 4 | 23.46 0.03 | 0.15 | 1.1 | 89 | 5912-10000 | H-[OIII]-H |
| SPS J123703.08+140803.7 | 12:37:03.08 | 14:08:03.7 | 0.900 | 4 | 24.68 0.03 | 1.62 | 1.6 | -86 | 5300-9854 | [OII]-H |
| SPS J123704.59+140822.5 | 12:37:04.59 | 14:08:22.5 | 1.028 | 1 | 23.63 0.03 | 0.71 | 1.1 | 38 | 5300-8743 | [OII] |
| SPS J124210.24+322744.3 | 12:42:10.24 | 32:27:44.3 | 0.059 | 0 | 21.43 0.03 | 1.01 | 1.6 | 4 | 5300-8595 | H |
| SPS J125055.99+105042.5 | 12:50:55.99 | 10:50:42.5 | 0.821 | 2 | 23.01 0.03 | 0.17 | 1.2 | -64 | 5300-10000 | [OII] |
| SPS J125054.02+105101.1 | 12:50:54.02 | 10:51:01.1 | 1.337 | 3 | 25.88 0.10 | 0.48 | 1.3 | -15 | 5300-10000 | [OII] |
| SPS J125917.75+362702.7 | 12:59:17.75 | 36:27:02.7 | 0.356 | 4 | 22.09 0.03 | 0.97 | 1.1 | -38 | 6113-10000 | H-[OIII]-H |
| SPS J130002.95+275342.0 | 13:00:02.95 | 27:53:42.0 | 0.822 | 4 | 23.99 0.03 | 1.22 | 1.4 | -24 | 6391-10000 | [OII]-[OIII] |
| SPS J130016.01+275405.5 | 13:00:16.01 | 27:54:05.5 | 0.575 | 4 | 24.45 0.03 | 0.26 | 1.1 | -42 | 5317-10000 | [OII]-H-[OIII] |
| SPS J130015.23+275336.1 | 13:00:15.23 | 27:53:36.1 | 0.279 | 0 | 24.19 0.04 | 2.20 | 1.6 | 22 | 7580-10000 | H |
| SPS J130927.26+292229.3 | 13:09:27.26 | 29:22:29.3 | 0.760 | 4 | 23.03 0.03 | 0.27 | 1.1 | -5 | 5898-10000 | [OII]-H-[OIII] |
| SPS J131116.64-011825.5 | 13:11:16.64 | -01:18:25.5 | 0.079 | 0 | 20.84 0.03 | 5.33 | 2.2 | -42 | 6154-10000 | H |
| SPS J131812.38-000507.4 | 13:18:12.38 | -00:05:07.4 | 0.381 | 4 | 21.62 0.03 | 0.23 | 1.0 | 57 | 7269-10000 | H-[SII] |
| SPS J131810.94-000444.1 | 13:18:10.94 | -00:04:44.1 | 0.863 | 3 | 22.95 0.03 | 0.32 | 1.1 | -59 | 5300-9220 | [OII] |
| SPS J131811.71-000434.5 | 13:18:11.71 | -00:04:34.5 | 0.165 | 0 | 22.63 0.03 | 3.29 | 1.7 | 46 | 5300-9114 | H |
| SPS J131810.43-000453.8 | 13:18:10.43 | -00:04:53.8 | 3.170 | 4 | 21.28 0.03 | 0.09 | 1.0 | -26 | 5300-9564 | UV lines |
| SPS J132511.10+301418.3 | 13:25:11.10 | 30:14:18.3 | 0.675 | 3 | 23.84 0.03 | 0.11 | 1.0 | 28 | 5300-8008 | [OII] |
| SPS J133008.55+470741.8 | 13:30:08.55 | 47:07:41.8 | 0.594 | 4 | 23.80 0.03 | 0.23 | 1.0 | 65 | 5300-9728 | [OII]-[OIII] |
| SPS J133006.46+470719.4 | 13:30:06.46 | 47:07:19.4 | 0.960 | 1.5 | 23.25 0.03 | 0.76 | 1.1 | 44 | 5300-10000 | [OII] |
| SPS J134035.18+273417.1 | 13:40:35.18 | 27:34:17.1 | 0.414 | 4 | 24.41 0.05 | 0.21 | 1.0 | 49 | 5726-10000 | H-H-[OIII] |
| SPS J134322.44+021542.7 | 13:43:22.44 | 02:15:42.7 | 1.480 | 1 | 22.83 0.03 | 0.97 | 1.6 | 70 | 7399-10000 | [OII] |
| SPS J134429.63-000909.6 | 13:44:29.63 | -00:09:09.6 | 0.181 | 0 | 22.32 0.03 | 1.69 | 1.9 | -66 | 5300-8249 | H |
| SPS J134606.52+015858.2 | 13:46:06.52 | 01:58:58.2 | 0.756 | 4 | 23.05 0.03 | 1.13 | 1.6 | 18 | 6938-10000 | [OIII]-H |
| SPS J134608.36+015922.6 | 13:46:08.36 | 01:59:22.6 | 0.662 | 3 | 22.53 0.03 | 2.84 | 1.4 | -36 | 5300-8407 | [OII] |
| SPS J134721.93+021407.2 | 13:47:21.93 | 02:14:07.2 | 0.342 | 4 | 20.62 0.03 | 0.21 | 1.1 | 1 | 5610-10000 | H-[OIII]-H |
| SPS J134721.97+021405.7 | 13:47:21.97 | 02:14:05.7 | 0.338 | 4 | 23.95 0.06 | 1.53 | 2.1 | -12 | 5542-10000 | [OIII] |
| SPS J140051.85+621937.7 | 14:00:51.85 | 62:19:37.7 | 0.074 | 0 | 19.26 0.03 | 5.00 | 5.0 | 34 | 5536-10000 | H |
| SPS J140140.40+150857.3 | 14:01:40.40 | 15:08:57.3 | 0.526 | 2 | 24.34 0.03 | 1.63 | 1.4 | -54 | 5300-8810 | [OII] |
| SPS J141824.25+523420.0 | 14:18:24.25 | 52:34:20.0 | 0.710 | 3 | 23.39 0.03 | 0.61 | 1.4 | 79 | 5300-7912 | [OII] |
| SPS J142427.43+225959.8 | 14:24:27.43 | 22:59:59.8 | 0.970 | 3 | 25.68 0.08 | 0.32 | 1.0 | 17 | 5300-9229 | [OII] |
| SPS J142957.15+420713.1 | 14:29:57.15 | 42:07:13.1 | 0.568 | 4 | 23.94 0.03 | 0.18 | 1.0 | -32 | 5300-8983 | [OII]-[OIII] |
| SPS J142955.57+420714.3 | 14:29:55.57 | 42:07:14.3 | 1.080 | 1 | 23.21 0.03 | 1.02 | 1.9 | 52 | 5454-10000 | [OII] |
| SPS J142956.79+420729.4 | 14:29:56.79 | 42:07:29.4 | 0.790 | 2 | 26.49 0.14 | 0.27 | 1.4 | -25 | 5300-10000 | [OII] |
| SPS J144449.32+384521.1 | 14:44:49.32 | 38:45:21.1 | 0.382 | 3 | 21.76 0.03 | 0.28 | 1.0 | -32 | 6800-10000 | H |
| SPS J151617.05-001337.9 | 15:16:17.05 | -00:013:37.9 | 1.268 | 1 | 23.76 0.03 | 2.19 | 1.4 | -41 | 7491-10000 | [OII] |
| SPS J155003.49+212318.9 | 15:50:03.49 | 21:23:18.9 | 1.183 | 1 | 24.15 0.04 | 0.41 | 1.3 | 11 | 5300-8920 | [OII] |
| SPS J160956.65+653334.6 | 16:09:56.65 | 65:33:34.6 | 0.157 | 4 | 20.16 0.03 | 0.78 | 1.3 | 76 | 5300-8380 | H-[OIII]-H |
| SPS J162357.69+262830.2 | 16:23:57.69 | 26:28:30.2 | 0.090 | 4 | 22.21 0.03 | 1.74 | 1.0 | -45 | 5300-9055 | H-[OIII]-H |
| SPS J162354.88+262803.5 | 16:23:54.88 | 26:28:03.5 | 0.474 | 2 | 22.63 0.03 | 1.83 | 2.2 | 57 | 5300-8321 | [OII] |
| SPS J162341.40+263433.0 | 16:23:41.40 | 26:34:33.0 | 0.369 | 2 | 22.15 0.03 | 0.87 | 1.7 | 85 | 5300-9301 | H |
| SPS J162444.27+234041.6 | 16:24:44.27 | 23:40:41.6 | 1.360 | 1 | 24.36 0.03 | 0.74 | 1.2 | -83 | 6849-10000 | [OII] |
| SPS J164042.82+463843.1 | 16:40:42.82 | 46:38:43.1 | 0.223 | 0 | 21.21 0.03 | 1.28 | 2.2 | 26 | 6316-10000 | H |
| SPS J164435.47+234221.2 | 16:44:35.47 | 23:42:21.2 | 0.207 | 4 | 24.04 0.06 | 0.23 | 1.1 | -70 | 6472-10000 | H-[OIII]-H |
| SPS J164434.54+234207.9 | 16:44:34.54 | 23:42:07.9 | 0.926 | 1.5 | 24.80 0.10 | 0.91 | 1.3 | -19 | 7065-10000 | [OII] |
| SPS J164908.74+601414.5 | 16:49:08.74 | 60:14:14.5 | 1.189 | 1 | 23.09 0.03 | 0.18 | 1.0 | 35 | 5909-10000 | [OII] |
| SPS J164909.64+601416.3 | 16:49:09.64 | 60:14:16.3 | 1.006 | 3 | 26.23 0.16 | 0.24 | 1.1 | 41 | 6029-10000 | [OII] |
| SPS J171605.64+670411.9 | 17:16:05.64 | 67:04:11.9 | 0.171 | 0 | 21.11 0.03 | 1.14 | 1.8 | 50 | 6327-10000 | H |
| SPS J201756.69-704702.1 | 20:17:56.69 | -70:47:02.1 | 0.159 | 0 | 22.00 0.03 | 2.68 | 1.7 | -53 | 5300-10000 | H |
| SPS J204756.29-194709.4 | 20:47:56.29 | -19:47:09.4 | 0.316 | 4 | 21.43 0.03 | 0.29 | 1.3 | 66 | 5300-9777 | H-[OIII]-H |
| SPS J204757.09-194653.3 | 20:47:57.09 | -19:46:53.3 | 0.405 | 4 | 22.57 0.03 | 0.14 | 1.0 | 48 | 5300-10000 | H-[OIII]-H |
| SPS J204757.58-194718.3 | 20:47:57.58 | -19:47:18.3 | 0.111 | 0 | 20.77 0.03 | 5.08 | 1.2 | 49 | 5300-7941 | H |
| SPS J224024.66-054723.3 | 22:40:24.66 | -05:47:23.3 | 0.619 | 4 | 23.87 0.03 | 0.14 | 1.0 | 48 | 5300-9585 | [OII]-H-[OIII] |
| SPS J224025.90-054736.3 | 22:40:25.90 | -05:47:36.3 | 0.241 | 0 | 21.55 0.03 | 1.14 | 1.6 | -31 | 6743-10000 | H |
| SPS J224024.68-054744.5 | 22:40:24.68 | -05:47:44.5 | 1.141 | 1 | 24.01 0.04 | 1.02 | 1.5 | 61 | 5392-10000 | [OII] |
| SPS J224015.89-055449.7 | 22:40:15.89 | -05:54:49.7 | 0.278 | 0 | 22.91 0.03 | 0.54 | 1.3 | 33 | 6612-10000 | H |
| SPS J232435.91+280401.8 | 23:24:35.91 | 28:04:01.8 | 0.208 | 3 | 23.32 0.03 | 1.14 | 1.0 | 25 | 5500-10000 | H |
| SPS J232437.59+280404.4 | 23:24:37.59 | 28:04:04.4 | 0.057 | 0 | 21.96 0.03 | 1.60 | 1.3 | 58 | 5300-8380 | H |
| SPS J235036.79+271021.1 | 23:50:36.79 | 27:10:21.1 | 1.548 | 3 | 25.40 0.13 | 0.15 | 1.0 | 81 | 7049-10000 | [OII] |
| SPS J235036.70+271024.2 | 23:50:36.70 | 27:10:24.2 | 1.250 | 3 | 25.58 0.09 | 0.25 | 1.0 | 23 | 7223-10000 | [OII] |
| SPS J235038.34+271003.2 | 23:50:38.34 | 27:10:03.2 | 0.502 | 2 | 24.74 0.06 | 0.59 | 1.1 | -54 | 5300-9781 | [OII] |
| SPS J235158.16+243036.2 | 23:51:58.16 | 24:30:36.2 | 0.429 | 4 | 23.31 0.03 | 1.76 | 1.4 | 52 | 5300-9268 | [OII]-H-H-[OIII] |
| SPS J235158.92+243041.4 | 23:51:58.92 | 24:30:41.4 | 0.036 | 0 | 21.71 0.03 | 1.88 | 2.0 | -45 | 5300-9278 | H |
|
|
| obj name | line | line flux11( erg cm-2 s-1) | continuum 22Continuum signal to noise ratio in a two pixel resolution element. | ||
|---|---|---|---|---|---|
| (Å) | |||||
| SPS J001716.56+160239.5 | [OII] | 1.35 | 3.7 | 141 | 0.5 |
| SPS J010030.43-332823.4 | [OII] | 2.34 | 5.1 | 219 | 0.5 |
| SPS J010329.80+131508.9 | [OII] | 4.74 | 10.5 | 156 | 1.5 |
| H | 0.250 | 2.1 | 7 | 2.9 | |
| H | 0.860 | 3.2 | 30 | 1.6 | |
| H | 1.20 | 3.3 | 58 | 0.7 | |
| [OIII]4959 | 5.94 | 8.0 | 240 | 0.8 | |
| [OIII]5007 | 12.6 | 14.5 | 481 | 0.7 | |
| SPS J021048.23-393308.0 | [OII] | 2.54 | 4.1 | 110 | 0.7 |
| H | 1.21 | -2 | |||
| [OIII]5007 | 1.48 | -2 | |||
| SPS J030221.47+001150.6 | [OII] | 1.36 | 3.4 | 103 | 0.6 |
| SPS J030210.18+001140.0 | [OII] | 2.90 | 5.4 | 191 | 0.4 |
| SPS J031357.20-550113.5 | [OII] | 1.59 | 5.0 | 95 | 1.0 |
| SPS J032022.38+152854.1 | [OII] | 2.46 | 2.7 | 297 | 0.2 |
| SPS J033146.65-274453.5 | [OII] | 2.26 | 3.9 | 110 | 0.7 |
| SPS J035431.21-493924.0 | [OII] | 0.770 | 6.1 | 146 | 0.8 |
| H | 0.840 | 3.5 | 115 | 0.6 | |
| [OIII]4959 | 0.910 | 3.7 | 96 | 0.7 | |
| [OIII]5007 | 3.88 | 13.2 | 419 | 0.7 | |
| SPS J041420.84+041417.6 | [OII] | 3.27 | 3.7 | 315 | 0.3 |
| SPS J045437.34-532514.1 | H | 2.62 | 3.9 | 173 | 0.5 |
| SPS J082344.12+292351.3 | H | 0.690 | 1.7 | 81 | 0.4 |
| [OIII]4959 | 1.04 | 4.0 | 121 | 0.5 | |
| [OIII]5007 | 1.42 | 4.7 | 167 | 0.5 | |
| H | 1.12 | 4.6 | 221 | 0.4 | |
| SPS J082346.66+292323.3 | [OII] | 1.70 | 2.7 | 170 | 0.3 |
| SPS J084837.09+444819.8 | H | 2.10 | 5.9 | 18 | 9.0 |
| H | 4.53 | 6.9 | 36 | 5.8 | |
| [OIII]4959 | 4.30 | 7.0 | 34 | 5.5 | |
| [OIII]5007 | 8.25 | 10.7 | 66 | 4.8 | |
| SPS J084837.63+444845.3 | [OII] | 1.16 | 4.1 | 127 | 0.8 |
| H | 1.07 | -2 | |||
| SPS J084840.29+444845.8 | H | 0.480 | 2.1 | 11 | 3.6 |
| H | 0.910 | 3.0 | 19 | 3.9 | |
| [OIII]4959 | 0.100 | 0.7 | 2 | 4.7 | |
| [OIII]5007 | 0.970 | 4.3 | 20 | 4.3 | |
| H | 1.48 | 4.3 | 25 | 2.9 | |
| [NII]6583 | 0.360 | 1.3 | 6 | 2.8 | |
| SPS J084904.39+445308.5 | H | 1.01 | 4.0 | 120 | 0.5 |
| [OIII]4959 | 0.610 | 2.4 | 71 | 0.5 | |
| [OIII]5007 | 3.47 | 9.0 | 416 | 0.4 | |
| SPS J084916.65+445457.7 | [OII] | 4.96 | 4.1 | 1895 | 0.0 |
| SPS J092829.86-050121.9 | [OII] | 0.860 | 3.3 | 74 | 1.0 |
| H | 1.03 | -2 | |||
| SPS J092830.13-050118.6 | [OII] | 1.67 | 3.0 | 77 | 0.9 |
| SPS J093340.07+550951.3 | [OII] | 1.67 | 3.2 | 70 | 1.2 |
| H | 0.400 | 1.5 | 23 | 1.1 | |
| [OIII]4959 | 1.12 | 3.9 | 65 | 1.1 | |
| [OIII]5007 | 2.80 | 7.9 | 163 | 0.9 | |
| SPS J094810.95+131142.6 | [OII] | 1.77 | 4.6 | 184 | 0.5 |
| H | 1.64 | -2 | |||
| [OIII]5007 | 2.39 | -2 | |||
| SPS J095240.06+435834.9 | H | 0.200 | 1.2 | 16 | 0.8 |
| [OIII]4959 | 0.240 | 0.8 | 17 | 0.9 | |
| [OIII]5007 | 0.830 | 2.8 | 59 | 0.8 | |
| SPS J095615.40+694535.3 | [OII] | 2.86 | 4.1 | 256 | 0.5 |
| H | 2.53 | -2 | |||
| [OIII]5007 | 2.54 | -2 | |||
| SPS J100051.56+250858.6 | [OII] | 2.63 | 4.3 | 87 | 1.1 |
| SPS J100051.67+250853.0 | [OII] | 3.64 | 5.1 | 272 | 0.4 |
| SPS J100052.03+250839.2 | [OII] | 2.85 | 4.6 | 390 | 0.3 |
| SPS J102049.27+365226.3 | [OII] | 2.22 | 4.6 | 66 | 1.5 |
| SPS J102429.80+471314.2 | [OII] | 1.57 | 4.0 | 273 | 0.3 |
| SPS J103640.31-034708.1 | [OII] | 1.03 | 2.6 | 51 | 1.3 |
| SPS J104643.01-001212.7 | [OII] | 2.58 | 4.0 | 136 | 0.7 |
| SPS J105655.06-034322.8 | [OII] | 2.69 | 4.3 | 78 | 1.1 |
| SPS J105700.03-034400.9 | H | 0.600 | -2 | ||
| [OIII]4959 | 0.850 | 2.8 | 36 | 1.3 | |
| [OIII]5007 | 1.97 | 6.7 | 85 | 1.5 | |
| H | 1.91 | 2.3 | 123 | 0.5 | |
| SPS J105756.33-031415.7 | [OII] | 1.85 | 2.6 | 104 | 0.6 |
| SPS J105705.12-034137.2 | H | 0.700 | 2.5 | 26 | 1.2 |
| H | 1.28 | 2.7 | 73 | 0.8 | |
| [OIII]4959 | 2.58 | 3.9 | 147 | 0.7 | |
| [OIII]5007 | 4.22 | 7.0 | 251 | 0.7 | |
| H | 4.19 | 3.2 | 550 | 0.2 | |
| SPS J105702.81-034158.3 | H | 0.200 | 1. | 21 | 0.4 |
| [OIII]4959 | 0.750 | 2.7 | 93 | 0.4 | |
| [OIII]5007 | 2.45 | 7.0 | 297 | 0.4 | |
| SPS J105708.69-034310.8 | H | 0.970 | 2.3 | 89 | 0.5 |
| [OIII]4959 | 1.30 | 3.1 | 116 | 0.5 | |
| [OIII]5007 | 1.69 | 4.7 | 152 | 0.6 | |
| H | 3.17 | 3.8 | 105 | 0.8 | |
| SPS J105708.06-034320.1 | [OII] | 6.58 | 11.7 | 395 | 0.7 |
| SPS J110137.18-121131.1 | [OII] | 4.23 | 4.8 | 188 | 0.8 |
| H | 1.40 | -2 | |||
| [OIII]5007 | 1.47 | -2 | |||
| SPS J112057.83+232306.6 | [OII] | 1.32 | 3.4 | 91 | 0.8 |
| SPS J113338.51+041031.8 | [OII] | 4.55 | 4.7 | 233 | 0.6 |
| H | 2.74 | -2 | |||
| [OIII]5007 | 3.15 | -2 | |||
| SPS J113950.96+660350.4 | [OII] | 1.04 | 2.8 | 48 | 1.1 |
| SPS J115616.05+550215.4 | [OII] | 1.79 | 2.9 | 67 | 0.7 |
| SPS J120113.92-185633.2 | [OII] | 2.94 | 4.0 | 101 | 1.0 |
| H | 3.05 | 2.3 | 256 | 0.2 | |
| [OIII]4959 | 0.580 | 0.7 | 48 | 0.2 | |
| [OIII]5007 | 4.60 | 2.4 | 396 | 0.1 | |
| SPS J120112.82-185622.5 | [OII] | 1.98 | 3.9 | 209 | 0.4 |
| SPS J121716.05-031607.0 | [OII] | 3.01 | 3.0 | 236 | 0.2 |
| SPS J121901.51+470804.6 | [OII] | 2.15 | 3.3 | 115 | 0.8 |
| SPS J121904.77+470754.4 | [OII] | 1.54 | 4.5 | 105 | 0.8 |
| SPS J122821.87+123625.3 | [OII] | 2.08 | 4.5 | 179 | 0.6 |
| SPS J122821.28+123636.9 | [OII] | 1.87 | 4.4 | 146 | 0.8 |
| SPS J123103.19+121422.6 | [OII] | 1.34 | 3.9 | 153 | 0.4 |
| H | 0.270 | 1.4 | 35 | 0.3 | |
| [OIII]4959 | 0.930 | 0.8 | 119 | 0.2 | |
| [OIII]5007 | 2.53 | 2.3 | 363 | 0.1 | |
| SPS J123108.68+121542.7 | [OII] | 1.48 | 4.2 | 115 | 0.8 |
| H | 1.55 | -2 | |||
| [OIII]5007 | 2.32 | -2 | |||
| SPS J123348.78+023212.4 | [OII] | 3.02 | 3.5 | 307 | 0.3 |
| H | 2.79 | -2 | |||
| SPS J123410.44+023311.7 | [OII] | 1.56 | 4.8 | 190 | 0.4 |
| SPS J123632.10+621758.3 | [OII] | 0.760 | 5.3 | 57 | 1.9 |
| H | 8.49 | -2 | |||
| SPS J123702.88+140744.9 | H | 0.430 | 2.3 | 255 | 0.1 |
| [OIII]4959 | 0.870 | 2.6 | 645 | 0.1 | |
| [OIII]5007 | 2.30 | 4.9 | 1787 | 0.1 | |
| SPS J123705.08+140801.3 | H | 0.800 | 4.0 | 44 | 1.7 |
| H | 1.24 | 5.9 | 81 | 1.5 | |
| [OIII]4959 | 2.79 | 16.0 | 174 | 1.7 | |
| [OIII]5007 | 8.71 | 41.5 | 538 | 1.5 | |
| H | 4.25 | 10. | 160 | 1.3 | |
| SPS J123703.08+140803.7 | [OII] | 0.810 | 2.6 | 183 | 0.4 |
| H | 0.780 | 3.6 | 155 | 0.5 | |
| [OIII]5007 | 1.45 | -2 | |||
| SPS J123704.59+140822.5 | [OII] | 1.04 | 3.4 | 56 | 1.5 |
| SPS J125055.99+105042.5 | [OII] | 1.99 | 5.6 | 51 | 2.0 |
| H | 1.33 | -2 | |||
| [OIII]5007 | 1.35 | -2 | |||
| SPS J125054.02+105101.1 | [OII] | 2.97 | 5.6 | 297 | 0.4 |
| SPS J125917.75+362702.7 | H | 0.670 | 2.0 | 21 | 1.7 |
| [OIII]4959 | 0.640 | 2.3 | 21 | 1.6 | |
| [OIII]5007 | 2.12 | 5.0 | 75 | 1.5 | |
| [OI]6300 | 1.13 | 1.8 | 95 | 0.3 | |
| H | 2.70 | 3.9 | 210 | 0.4 | |
| [SII] | 0.900 | 1.8 | 65 | 0.4 | |
| SPS J130002.95+275342.0 | [OII] | 0.880 | 3.2 | 214 | 0.3 |
| H | 1.04 | -2 | |||
| [OIII]5007 | 1.04 | 2.3 | 50 | 0.8 | |
| SPS J130016.01+275405.5 | [OII] | 0.750 | 2.7 | 78 | 0.6 |
| H | 0.450 | 2.2 | 165 | 0.2 | |
| [OIII]4959 | 0.660 | 2.0 | 290 | 0.1 | |
| [OIII]5007 | 2.18 | 3.4 | 1041 | 0.1 | |
| SPS J130927.26+292229.3 | [OII] | 0.220 | 0.9 | 11 | 0.9 |
| H | 1.25 | 1.8 | 25 | 1.2 | |
| [OIII]4959 | 1.54 | 2.3 | 26 | 1.5 | |
| [OIII]5007 | 2.28 | 4.1 | 39 | 1.7 | |
| SPS J131812.38-000507.4 | H | 7.00 | 6.1 | 85 | 1.9 |
| [SII] | 2.21 | 3.3 | 39 | 1.5 | |
| SPS J131810.94-000444.1 | [OII] | 1.30 | 3.8 | 42 | 1.7 |
| SPS J131810.43-000453.8 | OI1302 | 5.98 | 30.0 | 35 | 20 |
| SiIV1398 | 5.70 | 40.0 | 35 | 20 | |
| NIV]1486 | 1.35 | 28.0 | 9 | 20 | |
| CIV1550 | 22.1 | 50.0 | 159 | 20 | |
| CIII]1909 | 13.7 | 50.0 | 141 | 20 | |
| SPS J132511.10+301418.3 | [OII] | 1.23 | 3.4 | 105 | 0.7 |
| SPS J133008.55+470741.8 | [OII] | 1.62 | 3.6 | 124 | 0.5 |
| H | 0.270 | 1.1 | 159 | 0.1 | |
| [OIII]4959 | 0.230 | 0.8 | 79 | 0.1 | |
| [OIII]5007 | 4.87 | 3.5 | 2341 | 0.0 | |
| SPS J133006.46+470719.4 | [OII] | 1.73 | 3.1 | 82 | 0.8 |
| H | 2.52 | -2 | |||
| SPS J134035.18+273417.1 | H | 0.340 | 1.3 | 41 | 0.5 |
| H | 1.03 | 3.5 | 82 | 0.8 | |
| [OIII]4959 | 0.580 | 2.6 | 39 | 0.9 | |
| [OIII]5007 | 2.57 | 9.3 | 175 | 1.0 | |
| SPS J134322.44+021542.7 | [OII] | 3.39 | 2.9 | 104 | 0.5 |
| SPS J134606.52+015858.2 | H | 1.18 | 1.9 | 99 | 0.3 |
| [OIII]4959 | 0.670 | 1.1 | 60 | 0.3 | |
| [OIII]5007 | 5.21 | 5.0 | 489 | 0.3 | |
| SPS J134608.36+015922.6 | [OII] | 4.64 | 7.3 | 492 | 0.4 |
| H | 1.23 | 2.3 | 427 | 0.1 | |
| SPS J134721.93+021407.2 | H | 3.26 | 4.2 | 14 | 6.4 |
| H | 5.27 | 7.0 | 29 | 6.5 | |
| [OIII]4959 | 2.63 | 3.4 | 15 | 6.4 | |
| [OIII]5007 | 3.13 | 5.1 | 17 | 6.9 | |
| H | 34.3 | 22.3 | 262 | 2.5 | |
| SPS J134721.97+021405.7 | [OIII]5007 | 1.97 | 3.7 | 210 | 0.4 |
| SPS J140140.40+150857.3 | [OII] | 3.58 | 3.6 | 122 | 0.9 |
| H | 1.56 | -2 | |||
| [OIII]5007 | 1.63 | -2 | |||
| SPS J141824.25+523420.0 | [OII] | 1.32 | 3.7 | 61 | 1.4 |
| SPS J142427.43+225959.8 | [OII] | 1.47 | 4.2 | 102 | 0.8 |
| SPS J142957.15+420713.1 | [OII] | 2.48 | 4.4 | 77 | 1.7 |
| H | 0.710 | -2 | |||
| [OIII]4959 | 0.930 | 2.5 | 31 | 1.6 | |
| [OIII]5007 | 2.81 | 7.1 | 89 | 1.6 | |
| SPS J142955.57+420714.3 | [OII] | 1.62 | 4.5 | 89 | 1.0 |
| SPS J142956.79+420729.4 | [OII] | 1.66 | 5.5 | 259 | 0.4 |
| H | 0.440 | -2 | |||
| [OIII]5007 | 0.520 | -2 | |||
| SPS J144449.32+384521.1 | H | 3.06 | 4.2 | 30 | 2.9 |
| SPS J151617.05-001337.9 | [OII] | 3.27 | 5.3 | 126 | 0.9 |
| SPS J155003.49+212318.9 | [OII] | 1.87 | 2.6 | 123 | 0.5 |
| SPS J160956.65+653334.6 | H | 0.680 | 20.0 | 5 | 3 |
| [OIII]4959 | 4.65 | 50.0 | 31 | 3 | |
| [OIII]5007 | 10.6 | 50.0 | 69 | 3 | |
| [FeVII] | 1.15 | 50.0 | 7 | 5 | |
| [OI] | 0.350 | 25.0 | 2 | 5 | |
| H | 15.8 | 50.0 | 87 | 1 | |
| [SII] | 2.58 | 50.0 | 14 | 6 | |
| SPS J162357.69+262830.2 | H | 0.790 | 5.0 | 21 | 1 |
| [OIII]4959 | 0.690 | 4.5 | 17 | 0.9 | |
| [OIII]5007 | 2.40 | 12.0 | 54 | 7.4 | |
| [FeVII]5721 | 0.540 | 8.0 | 13 | 8 | |
| H | 2.20 | 20.0 | 66 | 3 | |
| HeI7065 | 0.800 | 8.0 | 32 | 16 | |
| SPS J162354.88+262803.5 | [OII] | 4.67 | 8.0 | 279 | 5 |
| SPS J162341.40+263433.0 | H | 2.49 | -2 | ||
| [OIII]5007 | 2.41 | -2 | |||
| H | 5.17 | 2.3 | 161 | 0.4 | |
| SPS J162444.27+234041.6 | [OII] | 4.18 | 3.7 | 374 | 0.3 |
| SPS J164435.47+234221.2 | H | 0.220 | 0.3 | 27 | 0.1 |
| [OIII]4959 | 2.06 | 2.7 | 280 | 0.2 | |
| [OIII]5007 | 4.69 | 4.4 | 600 | 0.1 | |
| H | 2.07 | 2.8 | 254 | 0.2 | |
| SPS J164434.54+234207.9 | [OII] | 1.28 | 2.5 | 383 | 0.1 |
| H | 3.44 | -2 | |||
| [OIII]5007 | 4.47 | -2 | |||
| SPS J164908.74+601414.5 | [OII] | 3.32 | 5.2 | 402 | 0.3 |
| SPS J164909.64+601416.3 | [OII] | 2.19 | 4.3 | 122 | 0.8 |
| SPS J204756.29-194709.4 | H | 0.490 | 1.8 | 6 | 5.1 |
| [OIII]4959 | 1.74 | 4.6 | 22 | 4.7 | |
| [OIII]5007 | 4.84 | 12.5 | 61 | 4.6 | |
| [OI]6300 | 1.20 | 1.9 | 20 | 2.0 | |
| H | 9.44 | 7.9 | 158 | 1.5 | |
| SPS J204757.09-194653.3 | H | 0.890 | 2.9 | 21 | 2.6 |
| [OIII]4959 | 1.32 | 4.2 | 29 | 2.9 | |
| [OIII]5007 | 4.80 | 15.5 | 106 | 2.9 | |
| H | 5.35 | 4.5 | 130 | 1.1 | |
| SPS J224024.66-054723.3 | [OII] | 0.970 | 2.6 | 112 | 0.5 |
| H | 1.62 | 3.7 | 380 | 0.2 | |
| [OIII]4959 | 1.52 | 3.7 | 325 | 0.2 | |
| [OIII]5007 | 5.79 | 9.4 | 1250 | 0.1 | |
| SPS J224024.68-054744.5 | [OII] | 2.11 | 3.9 | 208 | 0.4 |
| SPS J232435.91+280401.8 | H | 1.97 | 2.5 | 110 | 0.5 |
| SPS J235036.79+271021.1 | [OII] | 2.29 | 3.1 | 116 | 0.5 |
| SPS J235036.70+271024.2 | [OII] | 2.48 | 2.7 | 84 | 0.6 |
| SPS J235038.34+271003.2 | [OII] | 1.74 | 2.9 | 172 | 0.4 |
| H | 0.950 | -2 | |||
| [OIII]5007 | 1.01 | -2 | |||
| SPS J235158.16+243036.2 | [OII] | 1.31 | 2.6 | 77 | 0.7 |
| H | 0.680 | 2.7 | 49 | 1.0 | |
| H | 0.490 | 2.6 | 41 | 0.9 | |
| [OIII]4959 | 0.600 | 2.7 | 53 | 1.0 | |
| [OIII]5007 | 1.68 | 7.5 | 148 | 1.0 | |
|
|