Globular cluster candidates within the Fornax Cluster: intracluster globulars? ††thanks: Based on observations obtained at Cerro Tololo Inter-American Observatory, NOAO, which is operated by AURA, Inc., under cooperative agreement with the National Science Foundation.
We present the results of a search for globular clusters in the surroundings of 15 low surface brightness dwarf galaxies belonging to the Fornax Cluster, which was carried out on CCD images obtained with the and filters of the Washington photometric system. The globular cluster candidates show an extended and probably bimodal color distribution, which is inconsistent with the presence of a single population of metal-poor clusters detected in several dwarf galaxies. The surface number density of these candidates shows no concentration towards the respective dwarf galaxies, in whose outskirts they have been identified. On the contrary, if we split the candidates in two groups according to their projected distances to the center of the Fornax Cluster, those located closer to the center show a higher projected density than those located farther from it. These results suggest that the potential globular clusters might not be bound to the dwarf galaxies. Alternatively, these globulars could form part of the very peripheral regions of NGC 1399 (the central galaxy of the Fornax Cluster) or even belong to the intracluster medium.
Key Words.:
globular clusters: general – galaxies: star clusters – galaxies: dwarf – galaxies: clusters: individual (Fornax)1 Introduction
The Fornax Cluster is an excellent target for studying globular clusters: it is very rich, contains different types of galaxies and the globular cluster candidates can be detected at least as unresolved sources. There are numerous photometric studies of globular cluster systems in selected Fornax galaxies, particularly the central one NGC 1399 as well as other early-type galaxies. Most of these studies show that the color distribution of the globular clusters is bimodal due to the presence of two globular cluster populations, “red” and “blue”; these integrated colors are mainly driven by metallicity in objects as old as these ones.
With regard to the globular cluster system of NGC 1399, the Washington photometry by Ostrov et al. (1993) confirmed the existence of a color gradient that had been detected earlier by Bridges at al. (1991), and suggested that the color distribution was multimodal, as was also supported by the V,I photometry by Kissler-Patig et al. (1997). The HST imaging by Forbes et al. (1998) and Grillmair et al. (1999), and a refined analysis of their previous Washington photometry by Ostrov et al. (1998), pointed to the bimodal character of the color distribution. More recently, the wide-field study by Dirsch et al. (2002a, b) showed that globular custers with a broad metallicity distribution – that cannot be fitted with a single Gaussian – extend further than 100 kpc from NGC 1399 center.
There are fewer investigations of globular cluster systems in dwarf galaxies that are not in the Local Group. Miller and collaborators (Miller et al. 1998a, b; Miller 1999; Lotz et al. 2001) carried out a survey with images from the Wide Field Planetary Camera 2 of the Hubble Space Telescope (FOV 6 arcmin2) to analyze the properties of globular clusters and nuclei of dwarf elliptical galaxies (dEs) in the Fornax and Virgo Clusters and the Leo Group. They include about 20 dEs from the Fornax Cluster but none of them are in common with the present work. They show that the globular cluster specific frequency (number of globular clusters with respect to the parent galaxy’s luminosity) of the dEs is in the range 2–6; the luminosity function of the globular cluster candidates is consistent with a Gaussian with peak at mag and dispersion mag (assuming a distance modulus of 31.4 for the Fornax Cluster); and most of the globular cluster colors are similar to those of the metal-poor globular cluster population (also Ashman & Bird 1993). The globular cluster system of the luminous dE,N galaxy NGC 3115 DW1 was studied by Durrell et al. (1996a) and Puzia et al. (2000) who obtained mean metallicities and , respectively, and they both agreed on a specific frequency = 4.9. Durrell et al. (1996b) obtained, on the basis of Washington photometry, a low mean metallicity, , for the globular cluster systems of two dE galaxies in the Virgo Cluster and they suggested that the dwarf galaxies globular cluster systems present a similar range of metallicities ( to ) as globular clusters in the halos of spiral galaxies, in agreement with Ashman & Bird (1993). Turning to the Local Group, Minniti et al. (1996) constructed a master-dE galaxy combining the data from globular cluster systems of several dEs in this Group; they found an old and metal-poor globular cluster population whose metallicity distribution matched the one of the Milky Way halo globulars.
The abovementioned bimodality in the color distribution of globular clusters in elliptical galaxies, is closely related to the formation of the globular clusters and a variety of scenarios have been proposed (for reviews on the subject see, e.g., Ashman & Zepf 1998 or Harris 2001). Ashman & Zepf (1992) and Zepf & Ashman (1993) predicted this bimodal metallicity distribution of globulars in elliptical galaxies as a result of gas-rich mergers; they proposed that the blue population originally belonged to the progenitor galaxies and the red population formed during the merger. The numerical simulations from Bekki et al. (2002) showed that dissipative mergers create new globular clusters but they were not able to reproduce properly the bimodal metallicity distribution observed in elliptical galaxies.
A different point of view was exposed, e.g., by Forbes et al. (1997) who found a correlation between the mean metallicity of the metal-rich globular clusters and the parent galaxy luminosity, which suggested that they share the same chemical enrichment process, while the mean metallicity of the metal-poor ones seems to be independent of the galaxy luminosity. They proposed that the bimodality originated in two phases of globular cluster formation from gas with different metallicities, and that most of them formed ”in situ”. The HST study of 17 early-type galaxies by Larsen et al. (2001) showed a correlation between the colors of both, blue and red globular clusters populations, with the B-luminosity and central velocity dispersion of the host galaxy, and concluded that their observations support globular cluster formation ”in situ”, in the protogalaxy potential well.
Alternatively, Forbes & Forte (2001) analyzed the relation between the mean color of blue and red globulars with the galaxy velocity dispersion and suggested that red globular clusters share a common origin with the host galaxy and blue ones seem to have formed quite independently; according to Côté et al. (1998) these blue globular clusters may have been captured from other galaxies by merger processes or tidal stripping.
The idea of the accretion of dwarf galaxies into the cD halo of NGC 1399, the stripping of their gas and globular clusters and the formation of new clusters from this gas poses a different origin for the red globular clusters (Hilker et al. 1999). Burgarella et al. (2001) analyzed the blue globular cluster populations from 47 galaxies and found no correlation between their mean metallicity, which is very similar for all these systems, and the galaxy properties (luminosity, velocity dispersion, etc); they proposed that the metal-poor globular clusters may have formed from gas fragments of similar metallicity, as already suggested by Ashman & Bird (1993), and located within the dark halo of the galaxy.
More recently, the semianalytic model by Beasley et al. (2002) assumed that the metal-poor globular clusters formed in protogalactic fragments and the metal-rich ones originated in the gas-rich mergers of such fragments that occurred later.
Assuming the presence of globular clusters inside clusters of galaxies, an alternative scenario is proposed by White (1987) and West et al. (1995), who pointed to the possible existence of a population of globular clusters that are not bound to individual galaxies; instead, they are supposed to move freely in the central regions of the galaxy clusters. These intracluster globular clusters may be the result of interactions or mergers between the galaxies, or they may have formed precisely in the environment of a galaxy cluster without any parent galaxy. The kinematic analysis by Minniti et al. (1998) and by Kissler-Patig et al. (1999) also suggested that some globular clusters may be associated with the gravitational potential of the galaxy cluster and not solely with NGC 1399. On the other hand, Grillmair et al. (1999) found no evidence of intergalactic globular clusters in an HST/WFPC image at a radial distance of about from NGC 1399, but due to the small field of view, they were not able to rule out their existence. Several objections against the intraclusters were raised by Harris et al. (1998) who tried to explain by means of their existence the supposed high specific frequency of M87, the central Virgo galaxy; but the latest values of obtained for NGC 1399 by Ostrov et al. (1998) and Dirsch et al. (2002b) showed that it is not so high ( = 5.6 and 5.1, respectively).
In favor of the existence of intergalactic material, Theuns & Warren (1997), Mendez et al. (1997), and Ciardullo et al. (1998) presented evidence for the presence of intergalactic planetary nebulae within the Fornax and Virgo Clusters, while Ferguson et al. (1998) reported several hundred of intracluster red giants in Virgo. Some globular clusters may have been stripped with them from other cluster galaxies if this is their origin (Harris 2001).
In this paper, we analyze the characteristics of globular cluster candidates found near dwarf galaxies in the Fornax Cluster and its connection with the above mentioned scenarios. It is organized as follows: Section 2 describes the observations and the adopted criteria for the globular cluster candidates’ selection. In Sect. 3 we analyze the color distribution, luminosity function and spatial distribution of the candidates. Finally, a summary of the results and a discussion on their implications are provided in Sect. 4. Preliminary results of this work have been presented by Bassino et al. (2002).
2 Observations and globular cluster selection
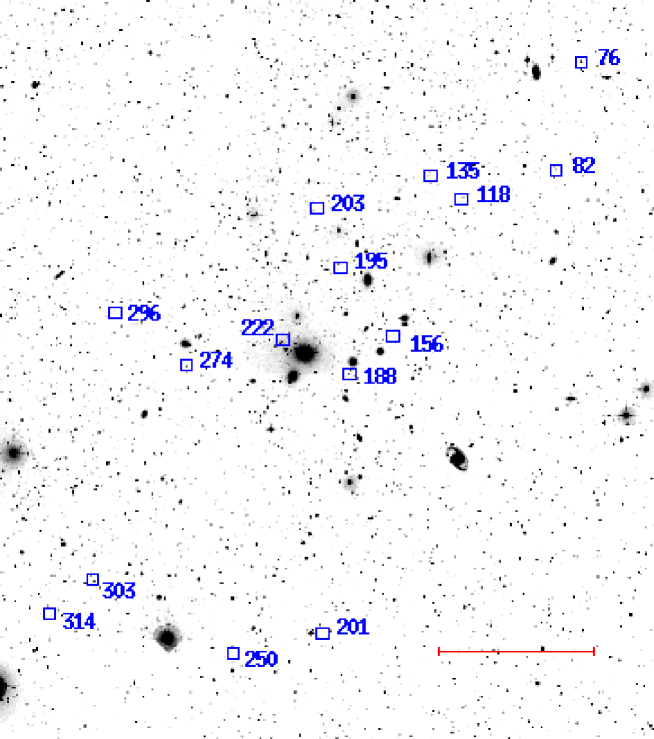
CCD images of 15 fields centered on low surface brightness (LSB) galaxies in the Fornax Cluster were obtained (with the original purpose of studying the LSB galaxies, Cellone et al. 1994; Cellone & Forte 1996) with the 0.90-m and 1.50-m telescopes at CTIO (Chile), during two observing runs in October 1989 and November 1990, and using the and filters of the Washington photometric system. The dwarf galaxies are listed in Table 1: the first column gives their FCC numbers (Ferguson 1989) and the second one gives the respective angular distances from NGC 1399, which will be considered as the center of the Cluster. The dwarfs are distributed in angular distance from 12′ up to 175′ from NGC 1399 (see Figure 1); as we will adopt a distance modulus of 31.35 for the Fornax Cluster throughout this paper (Madore et al. 1999), that corresponds to projected distances ranging between 65 and 950 kpc from the cluster center. The fields sizes range from 10 to 17 arcmin2; hence, they have the advantage of being larger than the ones studied by Miller et al. (1998a) to search for cluster candidates. However, they are not as deep as the HST images: we identify cluster candidates up to 22 mag while Miller et al. reach 25 mag (equivalent to 24.5 mag, according to the relation between these magnitudes obtained from Geisler (1996) and Cellone et al. (1994)). For a detailed description of the observations we refer to Cellone et al. (1994).
In order to identify the globular cluster candidates, we selected the point sources within certain ranges of colors and magnitudes. The analysis of each frame was carried out in the following steps:
-
1.
The dwarf galaxies were first removed using the IRAF111IRAF is distributed by the National Optical Astronomy Observatories, which is operated by AURA, Inc. under contract to the National Science Foundation. / STSDAS tasks “ellipse” and “bmodel”, which allowed us to fit elliptical isophotes to the galaxies, create a model based on them and subtract the model from the image.
-
2.
Using the photometric software SExtractor (Source-Extractor, Bertin & Arnouts 1996) we detected all the sources in the dwarf-subtracted frames, we measured their instrumental magnitudes and colors, and each object was classified with an “stellarity-index”, a tool for performing a reliable resolved/unresolved source separation. Among the different types of magnitudes that SExtractor measures, the “corrected isophotal” were selected as the most reliable ones for stellar-like sources (Arnouts et al. 1997).
-
3.
The instrumental magnitudes and colors were transformed to the standard system via the equations derived by Cellone et al. (1994), which were applied to the new measurements because they were both obtained by means of aperture photometry. The reddening towards the dwarfs’ fields was obtained from the Schlegel et al. (1998) maps and transformed into the Washington system by means of the relations given by Harris & Canterna (1979). As the mean estimated color–excess 0.02 mag is much smaller than the photometric errors (see below), it was considered negligible.
Table 1: Dwarf galaxies and surface densities of globular cluster candidates () in their fields. -
a
Distance from NGC 1399.
-
b
Number of globular cluster candidates/arcmin2 found in the corresponding dwarf field, without corrections.
-
c
Idem b but background–corrected.
-
a
-
4.
All the sources classified with an “stellarity-index” below 0.35 were considered as resolved sources and were discarded. The limiting index was estimated running DAOPHOT on several images as well as adding artificial stars to the frames, and comparing the results for different values of the “stellarity-index” with the results for the DAOPHOT indices “sharpness”, “chi” and “roundness” that allow the identification of point sources, galaxies and image defects.
-
5.
Finally, we selected as globular cluster candidates those point sources with: magnitudes mag and colors mag. We estimate that the completeness of the sample is larger than 90 % above magnitude 22 mag. This conservative cutoff prevents against any possible bias introduced by small variations in the photometric limit between different fields. Reassuringly, we found no correlation between effective exposure (considering telescope diameter and integration time) and surface density of globular cluster candidates. The number of globular cluster candidates that was identified in each dwarf galaxy’s field ranges from zero to ten, which corresponds to surface densities between 0.00 and 0.71 candidates/arcmin2, as is listed in the third column of Table 1.
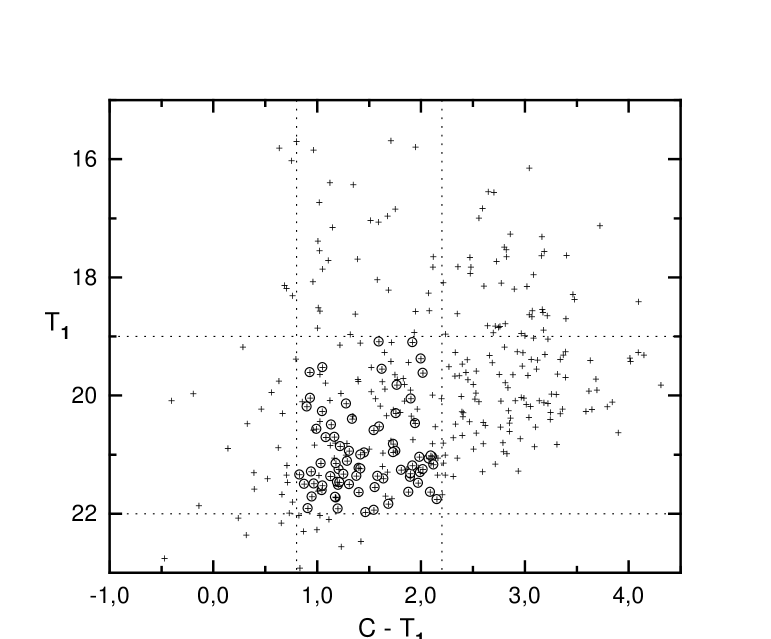
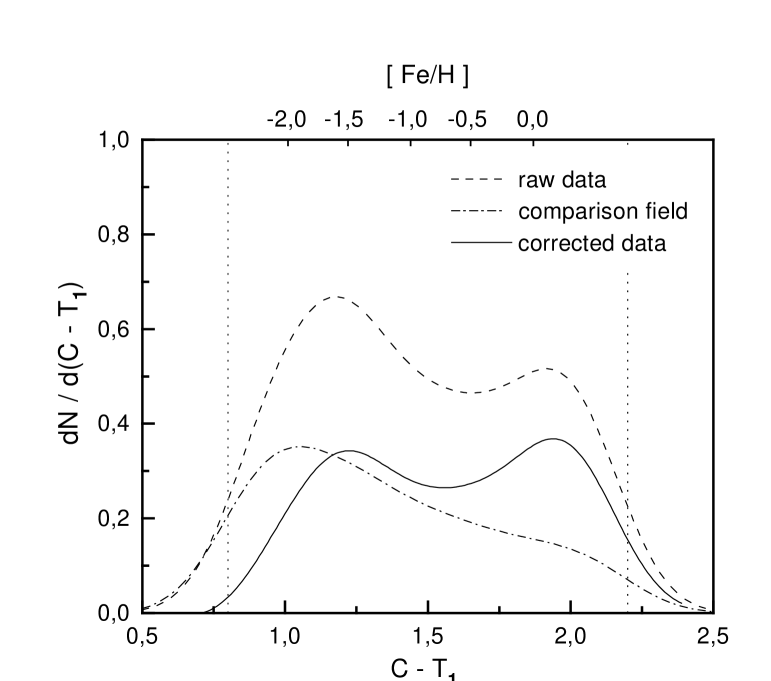
Figure 2 shows the color-magnitude diagram of all the identified sources (about 350), and the ones selected as globular cluster candidates (75). The mean photometric errors for the globular cluster candidates are 0.09 mag in and 0.15 mag in .
3 Results
We concentrate on the following features of the globular cluster candidates: their color distribution, their luminosity function, and their spatial distribution. Due to the small number of candidates found around each dwarf, we will analyze the characteristics of all of them together.
3.1 Color distribution
The color distribution is shown in Figure 3; it is an histogram smoothed by means of a Gaussian with a dispersion comparable to the errors in . The color-metallicity calibration from Geisler & Forte (1990) has also been included in this Figure. In order to take into account the background contamination we have used a comparison field located at north-east from the cluster center, which has already been used by Dirsch et al. (2002b) and whose color distribution is also shown in Figure 3, after normalizing for the different field sizes corresponding to the dwarfs’ images and to the background’s one. The comparison field was observed with and filters instead of and , but according to Geisler (1996), the Kron-Cousins and the Washington magnitudes are similar, to a high degree of accuracy, for the color range considered in this paper. The comparison field is not very far from FCC 76, the dwarf with the largest projected distance from NGC 1399 in the sample; thus, the contribution from the background may be probably overestimated and so we may be underestimating the surface densities obtained after this correction. The surface density of globular cluster candidates for each dwarf field, after the background-correction, is given in the last column of Table 1.
The color distribution of the raw data, as can be seen in Figure 3, is extended and appears to be bimodal (see also the color-magnitude diagram displayed in Figure 2). In order to quantify this apparent bimodality in a statistical way, we have applied to the raw data the KMM test which helps to detect and evaluate bimodality in datasets (see Ashman et al. 1994 for a description of the test and its application). The results of the test indicate that two Gaussians with means at 1.18 and 1.86 mag can be fit to the set of values, and assuming that both Gaussians have the same covariance (homoscedastic fitting) we obtain a dispersion = 0.2 mag for them. The hypothesis that this distribution is unimodal rather than bimodal is rejected at a confidence level of 100% according to the KMM test. It must be taken into account that the number of candidates is small (75 objects) but, according to the study of the KMM algorithm sensitivity performed by Ashman et al. (1994), there is a sufficient large separation in the means of the two Gaussians (3.4 ) to be able to obtain a significant rejection of the unimodal hypothesis.
The result of the background subtraction is also shown in Figure 3, where the corrected color distribution appears to be bimodal too, with two possible peaks that would be located at 1.2 and 1.9 mag, corresponding to metallicities [Fe/H] and 0.1, respectively (Geisler & Forte 1990). However, it is not possible to apply the KMM test to this corrected distribution because the number of candidates is smaller than 50, and Ashman et al. (1994) state that in this cases the test does not provide a reliable result for detecting bimodality. Anyway, even though we cannot confirm statistically the bimodality, it is clear that we do not find a single population of metal-poor globular cluster candidates around the dwarfs, as happens in the cases already mentioned in the Introduction; instead, an extended distribution that expands over the whole metallicity range, from metal-poor to metal-rich populations, is detected.
In spite of the apparent symmetry in the corrected color distribution displayed in Figure 3, we cannot be sure that the number of these probable metal-poor and metal-rich candidates are similar because we do not have a complete area sample. Figure 1 shows that there are more dwarfs near to NGC 1399 than far from it. We have not attempted to search for radial globular clusters color gradients with respect to the dwarfs or to the Fornax Cluster center due to the small sample we are considering.
Whether or not two globular cluster populations should be expected in dwarf galaxies is still unclear. All the globular clusters around dwarfs in the Local Group studied by Minniti et al. (1996) had metallicities that correspond to a metal-poor population, with [Fe/H] . They suggested that the dE galaxies included in their study seem to have formed no metal-rich globular clusters. In turn, Durrell et al. (1996b) found a possible bimodality in the colors of the globular clusters of the Virgo dwarf VCC 1254, which they speculate might correspond to two phases of globular cluster formation.
With regard to the results for the NGC 1399 globular cluster system, Ostrov et al. (1998) identified globular clusters located between and from the galaxy center finding two globular cluster populations with 1.3 and 1.8 mag, respectively. In turn, Dirsch et al. (2002b) performed a wide-field study of this system and showed that the innermost sample, between 18 and 45, was clearly bimodal with peaks at 1.3 and 1.75 mag; at larger radii, from 45 up to , the metal-poor population became dominant without changing the position of the blue peak.
3.2 Luminosity function
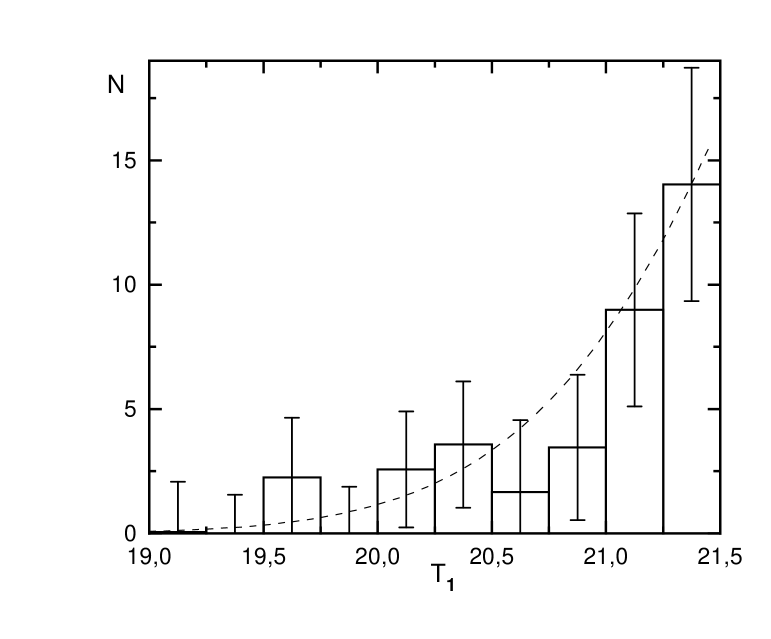
We plot the luminosity function (background-corrected) in Figure 4: an histogram of the number of globular cluster candidates vs. , where we use an upper limiting magnitude, mag, omitting the last bin where the completeness of the red candidates is more seriously affected. A Gaussian distribution, calculated with the parameters obtained by Ostrov et al. (1998) fitting the luminosity function of the NGC 1399 globular cluster system, is included for comparison.
Our sample covers only of the area under that Gaussian and, after background subtraction, we are left with 37 globular cluster candidates with magnitudes . Although it is a small sample, we attempt to compare it with the number of globular clusters that we should have found, in a similar area, if they belonged to the dwarf galaxies’ globular cluster systems. We calculate the total integrated brightness of our sample’s dEs by means of the total integrated magnitudes of the dwarfs given by Cellone et al. (1994), the adopted distance modulus to the Fornax Cluster and the relation between V and magnitudes mentioned above; thus, we obtain a total integrated visual brightness for the sample of mag. As the range of specific frequencies proposed for dEs is = 2–6 (Miller et al. 1998a; Elmegreen 1999), we estimate that we should have found between 4 and 13 globular cluster dwarfs’ GC candidates, within the mentioned range. By comparison, we have identified three to ten times more globular cluster candidates than what is inferred from the values.
3.3 Spatial distribution
3.3.1 Distribution with respect to the dwarf centers
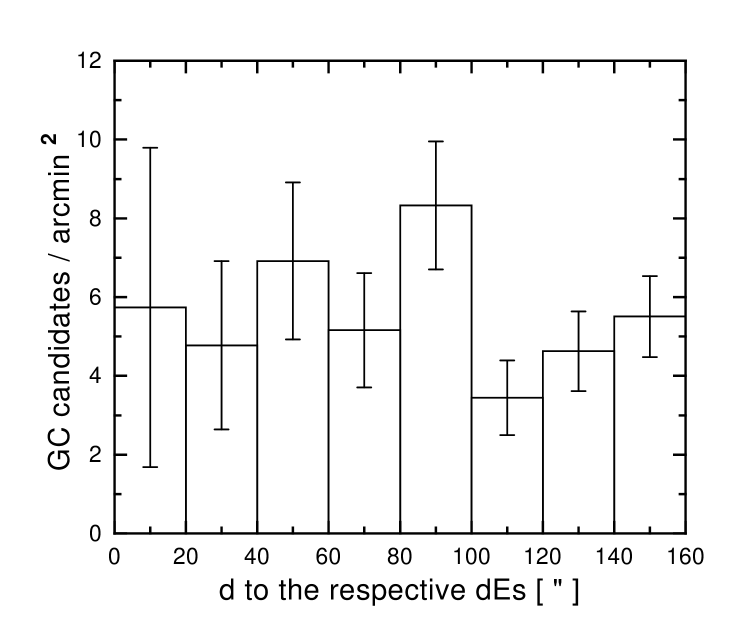
If the globular cluster candidates are bound to the respective dwarf galaxies, the projected density of globular clusters vs. galactocentric distance is expected to increase towards the center. This behavior can be clearly seen in the Fig. 5 of Lotz et al. (2001), which shows the summed radial distribution of globular cluster candidates from a sample of 51 dEs.
Figure 5 depicts the surface number density of globular clusters (background-corrected), calculated in concentric annuli around each of the dwarfs and summed over all of them. These surface densities are estimated as follows. First, a set of 20″wide annuli is established around each dwarf, taking into account the different scales of the images. For each image, annuli with more than 60% of their area outside the frame limits were discarded, thus leading to the 160″ limit in angular distance. Then, for each dwarf, the number of globular candidates is estimated within each annulus, applying a completeness correction to the annuli lying partly outside the corresponding frame. Afterwards, the counts for each annulus are background-corrected, subtracting the density of the background field multiplied by the area of the corresponding complete annulus. Finally, the background-corrected counts are summed over the annuli defined by the same angular distance from each dwarf, and divided by its complete area.
As can be seen in Figure 5, no concentration towards the center is evident. In order to demonstrate this statistically, we compare this observed distribution with a uniform distribution, that is, one with a constant number density calculated as the same number of globular clusters, scattered across the same total area. The result of a test performed between them, indicates that the observed distribution is statistically consistent with being drawn from a uniform distribution at a significance level of 89 %. Under this evidence, it is not possible to assert that these globular cluster candidates are bound to the respective dwarfs as they show no concentration to the dwarf centers, although we cannot confirm this hypothesis without the aid of radial velocities.
We must take into account that the studied radial distribution shown in Figure 5 extends up to 14 kpc from the center of the dEs. The radial density profiles from Lotz et al. (2001) reach almost zero value at shorter distances from the dwarfs, between 1.1 and 8.7 kpc, according to the dwarf’s exponential scalelength they use and the distance modulus we have adopted, while the summed radial distribution of the globular cluster system for 11 Virgo dEs by Durrell et al. (1996b) extends to only 2.5 kpc. Both results indicate that the globular cluster systems of dwarfs are rather compact.
3.3.2 Distribution with respect to the Cluster center
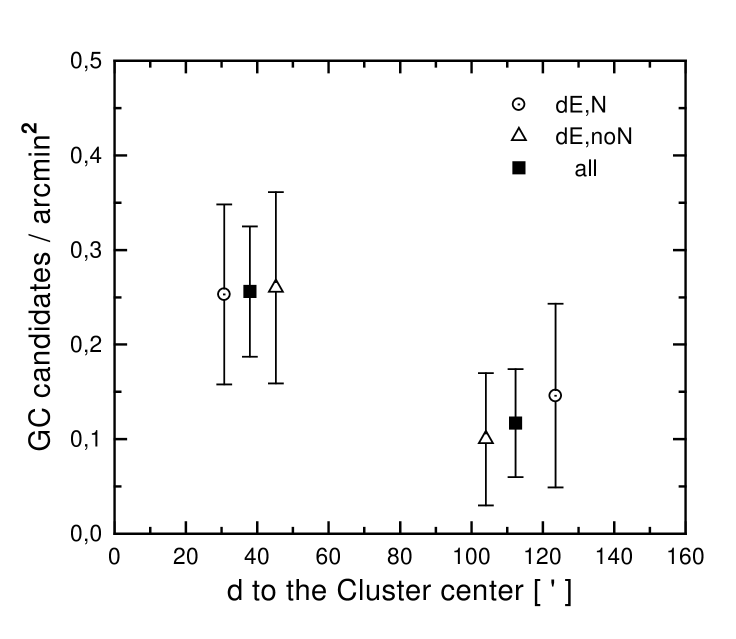
Finally, we studied the surface density of the potential globular clusters but now vs. the distance to the center of the Fornax Cluster, more precisely to NGC 1399 (Figure 6). As the number of GC candidates is small, we consider them in two separate groups to reinforce the statistic: the globular clusters located nearer than 80′ from NGC 1399 and those between 80′ and 160′ from it.
The surface densities of globulars were calculated as the number of clusters (background-corrected) around the dwarfs corresponding to each group, divided by the total surveyed area in each case. We have excluded the two dwarf galaxies more distant from the center, at more than : that is FCC 76 and FCC 314. FCC 76 has probably underwent recent star-formation (Cellone et al. 1994) while FCC 314 is seen projected on to a background cluster of galaxies, so both of them could led to misleading results for the distribution of globular cluster candidates with respect to the cluster center.
Although the statistical noise is relatively large, the results show that the globular clusters located closer to the cluster center have a higher projected density than the ones located farther than 80′, which seem to be approaching to zero density. As the values for nucleated dEs are higher than for non-nucleated dEs (Miller et al. 1998a), we also estimate separately the surface density of the globular cluster candidates around dwarfs with nucleus and without it. They are included in Figure 6 and show no difference between them or with the results for all the dEs together.
4 Discussion
With regard to the color distribution of the globular cluster candidates, it is interesting to note that we do not find a single population, the metal-poor one, as seems to be the common case for dwarf galaxies (Durrell et al. 1996b; Miller et al. 1998a, b; Miller 1999), but an extended distribution, which appears to be bimodal though we cannot prove it statistically due to the small sample involved. In addition, if we take into account the specific frequency estimated for dwarf galaxies (Miller et al. 1998a; Elmegreen 1999) and the luminosity function of the globular cluster candidates, we should have found significantly fewer globular cluster candidates than we actually do.
According to the projected density of the potential globular clusters, they show no concentration towards the dwarfs while they do show concentration with respect to the center of the cluster. These results led us to speculate that the globular cluster candidates may not be associated to the dwarf galaxies themselves. We are then left with three possibilities: first, that these globular cluster candidates belong to the globular cluster system of NGC 1399; second, they may be moving freely throughout the potential well of the cluster, without being bound to any galaxy in particular; or third, that they are a mix of both. In the first case, we should be accepting that the globular cluster system of NGC 1399 is much more extended and numerous than previously thought. According to this hypothesis, Figure 6 suggests that there should be clusters up to at least an intermediate angular distance of 80′ (a projected distance of about 430 kpc) from the central galaxy; the CCD study over the largest area around NGC 1399 was performed by Dirsch et al. (2002b), which extends up to 22′, and showed that the globular cluster system extends over a radial projected distance of more than 100 kpc.
The total number (background corrected) of globular clusters within the area covered by our observations can be roughly estimated as about 550 clusters, by extrapolating their luminosity function over the whole range of magnitudes. Thus, the number of clusters that should be distributed within a circular area of radius 80′around NGC 1399 may be calculated, just taking into account the ratio of the areas, as several clusters. For comparison, the total number of globular clusters associated with galaxies in the Fornax Cluster may also be roughly estimated as follows. The blue magnitude of all the galaxies included in the Ferguson (1989) catalogue is mag; adopting for them a mean color index mag and the distance modulus mentioned above, we obtain an absolute visual magnitude . If we assume a ”typical” specific frequency we conclude that about globular clusters should be associated with galaxies in Fornax. It is interesting to note that the number of globular clusters that we found within a circular area of radius 80′around NGC 1399 is of the same order o larger than the estimated number of globulars associated to galaxies in the whole Fornax Cluster.
It is also likely that some globular clusters might have escaped from its parent galaxies and, after that, remained within the potential well of the Fornax Cluster as a whole (see, for instance, Kissler-Patig et al. 1999). White (1987) propose that the distribution of the stripped globular clusters within the cluster will follow the same density profile as the galaxies and they might form a kind of envelope around the central galaxy. Alternative origins for the intraclusters are mentioned by West et al. (1995), who speculate that they might have formed “in situ”, without a parent galaxy, or during mergers of sub-systems with a high gas content.
Deeper images are required to clarify this picture and a new survey in the Fornax Cluster is in progress. The true nature of these candidates might be confirmed by means of spectra.
Acknowledgements.
We wish to thank the referee, Dr. M. Kissler-Patig, for his comments which helped to improve the present paper. We are also grateful to S. D. Abal, M. C. Fanjul and R. E. Martínez for technical assistance. This work was partially supported by grants from CONICET and Fundación Antorchas, Argentina.References
- Arnouts et al. (1997) Arnouts, S., de Lapparent, V., Mathez, G., et al. 1997, A&AS, 124, 163
- Ashman & Bird (1993) Ashman, K.M., & Bird, C.M. 1993, AJ, 106, 2281
- Ashman & Zepf (1992) Ashman, K.M., & Zepf, S.E. 1992, ApJ, 384, 50
- Ashman & Zepf (1998) Ashman, K.M., & Zepf, S.E. 1998, Globular Clusters Systems, (Cambridge: Cambridge University Press)
- Ashman et al. (1994) Ashman, K.M., Bird, C.M.,& Zepf, S.E. 1994, AJ, 108, 2348
- Bassino et al. (2002) Bassino, L.P., Cellone, S.A., & Forte, J.C. 2002, IAU Symp. Ser. 207, in press
- Beasley et al. (2002) Beasley, M.A., Baugh, C.M.; Forbes, D.A., Sharples, R.M., & Frenk, C.S. 2002, MNRAS, 333, 383
- Bekki et al. (2002) Bekki, K., Forbes, D.A., Beasley, M.A., & Couch, W.J. 2002, MNRAS, 335, 1176
- Bertin & Arnouts (1996) Bertin, E., & Arnouts, S. 1996, A&AS, 117, 393
- Blakeslee & Tonry (1996) Blakeslee, J.P., & Tonry, J.L. 1996, ApJ, 465, L19
- Bridges at al. (1991) Bridges, T.J., Hanes, D.A., & Harris, W.E., 1991, AJ, 101, 469
- Burgarella et al. (2001) Burgarella, D., Kissler-Patig, M., & Buat, V. 2001, AJ, 121, 2647
- Carretta & Gratton (1997) Carretta, E., & Gratton, R.G. 1997, A&AS, 121, 95
- Cellone et al. (1994) Cellone, S.A., Forte, J.C., & Geisler, D. 1994, ApJS, 93, 397
- Cellone & Forte (1996) Cellone, S.A., & Forte, J.C. 1996, ApJ, 416, 176
- Ciardullo et al. (1998) Ciardullo, R., Jacoby, G.H., Feldmeier, J.J., & Bartlett, R.E. 1998, ApJ, 492, 62
- Côté et al. (1998) Côté, P., Marzke, R.O., & West, M.J. 1998, ApJ, 501, 554
- Dirsch et al. (2002a) Dirsch, B., Geisler, D., & Richtler, T. 2002a, IAU Symp. Ser. 207, in press [astro-ph 0109192]
- Dirsch et al. (2002b) Dirsch, B., Richtler, T., Geisler, D., et al. 2002b, AJ, submitted
- Durrell et al. (1996a) Durrell, P.R., McLaughlin, D.E., Harris, W.E., & Hanes, D.A. 1996, ApJ, 463, 543
- Durrell et al. (1996b) Durrell, P.R., Harris, W.E., Geisler, D., & Pudritz, R.E. 1996, AJ, 112, 972
- Elmegreen (1999) Elmegreen B. 1999, Ap&SS, 269–270, 469
- Ferguson (1989) Ferguson, H.C. 1989, AJ, 98, 367
- Ferguson et al. (1998) Ferguson, H.C., Tanvir, N.R., & von Hippel, T. 1998, Nature, 391, 461
- Ferguson & Sandage (1990) Ferguson, H.C., & Sandage, A. 1990, AJ, 100, 1
- Forbes et al. (1997) Forbes D.A., Brodie, J.P., & Grillmair, C.J. 1997, AJ, 113, 1652
- Forbes et al. (1998) Forbes D.A., Grillmair, C.J., Williger, G.M., Elson, R.A.W., & Brodie, J.P. 1998, MNRAS, 293, 325
- Forbes & Forte (2001) Forbes D.A., & Forte, J.C. 2001, MNRAS, 322, 257
- Geisler (1996) Geisler, D. 1996, AJ, 111, 480
- Geisler & Forte (1990) Geisler, D., & Forte, J. C. 1990, ApJ, 350, L5
- Grillmair et al. (1999) Grillmair, C.J., Forbes, D.A., Brodie, J.P., & Elson, R. 1999, AJ, 117, 167
- Harris & Canterna (1979) Harris, H.C., & Canterna, R. 1979, AJ, 84, 1750
- Harris (2001) Harris, W.E. 2001, in Star Clusters, Saas-Fee Advanced Course 28, eds. L. Labhardt & B. Binggeli (Berlin: Springer-Verlag), 223
- Harris et al. (1998) Harris, W.E., Harris, G.L.H., & McLaughlin, D.E. 1998, AJ, 115, 1801
- Hilker et al. (1999) Hilker, M, Infante, L., & Richtler, T. 1999, A&AS, 138, 55
- Kissler-Patig et al. (1997) Kissler-Patig, M., Kohle, S., Hilker, M., et al. 1997, A&A, 319, 470
- Kissler-Patig et al. (1999) Kissler-Patig, M., Grillmair, C.J., Meylan, G., et al. 1999, AJ, 117, 1206
- Larsen et al. (2001) Larsen, S.S., Brodie, J.P., Huchra, J.P., Forbes, D.A., & Grillmair, C.J. 2001, AJ, 121, 2974
- Lotz et al. (2001) Lotz, J.M., Telford, R., Ferguson, H.C., et al. 2001, ApJ, 552, 572
- Madore et al. (1999) Madore, B.F., Freedman, W.L., Silbermann, N., et al. 1999, ApJ, 515, 29
- Mendez et al. (1997) Mendez, R.H., Guerrero, M.A., Freeman, K.C., et al. 1997, ApJ, 491, L23
- Miller et al. (1998a) Miller, B.W., Lotz, J.M., Ferguson, H.C., Stiavelli, M., & Whitmore, B.C. 1998a, ApJ, 508, L133
- Miller et al. (1998b) Miller, B.W., Lotz, J.M., Ferguson, H.C., Stiavelli, M., & Whitmore, B.C. 1998b, AAS 193, #123.07
- Miller (1999) Miller, B.W. 1999, AAS 194, #40.12
- Minniti et al. (1996) Minniti, D., Meylan, G., & Kissler-Patig, M. 1996, A&A, 312, 49
- Minniti et al. (1998) Minniti, D., Kissler-Patig, M., Goudfrooij, P., & Meylan, G. 1998, AJ, 115, 121
- Ostrov et al. (1993) Ostrov, P.G, Geisler, D., & Forte, J. C. 1993, AJ, 105, 1762
- Ostrov et al. (1998) Ostrov, P.G, Forte, J.C., & Geisler, D. 1998, AJ, 116, 2854
- Puzia et al. (2000) Puzia, T.H., Kissler-Patig, M., Brodie, J.P., & Schroder, L.L. 2000, AJ, 120, 777
- Schlegel et al. (1998) Schlegel, D.J., Finkbeiner, D.P., & Davis, M. 1998, ApJ, 500, 525
- Theuns & Warren (1997) Theuns, T., & Warren, S.J. 1997, MNRAS, 284, L11
- West et al. (1995) West, M.J., Côtè, P., Jones, C., Forman, W., & Marzke, R.O. 1995, AJ, 453, L77
- White (1987) White, R.E. 1987, MNRAS, 227, 185
- Zepf & Ashman (1993) Zepf, S.E., & Ashman, K.M. 1993, MNRAS, 264, 611