Are there cosmological evolution trends on Gamma-Ray Burst features?
Abstract
The variability of gamma-ray burst (GRB) is thought to be correlated with its absolute peak luminosity, and this relation had been used to derive an estimate of the redshifts of GRBs. Recently Amati et al. presented the results of spectral and energetic properties of several GRBs with known redshifts. Here we analyse the properties of two group GRBs, one group with known redshift from afterglow observation, and another group with redshift derived from the luminosity - variability relation. We study the redshift dependence of various GRBs features in their cosmological rest frames, including the burst duration, the isotropic luminosity and radiated energy, and the peak energy of spectra. We find that, for these two group GRBs, their properties are all redshift dependent, i.e. their intrinsic duration, luminosity, radiated energy and peak energy , are all correlated with the redshift, which means that there are cosmological evolution effects on gamma-ray bursts features, and this can provide an interesting clue to the nature of GRBs. If this is true, then the results also imply that the redshift derived from the luminosity - variability relation may be reliable.
keywords:
gamma rays: burstssubmitted to MNRAS Main Journal
All correspondence please send to:
D.M. Wei
Purple Mountain Observatory
Chinese Academy of Sciences
Nanjing, 210008
P.R. China
email: dmwei@pmo.ac.cn
fax: 8625-3307381
1 Introduction
The study of gamma-ray bursts (GRBs) afterglows has enable the measurement of their distances, so far GRBs are known as an explosive phenomenon occurring at cosmological distances, emitting large amount of energy mostly in the gamma-ray range (see, e.g. Piran 1999; Cheng & Lu 2001 for a review). So GRBs can provide useful information about the early epochs in the history of the universe.
Although a great achievements have been made about the GRB afterglows, we still know little about the origin of gamma-ray bursts, the reason is that the GRBs with known redshifts are relatively rare, now there are only about 20 GRBs with known redshifts, so it is difficult to do some statistics about GRBs features, such as their luminosity function, duration distribution, etc.. However, two important correlations have been discovered, i.e. between the degree of variability of the gamma-ray burst light curve and the GRB luminosity (Ramirez-Ruiz & Fenimore 1999; Feminore & Ramirez-Ruiz 2001), and between the differential time lags for the arrival of burst pulses at different energies and the GRB luminosity (Norris, Marani & Bonnell 2000), although these correlations are still tentative, they offer the possibility to derive independent estimates of the redshifts of GRBs.
Recently Amati et al. (2002) have reported the spectral and energetic properties of several GRBs with known redshifts, these bursts were all detected by BeppoSAX and have good-quality time-integrated spectra. In addition, Lloyd-Ronning & Ramirez-Ruiz (2002) have found that bursts with highly variable light curves have greater spectral peak energies in their cosmological rest frames. These results reinforce the validity of the redshift estimates derived from the luminosity - variability relation. Here we will discuss the properties of two group GRBs, one group includes the bursts with known redshifts and well-defined spectra detected by BeppoSAX, and another group consists of bursts whose redshifts are derived from the luminosity - variability relation. We will show that the properties of these two group GRBs are all correlated with redshift, which suggests that the luminosity - variability relation may be reliable, and furthermore the GRBs’ features are redshift dependent.
2 The Properties of Two Group GRBs
Amati et al. (2002) have analysed the spectral properties of the X-ray and gamma-ray emission from GRBs with known redshifts. Those bursts were all detected by BeppoSAX satellite and have good-quality spectra. The extension of the spectral analysis to the X-ray energy band allows a better determination of the continuum spectrum, reducing the bias in the measurement of the spectral slope below the peak energy of spectra. In their sample total 12 gamma-ray bursts were included, however among them, there are three bursts (GRB980326, GRB980329 and GRB000214) whose redshifts are not determined accurately, only redshift intervals are given, so in our one group we ignore these three bursts, and contains the other 9 bursts with firm redshifts.
GRB temporal profiles are so complicated that, at first sight, their behavior obeys no simple rule. However, several authors have suggested that there may be correlation between the properties of burst time structure and burst luminosity (e.g. Feminore & Ramirez-Ruiz 2001; Reichart et al. 2001; Norris, Marani & Bonnell 2000). In particular, Fenimore & Ramirez-Ruiz (2001) explored the possibility of using the ”spikiness” of the time structure, combined with the observed flux, to obtain the GRB redshifts. They have analysed several hundred long and bright bursts and derived the redshifts and luminosities for 220 BATSE bursts. Lloyd-Ronning & Ramirez-Ruiz (2002) used total 159 bursts from the above 220 GRBs to investigate the dependence of the burst spectra on variability. The observed spectra of these 159 bursts can be well characterized by the Band function (Band et al. 1993), defined by a low energy spectral index , a high energy spectral index , and a peak energy of the spectra . So our second group consists of these 159 bursts with known peak energy, and the redshifts of them are derived from the luminosity - variability relation (Feminore & Ramirez-Ruiz 2001).
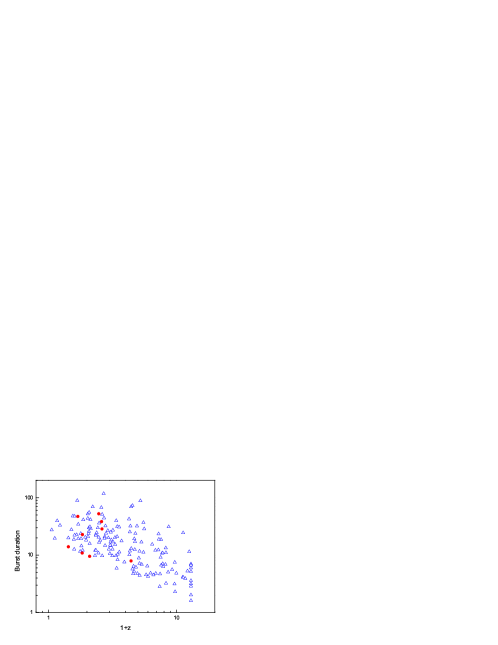
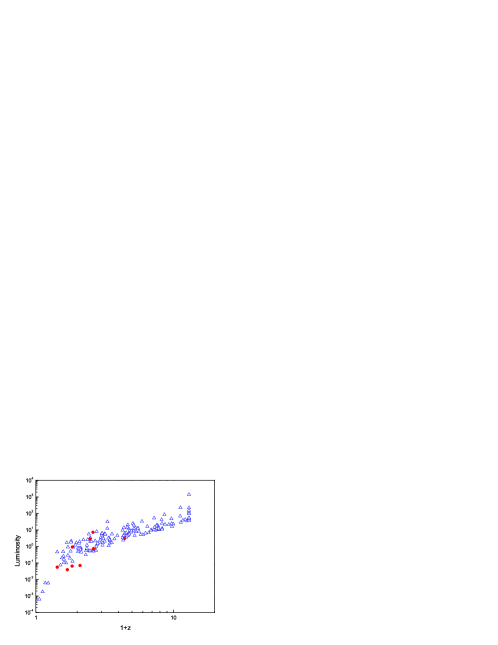
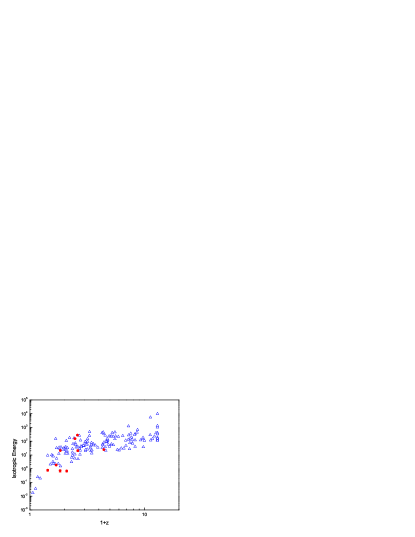
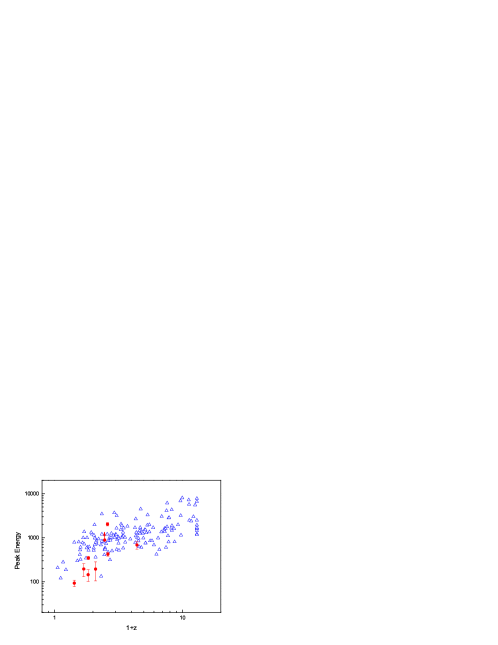
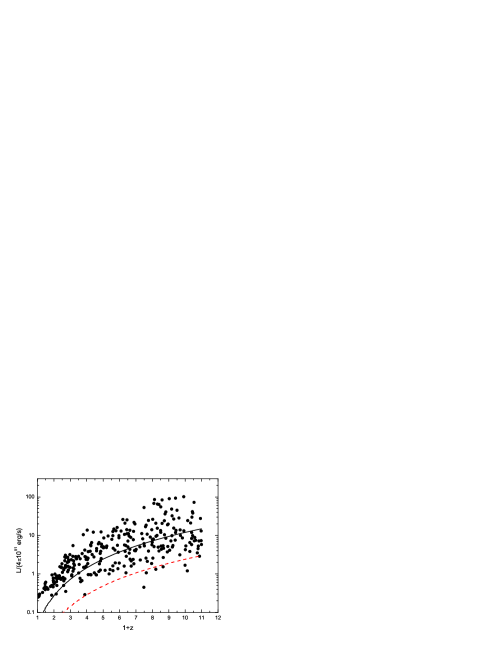
Fig.1 gives the GRB duration in their cosmological rest frame, , versus the redshift, where is the intrinsic duration and is the observed duration of a burst. The filled circles are bursts with secure redshifts estimates, while the empty triangles are bursts in which the redshifts are derived using the luminosity - variability distance indicator. Fig.2 and Fig.3 show the luminosity and radiated energy of GRBs in their cosmological rest frame versus the redshift, Fig.4 shows the relation between the peak energy of the spectra in their cosmological rest frame and the redshift.
From Fig.1 we see that although the distribution of the burst duration is somewhat scatter, there is still a clear trend that the intrinsic duration decreases with the redshift, if we fit a power law to the data, we find . Fig.2 and Fig.3 show that the isotropic luminosity and radiated energy have a positive correlation with the redshift, excluding the 4 bursts with smallest redshifts, we have , . Fig.4 shows that the peak energy of spectra also has a positive correlation with the redshift, the power law fit is .
However, we know that the BATSE GRB sample is flux truncated, i.e. only those bursts whose flux exceeding the threshold flux can be detected, this effect can give rise to several apparent correlations. For example, the burst duration (e.g. ) are defined by the time interval over which of the fluence is detected. High-z bursts are fainter, therefore some faint components of an intrinsic long burst could have been cut out by the flux threshold effect, so that their apparent durations are shortened. For another example, the correlation trend in both Fog.2 and Fig.3 are also contaminated by the flux truncation effect, as has been demonstrated by Lloyd-Ronning et al.(2002). So we need some way to estimate the true correlations between parameters that suffering from flux truncation.
Here we use the Monte Carlo simulation method. We simulate the burst sample, assuming their luminosity satisfy , and their redshifts are distributed uniformly between 0 and 10. In our simulation, we take the value erg s-1, the flux threshold is erg cm-2 s-1, and the Hubble constant km s-1 Mpc-1, , . Under this circumstance, we produce 300 bursts in original sample, and find that 100 bursts of them with flux lower than the threshold, so there are 200 bursts in our ”observed” sample. Fig.5 shows our simulation results, where the circles are the 300 bursts produced by simulation, and the solid line is the flux threshold for BATSE. We find that, when , there is the relation , which is consistent with the observed value. So we see that the flux truncation has great effect on the correlation coefficient.
In order to discuss this flux truncation effect on the burst duration, one needs to know the intrinsic pulse profile. For simplicity, here we assume the intrinsic pulse profile , since only the component with can be observed (where is the limit luminosity corresponding to the flux threshold), so we can get the observed pulse duration . The intrinsic pulse duration should be proportional to , which is assumed to have the form , is assumed to take the form described above, . As above, we produce a GRB sample with 300 bursts, 100 bursts of them are not ”observed” due to their low flux, so the remaining 200 bursts consists of our ”observed” sample. We find that when we take the value of , the ”observed” sample has the relation , which is compatible with the observed value.
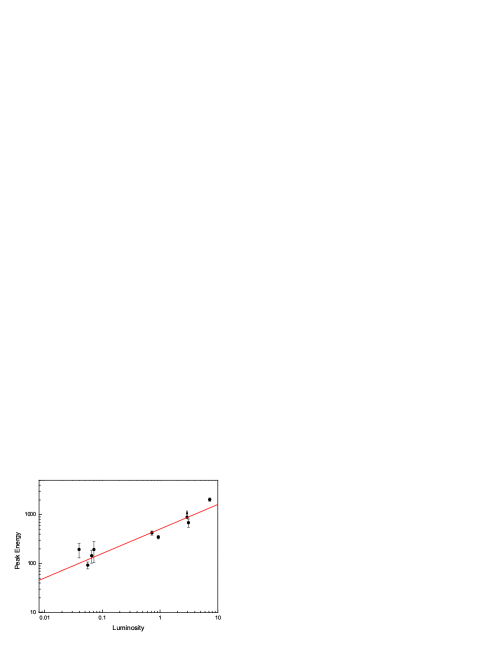
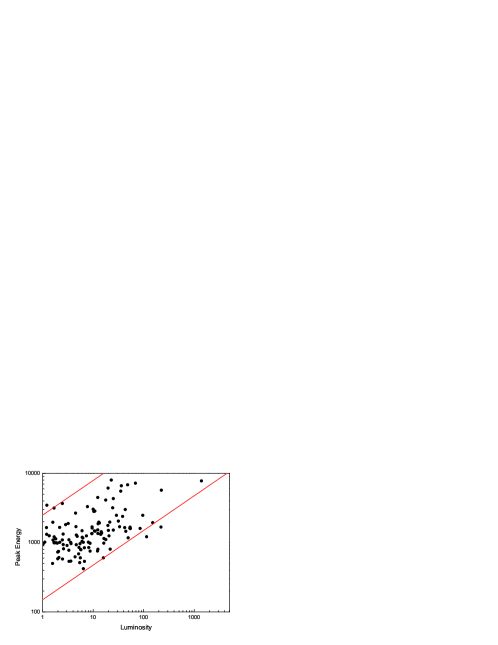
Fig.6 shows the relation between the intrinsic peak energy of the spectra and the luminosity for group one, the solid line represents the relation . Fig.7 gives the intrinsic peak energy of spectra versus the luminosity for group two, the two solid lines represent the relation . We see that the relation can account for the observed data quite well.
3 Discussion and conclusion
In previous section we have shown that the properties of our two group GRBs, one group includes 9 GRBs with secure redshifts derived from the afterglow observation, another group consists of 159 GRBs with known peak energy and their redshifts are derived from the luminosity - variability relation, are all correlated with the redshifts, which reinforces the validity of the luminosity - variability distance indicator. Our results further support the conclusion obtained by Lloyd-Ronning & Ramirez-Ruiz (2002), they found that there is positive correlation between the peak energy in the cosmological rest frame and the variability for gamma-ray bursts whose redshifts are derived either from optical spectral features or from the luminosity - variability distance indicator.
Since the BATSE GRB sample is flux truncated, i.e. only those bursts with flux exceeding the threshold flux can be detected, so it is necessary to discuss this selection effects on the statistical results. Here we use the Monte Carlo simulation method. We find that, after correcting the selection effects, the cosmological evolution trends are still exist, although they are much shallower than the trends found in the face values of the data. For example, if ignored the flux truncation effect, we obtained the relation , while when the selection effects are taken into account, we got the relation , which is consistent with the value obtained by Lloyd-Ronning et al. (2002).
Fig.5 illustrates our simulated results, where the circles are the 300 bursts produced by the simulation, the solid line is the flux threshold for BATSE, and the dashed line is the flux threshold for Swift. From this figure it is obvious that the property of the ”observed” sample should depend on the adopted flux threshold, for different flux threshold their statistical properties are different. For example, when taking the BATSE flux threshold, there are 100 bursts with flux lower than the threshold, while when taking the Swift flux threshold, there are only 7 bursts with flux lower than the threshold, so in this case the observed relation should close to the true relation. Therefore we expect that the luminosity - redshift relation for bursts observed by Swift should be shallower than that for bursts observed by BATSE.
Fig.6 and Fig.7 show that there is a good correlation between the peak energy and luminosity for both group GRBs, and the relation can account for the observed data quite well. Up to now the location of the GRB emission site is still unsettled, although the internal shock model is thought to be more reasonable than the external shock model. Zhang & Meszaros (2002b) analysed various fireball models within a unified picture and investigated the predictions of different models. It is known that for internal shock model, if the GRB bulk Lorentz factors are not correlated with the luminosities, then there is the relation , while for external shock model , where is the shock Lorentz factor. So our results suggest that the gamma-ray burst emission are more likely from the internal shock.
Frail et al. have discussed the afterglow properties of several GRBs with known redshifts, they assumed that the breaks in the afterglow light curves are caused by the sideways expansion of the jet, and then they concluded that the GRB emission energy is nearly a constant, ergs (Frail et al. 2001). However, Fig.3 shows that the isotropic radiated energy increases with redshift, so if the conclusion of Frail et al. is true, then we notice that the jet opening angle must decrease with the redshift, as shown by Fig.8, where the data points are taken from the paper of Frail et al. (2001). This point is very interesting, since it can put constraints on the central engines of GRBs. Of course, this phenomena can also be explained within the framework of a structured universal jet model (Zhang & Meszaros 2002a; Rossi et al. 2002). In this model, an observer closer to the jet axis would detect a higher luminosity, thus at higher redshift, smaller viewing angle detections are preferred due to luminosity selection effect.

It should be noted that in our analysis we have not considered the errors coming from the luminosity - variability relation. We know that the relation between luminosity and variability is somewhat scatter, the correlation coefficient () can be range from 2.2 to 5.8 (the best value is 3.3, see Fenimore & Ramirez-Ruiz 2001), so it is natural that the redshifts and luminosities inferred from this luminosity - variability relation should have large errors, and these errors should be somehow transferred to the final errors in the correlation indices. However this effect is very complicated, we hope that this effect can be taken into account in the future work.
In summary, in this paper we discuss the properties of two group GRBs, one group with known redshift from afterglow observation, and another group with redshift derived from the luminosity - variability relation. We find that the properties of these two group GRBs are all correlated with the redshifts, which reinforces the validity of the redshift estimates derived from the luminosity - variability relation. If this is true, then we see that the burst features, such as their intrinsic duration, luminosity, radiated energy and peak energy , are all redshift dependent, which means that there are cosmological evolution effects on gamma-ray bursts features, and this can provide an interesting clue to the nature of GRBs.
4 acknowledgements
We are very grateful to the referee for several important comments that greatly improved this paper. This work is supported by the National Natural Science Foundation (grants 10073022, 10233010 and 10225314) and the National 973 Project on Fundamental Researches of China (NKBRSF G19990754).
References
- [] Amati, L., et al., 2002, A&A, 390, 81
- [] Band, D., et al., 1993, ApJ, 413, 281
- [] Cheng, K.S., Lu, T., 2001, ChJAA, 1, 1
- [] Fenimore, E. E., & Ramirez-Ruiz, E. 2001, ApJ, submitted (astro-ph/0004176)
- [] Frail, D.A., et al., 2001, ApJ, 562, L55
- [] Lloyd-Ronning, N.M., Ramirez-Ruiz, E., 2002, ApJ, 576, 101
- [] Lloyd-Ronning, N.M., Fryer, C.L., Ramirez-Ruiz, E., 2002, ApJ, 574, 554
- [] Norris, J. P., Marani, G. F., & Bonnel, J. T. 2000, ApJ, 534, 248
- [] Piran, T., 1999, Phys. Rep., 314, 575
- [] Ramirez-Ruiz, E., & Fenimore, E. 1999, Presentation at the 1999 Huntsville GRB conference.
- [] Reichart, D.E., Lamb, D.Q., Fenimore, E.E., et al. 2001, ApJ, 552, 57
- [] Rossi, E., Lazzati, D., & Rees, M.J., 2002, MNRAS, 332, 945
- [] Zhang, B., & Meszaros, P., 2002a, ApJ, 571, 876
- [] Zhang, B., & Meszaros, P., 2002b, ApJ, 581, 1236