The impact of HH2 on local dust and gas
Abstract
We present results from a study of molecular gas and dust in the vicinity of the Herbig Haro object HH2. Emission from the sub-mm continuum, 12CO and HCO+ was mapped with angular resolutions ranging from 14 to 5 (or 0.01 pc at the distance of HH2). The continuum shows an extended dust clump of mass 3.8M⊙ and temperature 22K, located downstream of the bright optical HH knots. However, a compact emission peak lies within 0.01 pc of the low-excitation H2-prominent shocks, with a luminosity consistent with local heating by the outflow.
The HCO+ emission shows two velocity components: firstly, ambient-velocity gas lying in a region roughly corresponding to the dust clump, with abundance enhanced by a factor of a few close to the H2-prominent knots. Secondly a component of high-velocity emission (20 linewidth), found mainly in a collimated jet linking the low-excitation HH objects. In this high-velocity jet, the line wings show an abundance ratio , with an HCO+ enhancement compared with ambient gas of up to at the most extreme velocities. Such high abundances are consistent with models of shock chemistry in turbulent mixing layers at the interaction boundaries of jets. Extrapolating this effect to low velocities suggests that the more modest HCO+ enhancement in the clump gas could be caused by low velocity shocks. A UV precursor may not, therefore be necessary to explain the elevated HCO+ abundance in this gas.
keywords:
individual objects: HH2 - ISM: jets and outflows - ISM: Herbig-Haro objects1 Introduction
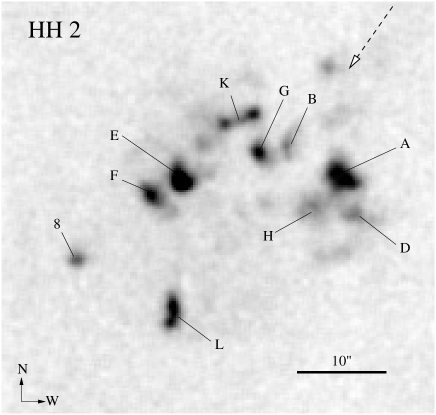
The Herbig-Haro objects HH1 and HH2 are two of the brightest optical shocks associated with outflows from young stars. Separated by 140 or 0.3 pc at the distance of 460 pc, both their proper motions and the detection of a faint jet indicate they are driven by the embedded 32 Class I young star known as VLA1 (Herbig & Jones, 1981; Pravdo et al., 1985). Because of their brightness, HH1 and 2 have been the subject of intense study, particularly in optical and near-infrared lines used to tracing shocked gas (eg Hester et al., 1998). The images show complex and sometimes bewildering structures which, in the case of HH1, are often interpreted as multiple overlapping bow shocks. HH2, however, shows an apparently more random set of knots, although it too has a number of mini-bow shocks identified through infrared images (eg Davis et al., 1994). In order to aid orientation in the region, in Figure 1 we show a near-IR H2 image of the cluster of shock fronts that comprise HH2 (from Davis et al. 1994). Individual features and knots are labelled.
In addition to HH1 and 2, a pair of much larger, more diffuse HH objects HH401/402 can be seen almost (2.6 pc) further from VLA1 at the same position angle (Ogura, 1995). Thus HH1 and 2 may actually be inner knots in a “parcsec-scale” outflow.
Single-dish HCO+ observations in the immediate vicinity of HH2 have shown an emission peak downwind of the optical knots, and it was suggested that this could be due to enhancement in the HCO+ abundance in the ambient gas (Davis et al., 1990; Dent 1997). Similar HCO+ peaks have been found in several other outflows (eg Rudolph & Welch, 1992). A common feature is that the emission lies close to ambient velocity, and the peak appears ahead of the HH shocks. It was proposed that these clumps are caused by UV photons from the HH shock inducing non-equilibrium chemistry in ambient material in either purely the gas phase (eg Wolfire & Königl, 1993), or after the release of icey grain mantles (eg Taylor & Williams, 1996; Viti & Williams, 1999). It is also possible for HCO+ in entrained shocked gas to be chemically enhanced by the shock itself (eg Taylor & Raga, 1995). Further imaging of HH1 and 2 showed compact clumps of NH3 in the vicinity (Torrelles et al., 1992), again thought to be due to changes in the molecular abundance. A more extensive survey of other species towards the HCO+ peak has shown abundances consistent with the effect of UV photons from the nearby HH shock (Girart et al., 2002).
The molecular outflow associated with HH1-2 is not prominent, but line wings have been detected in CO towards HH2, albeit at relatively low velocities (eg Correia et al., 1997; Dent, 1997). Maps of the line wing emission over the whole region show a bipolar outflow at certain velocity ranges, which appears to terminate near HH1 and HH2; it was suggested that the flow axis is inclined only 5-10 ∘from the plane of the sky (Moro-Martín et al., 1999).
In order to investigate the relationship between the ambient clump and high-velocity gas, we have mapped the region in the sub-mm continuum and J=3-2 CO line, and also obtained higher-resolution J=1-0 HCO+ images.
2 Observations
The continuum observations were made using SCUBA on the JCMT in June 1998. Imaging was carried out at 850 m using a standard 64-position fully-sampled jiggle map, and data were calibrated using Mars, resulting in a calibration accuracy of . A fully-sampled map of the J=3-2 12CO line was also obtained using the JCMT; additional J=3-2 spectra of the isotopomers 13CO and C18O were extracted from the JCMT Archive. These data were taken in 1994, using the receiver RxB3i and the DAS spectrometer with a spectral resolution of . The beamsize of the JCMT in both these continuum and spectral line observations was 14, and estimated pointing uncertainties were less than 2.
We conducted interferometric imaging of HCO+ J=1-0 line emission (rest frequency 89.18852 GHz) using the 6-element Nobeyama Millimeter Array (NMA) in 1999 March and May. The primary beam size (field of view) is 83 (fwhm) at 89 GHz. Observations were performed with the C and D configurations, and the resulting synthesized beam size was at P.A.. Since the minimum projected baseline length was 3.9 k, our observations were insensitive to structure extended by more than . The phase tracking center was set on the position of the peak of J=3-2 HCO+ (; 2000.0). We employed SIS receivers which had double sideband system noise temperatures of 200-300 K toward zenith. We used the high spectral resolution FX correlator for the HCO+ emission and the Ultra-Wideband Correlator for calibration using continuum emission. The FX correlator provides a velocity resolution of 0.1 km s-1 and total velocity coverage of 108 km s-1 at this frequency. We used 3C273 as the bandpass calibrator and 0528+134 as a phase and gain calibrator. By comparing with Uranus through 3C84 and 3C454.3, we estimated the flux density of 0528+134 to be 2.5Jy during both observing periods, with an estimated 10% uncertainty. Imaging was performed using the AIPS package to make clean maps. The typical resulting rms noise levels were 75 mJy beam-1 with a resolution of .
3 Results
3.1 Dust continuum
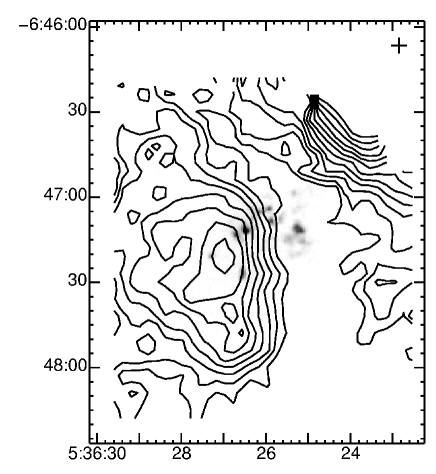
The emission from HH2 observed at 850 m is shown by the contour map in Figure 2. For comparison purposes, the shocked H2 image from Davis et al. (1994) is superimposed as a greyscale. These H2 knots lie towards the end of the Southeast lobe of the outflow; the flow origin (VLA 1) is situated some to the Northwest. An extended region of sub-mm continuum emission, of dimensions (0.130.09 pc, fwhm) is clearly seen downstream from most of the HH objects. The peak in sub-mm emission lies at (2000.0), and could be either due to a local maximum in the dust temperature or density. The J=4-3 HCO+ line observed with the same spatial resolution peaks to the south (Dent, 1997), and so the positions are consistent within the estimated errors. Girart et al. (2002) also found that the SO line reaches a peak at this position. Although there are at least 3 bright sub-mm continuum clumps within 2 arcmin of VLA 1 (Chini et al., 2001), most of these have evidence of an embedded young star. The dust clump near HH2 has no such known object, even though the extinction through the cloud is relatively low (see Girart et al., 2002). The close association with the optical, infrared and HCO+ emission suggests that the sub-mm continuum is tracing a cloud closely related to the HH objects. Furthermore Fig. 2 shows that at least two faint HH knots are apparently embedded within the sub-mm cloud; the significance of this will be discussed later. Also it is clear that the cloud has a much sharper edge facing VLA1, suggesting that the stellar jet has eroded away one side of the cloud.
The total integrated 850 m flux from the extended cloud associated with HH2 is estimated at 2.10.4 Jy (this is measured over a region of arcsec at centred on the peak). The peak flux is 0.200.04 Jy, consistent with an earlier single point photometric observation at 800 m (Dent, 1997). By comparison, the exciting star VLA 1 has a peak flux of 3.3 Jy (Chini et al., 2001). Both HH2 and VLA 1 show a compact central source superimposed on an extended low-level plateau; in both cases the latter may be heated by the ambient interstellar radiation field rather than the central source (see Chini et al., 2001).
Pravdo & Chester (1987) detected emission in the region of HH2 at 12 and 25 m using IRAS, which they tentatively ascribed to the HH object. However, their maps indicated the mid-infrared peak may be west of HH2; this is supported by more recent ISO data (Cernicharo et al., 1999), suggesting the mid-infrared continuum is concident with the Hα rim noted by Reipurth et al. (1993) to lie 50 west of HH2. However, far-infrared ISO results did show continuum emission from the region of HH2 itself (Molinari & Noriega-Crespo, 2002); the estimated contamination from the bright source VLA 1 was 10%. Figure 3 shows the integrated continuum fluxes. A grey body fit to the long-wavelength data gives a temperature of 222 K and dust opacity index, =1.50.2; this would imply a total cloud luminosity of 13. The mid-IR points are consistent with T=220K, but these are ignored in this and subsequent analysis for reasons given above. Furthermore the temperature of this component is sufficiently high that emission is unlikely to significantly affect the far-infrared fluxes and hence the fit (see Fig. 3). However, further high-resolution imaging in both the far and mid-infrared is required to confirm this result.

The NH3 observations of Torrelles et al. (1992) indicated kinetic temperatures in the region of the HH2 clump of 20K. Girart et al. (2002) derive CO excitation temperatures of 13K. The peak brightness temperature in 13CO and 12CO is 10K (see below), which is a lower limit to the kinetic temperature assuming the line to be optically thick and in LTE.
If we adopt a temperature of 22K, the total mass of the HH2 cloud is 3.8, assuming a gas:dust ratio of 100, and an 850 m dust mass opacity of (eg Henning et al., 1995). This gives a mean gas column density of and mean space density of (assuming a symmetrical cloud). Note that the errors on these derived parameters may be larger - perhaps up to a factor of 2 - because of the uncertainty in the mm-wavelength dust emissivity (eg Henning et al.).
The contours in Figure 2 show a clear emission peak near HH2; assuming the temperature and dust opacity here is the same as that of the whole cloud, then the luminosity of this component is estimated as . Its mass is , peak column density and peak space density is . These densities are very similar to those found from recent observations of several molecular species towards HH2 (Girart et al., 2002), although the derived temperature is somewhat higher. This general agreement confirms that the dust and molecular gas lie in the same warm clump, and also suggests that the sub-mm dust emission characteristics are not significantly affected by the nearby shock.
3.2 Single-dish CO
The outflow axis from VLA1 lies close to the plane of the sky, resulting in relatively faint CO line wings. Nevertheless a collimated molecular outflow has been observed close to VLA1 (Correia et al., 1997; Choi & Zhou, 1997), and fainter red-shifted CO extends as far as HH2 (Moro-Martín et al., 1999). In an attempt to understand this termination region, we observed HH2 itself using the J=3-2 transition of CO and its isotopomers; the higher energy level of this transition compared with earlier observations means it is more sensitive to the warmer gas. Figure 4 compares spectra at the location of the continuum dust peak. The C18O line can be fit by a single Gaussian component at , close to that of the HCO+ (7.0; Davis et al., 1990), CI (Dent, 1997), and other species such as SO (Girart et al., 2002). This velocity is significantly different from the gas around VLA1, which has a radial velocity of 10.5 (Choi & Zhou 1997).
The ratio of peak brightness temperature of 13CO to C18O is 5 which, assuming a similar emitting area and LTE conditions, indicates that the C18O line is optically thin. The integrated C18O intensity is ; with an excitation temperature of 22K (see above) and a C18O abundance of , this gives a total gas column density of . This is consistent with the value estimated above from the sub-mm dust emission.
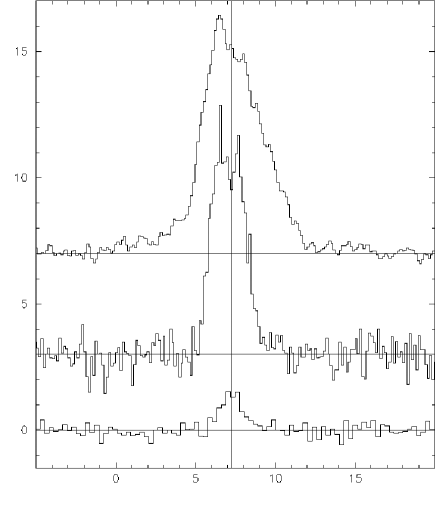
The 12CO line in Figure 4 shows distinct high-velocity wings at relative velocities . The spatial distribution of this high-velocity gas in the vicinity of HH2 is illustrated in Figure 5; both the red and blue-shifted emission peak within 10 of the brightest H2 knot HH2E. A second component of blue-shifted gas lies south of HH2L. It was shown by Moro-Martín et al. that red-shifted CO around HH1-2 traces a large collimated flow centred on VLA1; high-resolution observations of blue-shifted HCO+ (to be described below) show that it too lies in a collimated jet pointing back towards VLA1. It is thought unlikely that the dust clump in Fig. 2 harbours a young outflow source, as the low extinction through the cloud would render it detectable in the infrared. So the abrupt termination of the outflow near HH2E (Fig. 5), suggests this is the dominant interaction region of the jet and ambient clump. However the spatial resolution of these single-dish data is insufficient to compare accurately with the infrared image.
3.3 Interferometric HCO+
The HCO+ J=1-0 emission from the vicinity of HH2 is bright and complex, but the spectra have two distinct velocity components. Firstly, bright and relatively narrow ambient-velocity emission with a profile similar to that of 13CO; this is illustrated in Figure 6a which shows the line towards the continuum peak. Secondly a high-velocity wing component, with a full width of 20 (to the noise level). This dominates in the region of HH2E (see Figure 6b).

Both HCO+ spectra show an absorption dip at , similar to the velocity of the molecular gas near VLA 1 and in much of the Orion region (Davis et al., 1990; Choi & Zhou, 1997). It is likely that a cool region of this cloud along the line of sight is absorbing the emission from HH2. However, a second dip in the HCO+ spectrum at is likely to be cool foreground gas associated with the HH2 clump itself, as seen in the CO spectra in Fig. 4.
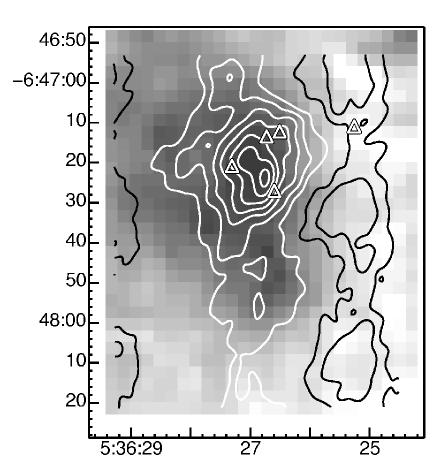
The map of ambient velocity HCO+ (Figure 7) shows a main peak of size (fwhm), consistent with the lower-resolution observations of Davis et al. (1990). Fig. 7 compares the data with the sub-mm continuum emission and the locations of some of the prominent HH knots (c.f. Fig. 1). The gas and dust distributions are similar but not identical; notably the HCO+ shows two compact peaks within (0.01pc) of HH2L and Knot 8, whereas the dust is seen in a broader North-South ridge extending over . It is possible that some of the large-scale HCO+ emission () has been resolved out by the lack of short-baseline data from the interferometer. Additional instrumental effects due to incomplete UV coverage can be seen as negative contours in Figure 7, although these are at a relatively low level compared with the peak intensity. The map may also be affected by the self-absorption near the line centre, although this is relatively narrow compared with the main emission profile. Despite these potential difficulties, it does appear that the ambient-velocity HCO+ emission closely traces the dust continuum; however, it appears relatively brighter within 0.01pc of the HH shocks HH2L and Knot 8. This enhancement will be discussed further in Section 4.1.
3.4 High-velocity HCO+
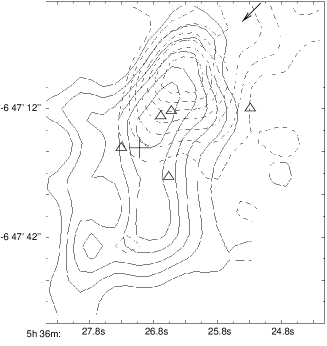
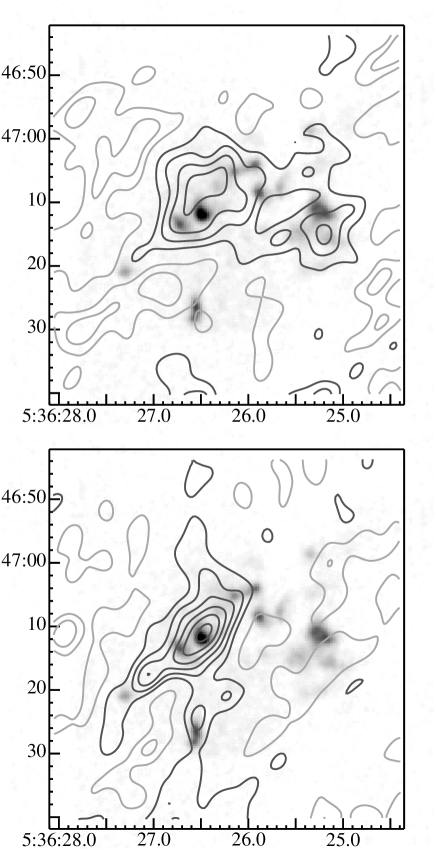
Maps of the integrated high-velocity HCO+ emission are shown in Figure 8, with the near-infrared H2 image (Davis et al., 1994) superimposed. The distribution of high-velocity gas appears similar to that of CO shown above, after accounting for the differing resolution and relative insensitivity of the interferometric observations to the large scale structure (). High-velocity red and blue-shifted HCO+ is found within 5 of the HH objects HH2K, E, F and also Knot 8. Notably, these knots are relatively bright in shocked H2 compared with optical lines such as Hα, whereas HH2A and HH2H, which dominate optical images, are relatively faint in H2 (eg Noriego-Crespo & Garnavich, 1994). Multi-level line analysis shows that they also have lower excitation temperatures (Eislöffel et al., 2000). There is weak evidence of high-velocity red-shifted gas near the western HH clump HH2A.
The images of high-velocity HCO+ (particularly the blue-shifted gas) show that the northern section of HH2, rather than being a jumble of shocks, actually forms a rather coherent well-collimated jet. This includes HH2K, E, and F, terminating in Knot 8 (and thus confirming that the latter object, which is only detected in H2, is part of the flow). The Position Angle of this jet measured from VLA1 is 139∘ - significantly different from the of the optical peak HH2A measured from VLA1 (150∘). By comparison, the apex of the large-scale outer bow shock HH402 lies at (Ogura et al., 1995). Assuming a constant flow direction, these results suggest that the dominant outflow position angle is 138∘. This is further confirmed by the fact that the sub-mm continuum peaks at from VLA1; if we assume it is heated by the jet, this traces where most of the outflow energy is being deposited.
Giarart et al. (1999) suggested that HCO+ may be used to identify shocked gas in sections of outflows that are no longer visible in optical or infrared lines. Note that the cooling times associated with the optical/IR lines are very short - of the order of a few years - so these emission lines can rapidly fade. The HCO+ lines, on the other hand, emit from molecular material that is already relatively cool, where steady depletion via dissociative recombination with electrons may take years (Nejad & Wagenblast 1999), although this is dependent on the electron abundance. Indeed, the apparent HCO+ abundance enhancement evident in our data may be limited by the lifetime of the clump in HH2 which, if we assume is destroyed by the passage of the shock front, will be of the order of a few thousand years.
4 Discussion
4.1 The ambient clump
Although the sub-mm results show an extended cloud downwind of the bright optical HH objects, the central sub-mm peak coincides with a number of low-excitation HH knots. The cloud has no evidence of an internal young star, so how is the dust heated? Either it could be through the interstellar radiation field in the young cluster, by UV radiation from optically-bright knots such as HH2A, or by shock heating. The fact that the submm continuum peaks so close to HH2 suggests the heating - at least of this central peak - is local, rather than from the external interstellar radiation field. One possible local energy source is UV from the HH shocks, as used to explain the HCO+ overabundance in the clump (eg Wolfire & Königl, 1993; Taylor & Williams, 1996; Viti & Williams, 1999). Böhm-Vitense et al. (1982) found the dominant UV source in HH2 lies within of the optically bright high-excitation knots HH2H and A. Thus the main UV source is Northwest of the sub-mm peak, and the fraction of UV radiation intercepted by the dust clump would be %. The total de-reddened UV luminosity of HH2A, estimated from Fig. 2 of Böhm-Vitense et al. is , which would result in an intercepted luminosity at the sub-mm peak of , considerably less than that observed (). Clearly the UV flux from HH2H/A is inadequate to heat the dust peak.
Alternatively the clump may be warmed by local shocks from the outflow jet. Moro-Martín et al. give the total outflowing mass from VLA1 as 0.2; with a mean flow velocity of (deprojected assuming an inclination of 10∘) and age of , this results in a total flow mechanical luminosity of . This is adequate to explain the local heating of the sub-mm peak, although not of the whole cloud shown in Fig. 2.
Both the sub-mm continuum and the ambient-velocity HCO+ reach a maximum within (0.01 pc) of HH2L and Knot 8. To estimate the HCO+ enhancement in this region, we can compare the molecular abundance with a potentially more “benign” region of the cloud to the South. Data are smoothed to the same spatial resolution ( fwhm), and we make an initial assumption of an excitation temperature of 22K (see above), LTE conditions and optically thin emission. Towards the dust peak and southern region, the HCO+ column densities () are and respectively. This compares with estimates derived from the dust of and , giving abundances, of and . Girart et al. (2002) used multi-transition modelling to show that the HCO+ excitation temperature may be somewhat less than 22K, possibly because the mean cloud density is less than the critical density of . Furthermore they suggest the line may be optically thick towards the bright peak, which is supported by the self-absorbed profile in Fig. 6a. But if we assume similar conditions apply in the two regions, it indicates in the ambient gas is a factor of 2.5 higher within 0.01 pc of HH2L, compared with that 0.05 pc to the South. Furthermore, the abundance in the Southern region is similar to that in many other quiescent molecular clouds (eg Nejad & Wagenblast, 1999).
4.2 High-velocity molecular gas
High-velocity HCO+ and CO emission is closely associated with a line of H2 knots terminating at Knot 8 (Fig. 8). This suggests a single coherent jet impacting the dust clump, rather than a broad wind with multiple shocks as might be suggested by the complex optical images. A similar spatial association of high-velocity HCO+ with H2 peaks was found in NGC2071 (Girart et al., 1999) and DR21 (Garden & Carlstrom, 1992), and it was proposed that the HCO+ enhancement is due to ion-chemistry reactions in the low-velocity C-shocks.
After accounting for the differing resolution of the data, there appears to be no significant difference in the spatial distribution of high-velocity CO and HCO+. However, there is a clear difference in the line brightness ratio as a function of velocity, illustrated in Figure 9. We find this ratio changes from 0.1 at the lowest relative velocities likely to be uncontaminated by ambient emission (), up to 2-3 at the highest velocities (). Here we use , where , the systemic clump velocity, is taken to be . Note that the inclination of the HH1-2 flow is only to the plane of the sky (eg Moro-Martín et al., 1999), so the absolute velocities may be considerably higher. However, the near coincidence of red and blue-shifted gas (Fig. 8) suggests that random turbulent or tranverse velocities in the entrained gas dominate the measured velocity. As the line wings of both species are thought to be optically thin, Fig. 9 suggests a factor of 30 variation in the relative abundance. However, there are other possible explanations: Girart et al. (1999) observed a similar factor of 10 variation in the HCO+ to 12CO J=2-1 ratio across the NGC2071 outflow spectra. They discussed several possible explanations, for example changing excitation conditions, but concluded that an increase in HCO+ abundance was the most likely cause.
If we assume a constant excitation temperature of 30K and the gas is in LTE, then the results indicate varies from up to at the extreme velocities. This assumes the canonical value for applies throughout the gas. It represents a factor of up to increase in the abundance compared with the ambient gas in the HH2 dust clump (see previous section). If the excitation temperature is 100K, this enhancement may be as high as . The optical extinction through dust mixed with the high-velocity gas is likely to be negligible, so external UV irradiation cannot easily explain the velocity-dependence of the HCO+ enhancement. However, Taylor & Raga (1995) predicted HCO+ abundances of up to in turbulent mixing layers associated with relatively low-velocity () shocks. This could explain both these enhancements, as well as the close association of the high-velocity regions with the low-excitation, H2-dominant knots.

The brightness ratio in Fig. 9 shows a monotonic increase with velocity, consistent with . HCO+ line wings in several outflows are found to have a relatively constant or even increasing brightness temperature out to the highest velocities (eg HH7-11 - Lizano et al., 1988; L1551 - Rudolph, 1992; NGC2071 - Girart et al., 1999; OH231.8 - Sánchez-Contreras et al, 2000). By contrast, the intensity of CO line wings are generally found to decrease with (eg Richer et al., 2000), suggesting that the dependence of may be a common feature of shocked and entrained gas in such outflows. As depletion of HCO+ occurs on a timescale significantly longer than the age of the flow, then the velocity-dependent abundance suggests either that: (1) a range of shock velocities exists, with the HCO+ enhancement depending on the shock kinetic energy, or (2) HCO+ is formed at the higher shock velocities, and this gas gradually mixes with ambient un-enhanced material. The latter might take place in a steady-state turbulent boundary layer (eg Taylor & Raga, 1995). We can use the results to estimate , the mixing fraction in the turbulent boundary, ie the ratio of masses of initially shocked gas, , to ambient gas, , in this turbulent boundary. The HCO+ results above indicate that is approximately constant, whereas CO data show approximately that . This would imply , where is the maximum HCO+ velocity. Further modelling of such low-velocity turbulent layers would be of interest.
4.3 HCO+ enhancement and shocks in the clump
The relatively modest enhancement of the HCO+ abundance towards the ambient velocity HH2 clump has been ascribed to a radiative precursor from the optically-bright HH knots HH2A/H (eg Wolfire & Königl, 1993; Raga & Williams, 2000). However, the current results (Fig. 7) do not show the limb-brightened morphology in HCO+ predicted by Raga & Williams, even though the flow axis lies close to the plane of the sky. Instead the results suggest a closer association with the low-excitation shocks, found by H2 and high-velocity HCO+ within 0.01pc of the clump. Luminosity arguments suggest the dust clump is heated by the flow itself. Furthermore, the dust morphology indicates that one side of the clump has been truncated by the flow impact (Fig. 2). Clearly, then, at least some parts of the clump have been dynamically affected by the outflow. It is perhaps worth noting that low-velocity HCO+ clumps in the outflow from NGC2264G are also closely associated with low-energy H2 shocks and accelerated gas (Girart et al., 2000). So could the enhancement of HCO+ at velocities close to ambient be due to low-velocity shocks within the dust clump, in a similar mechanism as evoked to explain the high-velocity enhancement?
The HCO+ linewidth in the HH2 clump is similar to that of the bright cores associated with VLA1 and VLA3 (eg Choi & Zhou, 1997), even though the mass is 10-100 times lower. We can estimate the ratio in the HH2 and VLA1 clumps, where and are the kinetic energy (assumed due to turbulence) and the gravitational potential energy. Using the masses and core sizes from section 3.1 above, and from Choi & Zhou, we find ratios of and 0.6 for HH2 and VLA1, showing that, unlike VLA1, the clump near HH2 is clearly not gravitationally bound. One possible mechanism for the line broadening is disruption by the HH2 jet. In which case the bright ambient-velocity HCO+ could also be caused by enhanced abundance in the lowest velocities of the turbulent mixing layer. Extrapolating the enhancement seen in the high-velocity gas down to we would predict abundances a factor of above normal, similar to that observed.
5 Conclusions
A sub-mm continuum clump is found at the end of the molecular outflow and 0.05pc downwind of the optically-bright knots in HH2. Warming of the dust appears to be caused by the impact of the jet, and the derived luminosity of the central peak () is similar to that of the outflow mechanical luminosity.
The emission from HCO+ can be divided into an ambient velocity component, approximately correlated with the dust emission, and a high-velocity component, closely associated with the H2 knots. The high-velocity HCO+ appears to form a single coherent flow linking the lower-excitation HH knots; this is North of the optically-bright regions, and we suggest it represents the main collimated jet from VLA1. In the highest velocity line wings, HCO+ is enhanced by a factor of up to , compared with a factor of a few in the ambient-velocity gas. The enhancement is found to increase as .
Enhancement of ambient-velocity HCO+ abundance is most prominent within 0.01 pc of the low-excitation shocks at the tip of the outflow jet. It is suggested that enhancement in this gas could be caused by the same shock mechanism and turbulent mixing as used to explain the high-velocity HCO+. Thus a UV precursor may therefore not be necessary.
Acknowledgments
The James Clerk Maxwell Telescope is operated by the Joint Astronomy Centre on behalf of the United Kingdom Particle Physics and Astronomy Research Council, the Netherlands Organisation for Scientific Research, and the National Research Council of Canada. The Nobeyama Radio Observatory is a branch of the National Astronomical Observatory, operated by the Ministry of Education, Culture, Sports, Science and Technology, Japan. The authors thank S. Sakamoto for the support of our NMA observations, and the referee for helpful comments.
6 References
Böhm-Vitense, E., Böhm, K.H., Cardelli, J.A., Nemec, J.M., 1982, ApJ, 262, 224
Cernicharo, J., Cesarsky, D., Noriego-Crespo, A., Lefloch, B., Moro-Martín, A., 1999, in “H2 in Space”, ed., F. Combes, & G. Pineau des Forêts, (Cambridge Univ. Press), 23
Chini, R., Ward-Thompson, D., Kirk, J.M., Nielbock, M., Reipurth, B., Sievers, A., 2001, A&A, 369, 155
Choi, M. & Zhou, S., 1997, ApJ, 477, 754
Correia, J.C., Griffin, M., Saraceno, P., 1997, A&A, 322, L25
Davis, C.J. & Eislöffel, J., Ray, T.P., 1994, ApJ, 426, L93
Davis, C.J., Dent, W.R.F., Bell Burnell, S.J., 1990, MNRAS, 224, 173
Dent, W.R.F., 1997, in Malbet F., Castets A., eds., Poster Proc. IAU Symp. 182, Herbig Haro Objects and the Birth of Low Mass Stars, p. 88
Eislöffel, J., Smith, M.., Davis, C.J., 2000, A&A, 359, 1147
Garden R.P., Carlstrom, J.E., 1992, ApJ, 392, 602
Girart, J.M., Ho, P.T.P., Rudolph, A.L., Estalella, R., Wilner, D.J., Chernin, L.M., 1999, ApJ, 522, 921
Girart, J.M., Estalella, R., Ho, P.T.P., Rudolph, A.L., 2000, ApJ, 539, 763
Girart, J.M., Viti, S., Williams, D.A., Estalella, R., Ho, P.T.P, 2002, A&A, 388, 1004
Henning, Th., Michel, B., Stognienko, R., 1995, P & SS, 43, 1333
Herbig G., Jones, B.F., 1981 AJ, 86, 1232
Hester, J.J., Stapelfeldt, K.R., Scowen, P.A., 1998, AJ, 116, 372
Lizano, S., Heiles, C., Rodríguez, L.F., Koo, C.-C., Shu, F.H., Hasegawa, T., Hayashi, S., Mirabel, I.F., 1988, ApJ, 328, 763
Molinari, S. & Noriego-Crespo, A., 2002, AJ, 123, 2010
Moro-Martín, A., Cernicharo, J., Noriego-Crespo, A., Martín-Pintado, J., 1999, ApJ, 520, L111
Noriego-Crespo, A., Garnavich, P.M., 1994, AJ, 108, 1432
Nejad, L.A.M., Wagenblast, R., 1999, A&A, 350, 204
Ogura, K., 1995, ApJ, 450, L23
Pravdo, S.H., Rodriguéz, L.F., Curiel, S., Canto, J., Torrelles, J.M., Becker, R.H., Sellgren, K., 1985, ApJ, 293, L35
Pravdo, S.H., Chester, T.J., 1987, ApJ, 314, 307
Raga, A.C., Williams, D.A., 2000, A&A, 358, 701
Reipurth, B., Heathcote, S., Roth, M., Noriega-Crespo, A., Raga, A.C., 1993, ApJ, 408, L49
Richer, J.S., Shepherd, D.S., Cabrit, S., Bachiller, R., Churchwell, E., 2000, Protostars and Planets IV, eds. Mannings, V., Boss, A.P., Russell, S. S., 867, Univ. of Arizona Press
Rudolph, A., 1992, ApJ, 397, L111
Rudolph, A., & Welch, W.J., 1992, ApJ, 395, 488
Sánchez-Contreras, C., Bujarrabal, V., Neri, R., Alcolea, J., 2000, A&A, 357, 651
Taylor, S.D., Raga, A.C., 1995, A&A, 296, 823
Taylor, S.D., Williams, D.A., 1996, MNRAS, 282, 1343
Torrelles, J.M., Rodríguez, L.F., Cantó, J., Anglada, G., Gómez, J.F., Curiel, S., Ho, P.T.P., 1992, ApJ, 396, L95
Viti, S., Williams, D.A., 1999, MNRAS, 310, 517
Wolfire M.G., Königl, A., 1993, ApJ, 415, 204