Discs in early-type lensing galaxies: effects on magnification ratios and measurements of
Abstract
Observations of early-type galaxies, both in the local universe and in clusters at medium redshifts, suggest that these galaxies often contain discs or disc-like structures. Using the results of Kelson et al. (2000) for the incidence of disc-components among the galaxies in the redshift cluster CL 1358+62, we investigate the effect of disc structures on the lensing properties of early-type galaxies. Statistical properties, like magnification cross sections and the expected number of quad (four-image) lens systems, are not affected greatly by the inclusion of discs that contain less than 10 per cent of the total stellar mass. However, the properties of individual lens systems are affected. We estimate that per cent of all quad lens systems, with early-type deflector galaxies, would be affected measurably by the presence of disc components. Intriguingly, the image magnification ratios are altered significantly. The amplitude of the predicted change is sufficient to explain the observed magnification ratios in systems like B1422+231 without requiring compact substructure. Furthermore, time delays between images also change; fitting a bulge-only model to early-type lenses that in fact contain a disc would yield a value of the Hubble constant that is systematically too low by per cent.
keywords:
gravitational lensing – galaxies: elliptical and lenticular – galaxies: formation – cosmology: dark matter – cosmology: distance scale – method: numerical1 Introduction
In current models of hierarchical galaxy formation the morphological type of a galaxy is determined to a large extent by its merger history (Abraham & van den Bergh 2001): late-type galaxies have not undergone a recent massive merger, so that stable, prominent discs formed, whereas early-type galaxies have been prevented from forming a prominent disc by a major merger that either consumes all the available gas for star formation, or redistributes angular momentum via large scale winds (Somerville & Primack 1999). This behaviour has also been recovered in hydrodynamical simulations of galaxy formation (Steinmetz & Müller 1995). So far, there is no evidence for any evolution in the luminosity and size of discs in late-type galaxies up to redshifts of about 1 (Simard et al. 1999; Ferguson & Clarke 2001). This suggests that if mergers occur after that time, they are either not massive enough to significantly affect the disc structures or they destroy visible disc structures, producing elliptical systems. It is not known on what time scales disc structures form. Simulations and some observations suggest that disc structures form slowly between redshifts 0.1 and 1 (Mo, Mao & White 1998) but there is also evidence that some large discs are already present at higher redshifts (van Dokkum & Stanford 2001). Most likely, discs in early-type galaxies are the result of remaining gas settling after major merging events between two late-type galaxies (Naab & Burkert 2001). Another possible formation scenario for discs involves slow accretion from many minor merging events. Debris from minor mergers, or high velocity clouds in the halo of the galaxy, could rain down onto the disc (Benjamin & Danly 1997; Putman et al. 2002). However, such a scenario would lead to thicker, less pronounced disc structures. Since late-type galaxies exhibit clear disc structures, this process is unlikely to be very important in the formation of typical spiral structures.
In all these scenarios, the obvious question arises as to whether disc structures are exclusively found in late-type galaxies. Observationally, that is clearly not the case. S0 galaxies in the local universe possess disc components, and even local ellipticals show evidence of disc structures and dust lanes when studied in detail (Rest et al. 2001; Tran et al. 2001). The isophotes of ellipticals are usually classified into “boxy” and “discy”, types. Pointed, discy isophotes may well be caused by the presence of discs. Even in the case when the isophotes are nearly round and show no sign of “discyness”, kinematic studies suggest that it is still possible to hide a disc in such galaxies (Romanowsky & Kochanek 1997).
There is also some observational evidence for discs in ellipticals at cosmological redshifts; Kelson et al. (2000) found that many early-type galaxies in CL 1358+62 at possess evidence for the presence of exponential discs, suggesting discs are present in a large fraction of early-type galaxies, at least in clusters. Since there is no clear understanding yet on how these discs form, and no systematic observational investigation into the abundance and properties of discs in early-type field galaxies has been carried out, it is difficult to make precise statements about the abundance of discs in field ellipticals. However, some recent observations using the Hubble Space Telescope (HST) show that a fraction of at least per cent of field ellipticals contain discs of sizes spanning a range of at least an order of magnitude, from small nuclear discs to large discs extending beyond the bulge (Rest et al. 2001). In addition, kinematic studies using the SAURON integral field spectrograph, also suggest that a high fraction of per cent of field ellipticals contain discs of various sizes (de Zeeuw et al. 2002).
Most lens galaxies known to date are early-type galaxies. The main reason for this is that early-type galaxies tend to be the most massive and hence have a larger cross section for gravitational lensing. However, as shown by Blain, Möller & Maller (1999) spiral galaxy lenses are also predicted to contribute significantly to the total lensing cross section. This is mainly due to the high surface mass density of the thin disc component when viewed edge on (Maller, Flores & Primack, 1997; Möller & Blain, 1998). As shown in those papers, the disc components of late-type lenses can make important contributions to the lensing potential and change the generic properties of the lens systems. The discovery of spiral lens systems in the CLASS lensing survey, e.g. B1600+434 (Koopmans, de Bruyn & Jackson 1998), confirm that this is the case. However, early-type lensing galaxies have so far nearly always been modelled with a simple one-component model, possibly including external shear (Keeton, Kochanek & Seljak, 1997; Lehár et al., 2000).
In this paper we determine the lensing properties of early-type galaxies that contain realistic discs with stellar masses of up to per cent of that of the bulge. We will determine the lensing properties of early-type lenses and show how discs in ellipticals could explain some properties of observed lens systems that have not yet been modelled successfully. We concentrate on three main questions:
-
1.
statistical lensing properties: how do disc structures in early-type lensing galaxies affect the statistical properties of a sample of early-type lenses? We calculate magnification cross sections and the expected ratio of quad: two-image systems. In particular, we investigate whether discs in early-type lenses may explain the high ratio of quad image systems, which is still an unsolved enigma in gravitational lensing (Rusin & Tegmark, 2001, but see Chae, 2002).
-
2.
magnification ratios: can disc structures explain some or all of the unusual magnification ratios observed in some early-type lens systems? To date, these deviant magnification ratios have been interpreted as providing strong evidence in favour of the presence of compact halo substructure as predicted by current cold dark matter (CDM) simulations (e.g. Metcalf & Madau 2001).
-
3.
time delays: how would disc structures affect the measured time delays in early-type lens systems? Currently there seems to be a strong disagreement between the value of as found in the HST Key Project (Freedman et al. 2001) and measurements of from gravitational lensing (Kochanek 2003). Some local estimates of (e.g.Saha et al 2001) also favour lower values. We investigate whether disc structures in gravitational lens systems may reduce this discrepancy.
We start in §2 by discussing the appearance of the model lens galaxies and show that the manifestations of the presence of a disc are similar to those observed in some ellipticals. In §3 we present the parametric lens models used in this paper. In §4 we describe some general and statistical lensing properties of early-type galaxies that include disc structures. In §5 we show how discs in ellipticals could explain some of the observed magnification ratios and in §6 we calculate how the presence of discs in ellipticals would affect estimates of from lensing. We conclude with a summary in §7.
Throughout this paper we assume a Friedmann-Robertson-Walker Universe with , and . The choice for this value of is motivated due to limitations of the original lensing code. Subsequently, the code has been extended to allow for any value of , as necessary for the calculations in §6, but we did not recalculate the results of §3-5, as these calculations are very time-consuming and a change in has little effect on the results. A value of , is probably more in line with current observational constraints, as given for example by the HST Key Project (Freedman et al. 2001) and the WMAP results (Bennett et al. 2003).
2 Surface Brightness Profiles
The existence of disc components with large scale-lengths in luminous elliptical galaxies has been known for some time (Bender et al. 1989; Rix & White 1990; Rix 1991). Recent theoretical work (Naab & Burkert 2001; Barnes 2002) has begun to address the origin of such components in bulge-dominated galaxies. However, the ability to reliably determine the prevalence of discs in strongly bulge-dominated systems has only been possible following the development of full two-dimensional decomposition techniques (Byun & Freeman 1995). Given data of adequate signal-to-noise ratio and angular resolution, two-dimensional decomposition methods are capable of identifying discs in systems with bulge fractions (B/T) as high as B/T=0.95. A significant quantity of HST imaging, obtained using the Wide Field Planetary Camera 2 (WFPC2), of luminous bulge-dominated galaxies in intermediate redshift clusters is well-suited to such decompositions but little work appears to have been undertaken. Exceptions are the investigations of the cluster CL1358+62 by Kelson et al. (2000) and Tran et al. (2003). Fig. 4 of Kelson et al. provides a particularly striking demonstration of the presence of discs, even among galaxies with conventional ‘E’ morphological classifications.
In order to parameterize the light profile of ellipticals, a commonly used set of parameters are the half-light radius and the surface brightness at the half light radius . The surface brightness of a de-Vaucouleurs bulge can then be written as (Binney & Tremaine 1987),
| (1) |
The parameterization of the surface brightness distribution for an exponential disc, in terms of the central surface brightness, , and scale–length, , can be written
| (2) |
The bulge fraction, B/T, for a galaxy parameterized by such bulge and disc components is then
| (3) |
where and , and are as defined above.
Table 2 in Kelson et al. gives surface brightnesses and half-light-radii for bulge-only and bulge-plus-disc fits to galaxies in CL1358+62. Note that Kelson et al. specify the properties of the disc component in terms of half-light radius of the disc, , and the mean surface brightness within the half-light radius, . Using this parameterization the B/T ratio may be calculated by replacing the term by .
For the investigation of the general and statistical lensing properties of discy ellipticals, we use the full sample of galaxy models in Kelson’s catalogue. However, our main results, as presented in § 5 and § 6 involve time-consuming calculations and are therefore based on the parameters describing a single model galaxy. The presence of many galaxies with bulge and disc components with comparable scalelengths in CL1358+62 is clear from the form of the residuals shown in Figure 4 of Kelson et al. It is worth stressing that the presence of even highly inclined (almost edge-on) discs, with scale-lengths similar to those identified by Kelson et al., making up less than per cent of the total light are hard to discern directly in images. Plots showing the residuals obtained by fitting a bulge-only model are, however, far more revealing. The presence of face-on discs is revealed by characteristic donut-like residuals, while edge-on discs appear as often quite prominent inclined structures. Notwithstanding the evidence provided by Kelson et al. in support of the accuracy of their bulge-disc compositions we have chosen to be conservative by reducing the disc contribution to each galaxy in the Kelson et al. catalogue by half. Thus, our investigation of the statistical lensing properties is based on the properties of the galaxies listed in Table 2 of Kelson et al. but with a reduction in the disc contribution of a factor 2. For the individual model galaxy used in our calculations we have chosen galaxy no. 242 (Table 1). Adopting our rescaling of the disc contribution, galaxy no. 242 has B/T=0.95, c.f., B/T=0.91 in Kelson et al. Galaxy no. 242 has a total mass, B/T ratio and bulge scale-length close to the average value for the ‘E’ galaxies in Kelson et al’s catalogue. In our simulations the ellipticity of the bulge is set to and the inclination of the disc is .
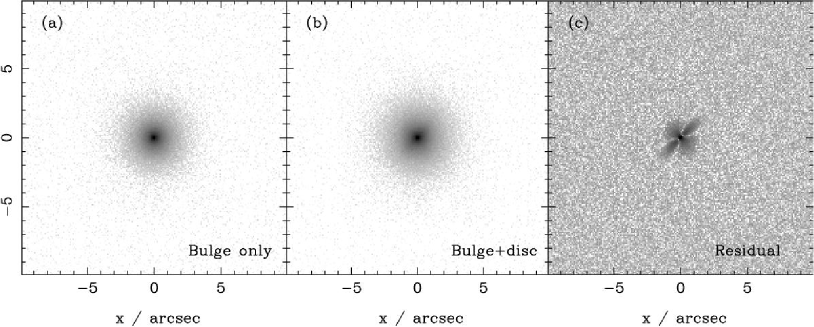
Fig. 1 shows images based on our adopted parameterization of galaxy no. 242 with B/T=0.95. Fig. 1a is an image based on the bulge-only model surface-brightness profile fit (parameters from Cols: 3 & 4 in Table 1), Fig. 1b shows a realization of the bulge-plus-disc surface-brightness profile (parameters from Cols: 7 & 8 (bulge) and Cols: 10 & 11 (disc) in Table 1). The disc is at high inclination, to the line of sight ( corresponding to edge-on) and oriented at an angle of with respect to the x-axis. The presence of the disc is barely discernible. Fig. 1c shows the residual image derived from subtracting Fig. 1a from Fig. 1b (both normalized to possess the same total counts). The images may be compared to those in Figs 1 and 4 of Kelson et al.. In Kelson et al., galaxy no. 242 shows the donut-like residual characteristic of the presence of a close to face-on disc. By contrast, in Fig. 1c, the disc appears prominently because of the high inclination angle of to the line-of-sight.
Following submission of the original version of this paper an analysis of the photometric properties of galaxies in CL 1358+62 undertaken by Tran et al. (2003) appeared. Comparison of both the B/T values and the scale-lengths of the light distributions for the bulge-dominated galaxies in common between Kelson et al. and Tran et al. show a good correlation over the full range of B/T. However, for large values of B/T the contribution of the disc components are much larger in the Tran et al. analysis. Less satisfactory still is the comparison between the scale-lengths of the disc components found among the bulge-dominated galaxies. The disc scale-lengths found by Tran et al. are significantly larger, explaining, at least in part, the systematically smaller B/T ratios found for the bulge-dominated systems. Tran et al. present the results of a large number of Monte-Carlo simulations designed to quantify the accuracy of the decompositions into bulge and disc components. No reference is made to the strong systematic disagreement between the statistics of the disc scale-lengths found in the two studies. Tran et al. are confident that their simulations demonstrate the ability of the software employed to obtain accurate bulge-disc decompositions. However, the parameter ranges employed in the simulations appear to be determined from the results of the actual decompositions applied to the real data. Tran et al. find no discs with scale-lengths comparable to or smaller than those of the bulge components of the galaxies. Thus, it is not clear that the ability of Tran et al.’s analysis to correctly parameterize combinations of bulge and disc profiles with parameters found by Kelson et al. has been adequately tested. In the circumstances we have decided to retain the very conservative distribution of B/T ratios, with associated values of component scale-lengths, based on the distribution advocated by Kelson et al.
3 The lens models
In order to study the lensing properties of early-type galaxies including discs, a working model of the mass distribution is needed. Unfortunately, little is known about the detailed properties of early-type galaxy discs and how they depend on morphology and environment. From past studies it is clear that discs in ellipticals are abundant and that the disc sizes and magnitudes cover the whole range from compact and luminous to extended and faint (Rest et al. 2001; Scorza & Bender 1995; Scorza et al. 1998). Most of the available information is based on observations of individual galaxies; there has not yet been a systematic high-resolution study of the morphologies of a complete, unbiased sample of early-type galaxies. In order to make meaningful predictions about the lensing properties of early-type lensing galaxies including disc components, we base our models on the light profiles obtained in Kelson et al. (2000). All galaxies in Kelson’s sample are at a redshift of , which corresponds roughly to the redshift at which lensing is most efficient; few lenses are expected with redshifts less than .
3.1 Parameterization of early-type lenses with discs
We model the elliptical lensing galaxies with two-components: an elliptical bulge with a de-Vaucouleurs profile and an exponential thin disc.
Under the usual assumption of a thin lens, the lensing properties depend solely on the surface mass density profile. For the bulge component this is given by
| (4) |
where is the central surface mass density of the bulge, is the bulge scale-length, and
| (5) |
Here , and is the ellipticity of the bulge. The disc, inclined at an angle to the line of sight, can be parameterized in a similar way, to give
| (6) |
where is the central surface mass density of the disc, is the scale-length of the disc and
| (7) |
We convert the light profiles as given in equations (1) & (2) to models of the mass distribution assuming a constant mass-to-light ratio, . The relation between the parameters in equations (1) & (2) and those in equations (4) & (6), is then and for the bulge component and for the disc component. We will refer to and as the ‘effective radius’ or ‘half-light radius’ of bulge and disc, respectively. Assuming randomly oriented discs, the average inclination is about . Unless otherwise stated, the discs in our bulge-plus-disc models have this inclination.
3.2 Possible caveats of the model
The photometric profile decompositions of galaxies in CL 1358+62 provide an observational motivation for modelling early-type galaxies including disc structures. However, galaxies in cluster environments might exhibit more pronounced discs than corresponding galaxies in the field. If this is indeed the case, and simulations of Naab & Burkert (2001) suggest otherwise, the discs in our model lensing galaxies could be too pronounced compared to those expected in observed early-type lens systems, many of which are in lower-density field environments. A comparison of the disc sizes obtained from a sample of mostly field ellipticals by Scorza & Bender (1995) with the sizes of discs in E’s and S0’s found in Kelson et al. (2000) shows that the discs from both samples are similar and range in disc half-light radii from to . This could indicate that the environment may influence the relative number of galaxies as a function of morphology, but has little effect on the properties of discs in galaxies of a given morphological type. In any case, we are not concerned here with accurate modelling of the statistical incidence of discs, but rather aim to show how discs with sizes and masses consistent with current observations influence the gravitational lensing properties of early-type lens systems.
There is a second possible caveat with the mass model we use here: we assume that mass follows light and do not include a dark matter halo. As we will discuss in more detail below, the main effect of inclined, thin disc components on the lensing properties of galaxies arises from the strong asymmetry that is introduced in the central regions of the galaxies due to the disc. We therefore expect that the precise form of the spherical or nearly-spherical components in which the disc is embedded, that is, the bulge and halo, will not change the effect of the added disc component drastically. We have checked this explicitly for the mass model used to derive the results in §5 and §6, by adding a dark matter halo that contains 2/3 of the total mass and scaling the mass of the bulge and disc so that the Einstein radius is the same as for the model without a dark-matter halo. Estimates of the mass-to-light ratio of early type galaxies range from in the K-band (e.g. Moriondo, Giovanardi & Hunt 1998) to about in the V-band (Natarajan et al. 1998). Many lens systems are consistent with lower mass-to-light ratios within an Einstein radius of about in V (Koopmans & Treu 2003), motivating our choice of a dark halo containing 2/3 of the total mass. When including such a spherical dark halo we find that the inner caustic shrinks in size, and so quad images become less likely, but that the magnification ratios and time delays of images of sources that are quadruply imaged do not change substantially.
3.3 Surface density and mass profiles of lens models

We show the radial surface mass density profiles for some typical cases in Fig. 2. The solid lines show the density profiles of three bulge-only models with effective radii of 0.2, 1.0 and 2.0 arcsec. At the cluster redshift of these values correspond to , and respectively. These values cover the range of half-light radii of the bulge-only fits to the light profiles of the galaxies in CL 1358+62, which lie between 0.2 and with only two galaxies having half-light radii larger than . The dashed lines in Fig. 2 show the surface mass densities for discs of effective radii of 0.05, 0.2 and . The discs are assumed to be inclined at to the line of sight. Most of the bulge-plus-disc fits to the light profile of the elliptical galaxies in the sample have discs with effective radii less than , corresponding to at . The disc components of the later type galaxies are usually larger, with effective radii of up to . Comparison of the relative bulge and disc contributions shows that the disc components contribute significantly to the surface mass density within about , or . The dotted lines show the total surface mass density for a typical bulge-plus-disc fit, but with different B/T mass ratios. It is clear that the radial profiles for models that include a disc of less than per cent of the total mass are very similar to bulge-only models. For B/T mass ratios of or less, that is for most of the S0/Sa or later type galaxies in Kelson et al., the surface mass density in the inner differs by more than per cent.

Gravitational lensing measures directly the projected mass contained inside a circular region of radius . In Fig. 3 we show as a function of radius . All the models shown are normalized to the same total mass, but the B/T mass ratio varies. The effective radius of disc and bulge, ellipticity of bulge and inclination angle of disc are , , and respectively and are the same for all models. These values correspond to the typical values for an elliptical galaxy in CL 1358+62. At distances of the enclosed mass for typical bulge-plus-disc models with B/T is only a few percent larger than the enclosed mass for bulge-only models. None of the discs in the light profile fits to the early-type galaxies in CL 1358+62 contain more than per cent of the light (cf. Table A1), and so, if the mass-to-light ratio is constant, then disc structures are expected to contain at most per cent of the mass. The effect of the disc on the maximum image separations or the radius of the Einstein ring will be small in those cases. More massive discs with a mass of , contribute significantly to the mass in the inner region of the galaxy and influence the mass contained within the expected Einstein radius more strongly.
The properties of all the elliptical galaxies from the Kelson et al. (2000) catalogue with the reduced disc contribution adopted for our simulations are summarized in Table 1. The table lists both the values for the best fitting bulge-only models and the values for the best bulge-plus-disc fits. The two parameters and give the B/T mass ratio as measured at the Einstein radius and at respectively. The Einstein radius is calculated taking account of the ellipticity of the bulge and the inclination of the disc. Note that the Einstein radius does not depend strongly on whether a disc is included or not: there is no systematic dependence of the Einstein radius on the presence of a disc.
| Bulge only | Bulge and disc | |||||||||||||
|---|---|---|---|---|---|---|---|---|---|---|---|---|---|---|
| No. | Type | |||||||||||||
| 212 | E | 20.780 | 0.683 | 0.488 | 1.220 | 21.170 | 0.781 | 0.340 | 18.030 | 0.031 | 6.138 | 1.160 | 0.808 | 0.960 |
| 242 | E | 21.920 | 1.529 | 0.171 | 1.360 | 22.420 | 1.825 | 0.108 | 20.720 | 0.156 | 0.515 | 1.270 | 0.806 | 0.950 |
| 256 | E | 20.880 | 1.380 | 0.445 | 2.330 | 21.200 | 1.551 | 0.331 | 18.000 | 0.053 | 6.310 | 2.260 | 0.836 | 0.967 |
| 303 | E | 20.590 | 0.638 | 0.581 | 1.270 | 21.110 | 0.774 | 0.360 | 18.890 | 0.054 | 2.780 | 1.210 | 0.787 | 0.947 |
| 360 | E | 20.220 | 0.341 | 0.817 | 2.176 | 21.660 | 0.594 | 0.217 | 17.620 | 0.030 | 8.954 | 1.000 | 0.565 | 0.867 |
| 375 | E | 22.860 | 4.979 | 0.072 | 2.650 | 23.010 | 5.267 | 0.063 | 19.220 | 0.096 | 2.051 | 2.870 | 0.800 | 0.984 |
| 409 | E | 21.270 | 0.498 | 0.310 | 2.176 | 21.490 | 0.542 | 0.254 | 22.600 | 0.132 | 0.091 | 0.660 | 0.959 | 0.969 |
| 412 | E | 21.390 | 0.767 | 0.278 | 2.176 | 22.320 | 1.091 | 0.118 | 17.660 | 0.033 | 8.630 | 0.870 | 0.502 | 0.908 |
| 531 | E | 21.260 | 1.549 | 0.313 | 2.090 | 21.710 | 1.830 | 0.207 | 19.300 | 0.108 | 1.905 | 1.980 | 0.772 | 0.954 |
| 534 | E | 21.210 | 0.620 | 0.328 | 0.860 | 22.170 | 0.878 | 0.136 | 16.680 | 0.019 | 1.281 | 0.770 | 0.489 | 0.901 |
| 536 | E | 21.180 | 1.266 | 0.337 | 1.790 | 21.520 | 1.433 | 0.247 | 18.570 | 0.057 | 3.733 | 1.720 | 0.807 | 0.965 |
4 Lensing Properties
The lensing properties of discs in spiral galaxies have been studied by Maller, Flores & Primack (1997), Möller & Blain (1998) and Blain, Möller, & Maller (1999). In those studies it was found that thin exponential discs can influence the statistical lensing properties even if they only contain per cent of the total mass provided that they are inclined by more than about to the line of sight. In particular, the cross section for image geometries with 4 or more magnified images, and the cross section for high magnifications of 10 or more is increased considerably. These results are generic and hold qualitatively for discs in early-type galaxies. However, the scale lengths and masses of the disc components in early-type galaxies are likely to be smaller, relative to the bulge component, and so the effect of the disc on their statistical lensing properties is expected to be less. In this section, we describe the general and statistical lensing properties of discy early-type galaxies.
4.1 General lensing properties
The gravitational potential of a mass distribution between an observer at and a source at deflects the light of the source, at position on the source plane, so that an image is observed at position on the lens plane, where
| (8) |
The deflection angle of a light ray that passes the lens at an angular position relative to the lens centre, is given by
| (9) |
where and are the angular diameter distances from observer to source and lens to source respectively. The dimensionless quantity is defined as where
| (10) |
is the critical surface mass density. These equations show explicitly why thin disc components may be important, even if they contain only a small fraction of the total mass: it is the projected surface mass density that enters equation (9) and this can be very high for thin edge-on discs.
The numerical ray-tracing routines that we used to obtain the results in this paper are described in detail in Möller & Blain (1998, 2001). The routines were used to generate magnification maps on the source plane and determine the cross sections for high magnifications and multiple imaging.
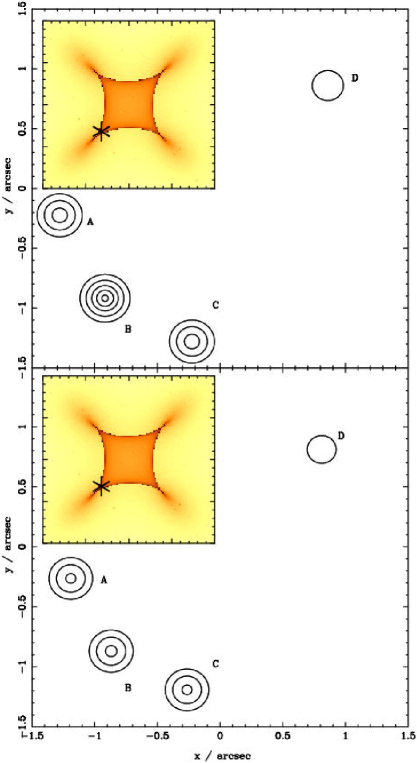
To illustrate the possible effect of disc components in a lens system, Fig. 4 shows the images of a background point source at a redshift of that is lensed by a foreground elliptical galaxy at redshift . The images are shown for the bulge-plus-disc and pure-bulge model discussed in § 2. The source position is adjusted slightly, by less than , so that both the total magnification of the source and the image geometries are very similar. Note the change in the relative fluxes of the images. The insets show the magnification maps on the source plane, for both cases; the disc increases the area enclosed by the caustic only slightly. Comparing the magnification maps on the source plane as shown in the insets of Fig. 4 with those of disc lenses shown in Fig. 3 in Möller & Blain (1998), makes clear that the effect of a disc component in early-type lensing galaxies is much less pronounced. However, there are differences in the magnification ratios which we will investigate more in §5.
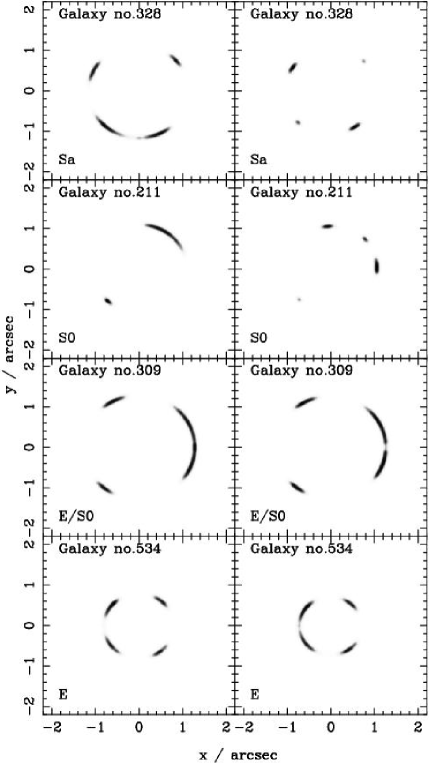
The importance of discs can also be seen when the relative shifts of the image positions for a source at a fixed position is considered. The shift gives some indication of how significant a given modification of a lens model is. We show the image geometries for small, extended sources for a number of our lens models in Fig. 5. There is a small, but measurable change in the image shapes and positions for E/S0 lenses of the order of . In the case of later-type lenses, there is a much more pronounced change; even Sa lens galaxies significantly change the image geometries. Note that there is also a change in the overall scale set by the Einstein radius, of per cent. This is consistent with the change of mass projected within the Einstein radius shown in Fig. 3. However, this change of scale only affects the mass normalization and does not reflect an observable effect of the disc component.
4.2 Statistical lensing properties
First we determine cross sections for multiple images and high magnifications for ellipticals that include an inclined, thin, exponential disc.

In Fig. 6 we show the cross section ratios for bulge and bulge-plus-disc models as a function of magnification, averaged over all the galaxies of a certain morphological classification in the sample. Except for late-type (Sa, Sab and Sb) galaxies, there is no significant increase in the cross sections for magnifications of up to 100. Even though a few early-type galaxies show a clear signature of an enhancement by the disc component in the magnification map on the source plane, the average effect is small.
Rusin & Tegmark (2001) showed that the fraction of 4 image systems found in the CLASS survey is inconsistent with the predictions from standard lens models. They found that under the assumption of dark matter halos that are not significantly more flattened than the visible mass, about per cent of all CLASS lenses should be quads. However, the observed fraction is about per cent. We now investigate whether disc structures in the early-type lensing galaxies could explain this discrepancy.

Fig. 7 shows the expected fraction of quad systems as a function of the total magnification threshold for the different morphological types. There is no significant increase in the cross section for the formation of a quad lens for the subset of early-type galaxies; this cross section increases significantly only for the late-type galaxies. Many observed quad lens systems are very symmetrical. This suggests that the sources do not lie very close to a cusp (B1422+231 is an exception), and so that the sources of the majority of known quad lens systems are likely to be magnified by only moderate amounts . Hence, discs in ellipticals cannot explain the discrepancy between the predicted and observed quad fraction. However, our calculations are conservative, as they do not take into account the proper statistical range of lens parameters, source luminosity function, the selection function of the survey and the magnification bias. Rusin & Tegmark (2001) show that such factors can increase the predicted fraction of quads at modest magnifications by up to a factor of .
Statistical lensing constraints obtained from CLASS by Chae (2002) suggest that the observed fraction of quad lenses is consistent with an average lens ellipticity , and thus that many S0 and later lenses must be present to match this ellipticity. Our results in Fig. 7 suggest that if the majority of lens galaxies are indeed later than S0, then the predicted fraction of quads is consistent with the observations.
In summary, these results indicate that the presence of discs with constant mass-to-light ratio in ellipticals, is unlikely to affect the population statistics of strong lens systems. However, inspecting the magnification maps on the source plane shows that discs might have a significant effect for individual lenses (Fig. 5). To investigate this further we determined how much the magnification ratios of individual lens systems are affected when a disc component is included in the lens model.
5 Magnification ratios
Attempts to model a number of known quad lens systems, like B1422+231 and PG1115+080 have shown that smooth power-law ellipsoidal models cannot fit both the observed image positions and magnification ratios. This has been generally interpreted as evidence for substructure in their CDM haloes (Metcalf & Madau 2001; Bradač et al. 2002; Chiba 2002; Dalal & Kochanek 2002; Metcalf & Zhao 2002). The observational detection of substructure in dark matter haloes would be of great importance for the standard model of structure formation, which predicts such CDM substructure on galactic and sub-galactic scales (Moore et al. 1999). If the presence of CDM halo substructure provides the only possible explanation for the observed magnification ratios, this would provide strong observational evidence in support of the current CDM model. We now investigate whether discs in early-type lens galaxies provide an alternative explanation.
5.1 Causes for unusual magnification ratios
As pointed out by Mao & Schneider (1998), for point sources that are highly magnified and split into 4 magnified images, A, B, C and D, with B the brightest and D the faintest image (cf. Fig. 4 in the previous section; note that we differ here from the more conventional labelling, where images are labelled A,B,C and D in order of decreasing brightness), the individual image magnifications obey the relation
| (11) |
in the limit of . The loci of source positions at which is infinite form the caustic line, and so equation (11) holds for sources lying exactly on the caustic. What is not known, however, is how well equation (11) holds for sources that lie close to the caustic, or, for sources of small but finite size. In addition, it is not clear how the details of the lensing potential will affect this behaviour close to the caustics. The observed magnification ratios in systems like B1422+231 grossly violate equation (11). This discrepancy is the main reason why the observed magnification ratios are generally regarded as strong evidence for CDM-halo substructures with masses of the order of M⊙, which can strongly affect the flux of individual images if located close to the images. However, there are several other explanations:
-
1.
microlensing. In many strong lens systems, microlensing variability has been detected and it is difficult to exclude the possibility of microlensing in the observed systems with certainty.
-
2.
differential extinction. There is a possibility that optical flux ratios of the images are affected by different dust columns along the lines of sight through the lensing galaxy.
-
3.
the source is extended. Extended radio sources may lead to very different magnification ratios in the observed images, depending on the size and relative brightness of the different source components. Recent simulations by Moustakas & Metcalf (2003) suggest that even for extended sources there is no change in the continuum magnification ratios for smooth lens models; only the relative contributions from broad and narrow lines is affected.
-
4.
off-caustic sources. If the source does not lie exactly on the caustic but is still magnified strongly, then the magnification ratios will not necessarily obey equation (11).
We now investigate the validity of the last explanation in the context of discs in early-type lensing galaxies.
5.2 Known lens systems with unusual magnification ratios
There have been two recent studies of lens systems with unusual magnification ratios. In the comprehensive study by Metcalf & Zhao (2002) 4 systems are listed where the magnification ratios deviate by or more from the expected values assuming a one component smooth ellipsoidal lens with external shear; B1422+231, PG1115+080, H1413+117 and Q2237+030. The first three systems are quasars lensed by early-type galaxies while the lens in Q2237+030 is a barred spiral. Of the four systems, H1413+117 lies close to a cluster of galaxies which may crucially affect the lensing potential (Kneib et al. 1998; Chae & Turnshek 1999). Q2237+030 is lensed by a galaxy at a very low redshift of and microlensing affects the flux ratios by up to a factor of two (Irwin et al. 1989; Woźniak et al. 2000). PG1115+080 and B1422+231 are affected only very moderately if at all by microlensing (Vanderriest et al. 1986; Yee & Bechtold 1996), but both reside very close to, or even within, a galaxy group (Tonry 1998; Kundić et al. 1997a,b). As shown by Möller et al. (2002), the presence of the group can significantly alter the lensing behaviour and it is doubtful whether a simple power-law-plus-shear model, as used for example by Keeton, Kochanek & Seljak (1997) reflects the true lensing potential adequately. For B1422+231 the predicted and observed magnification ratios differ by up to , as compared to only for PG1115+080, and so it is less likely that the discrepancy in B1422+231 is a result of the details of the group mass distribution surrounding the lens. This points out B1422+231 as the strongest candidate for dark substructures: it is studied in great detail by Bradač et al. (2002).
A recent theoretical study (Keeton, Gaudi & Petters 2002) investigated the magnification ratios of four caustic lens systems in more detail, using an analysis similar to that presented here but with a simple one-component lens model: B2045+265, B0712+472, RX J0911+0551 and B1422+231 (Keeton, Gaudi & Petters 2002). RX J0911+0551 has only optical and near-infrared flux measurements, and so the extinction corrections for this source are highly uncertain. B0712+472 is possibly affected by a foreground group (Fassnacht & Lubin 2002). Keck spectra of B2045+265 indicate that it is likely to be a late-type lens (Fassnacht et al. 1999), and so it is unlikely that a simple one-component model is viable: a disc is almost certainly present. Note that only B1422+231 was included in the study of Metcalf & Zhao (2002).
The number of lens systems that are claimed to have magnification ratios that can only be explained using compact CDM substructure is rather large. In some cases, microlensing variability or differential extinction could be a viable alternative explanation, but not for all.
| System | ||||||
|---|---|---|---|---|---|---|
| PG1115+0801 | 2.490.03 | 3.22 | 0.64 | 1.0 | 0.98 | 6.35 |
| B0712+4722 | 10.5mJy | 8.5mJy | 4.7mJy | 0.9mJy | 1.78 | 26.3 |
| B2045+2653 | 18.4mJy | 9.42mJy | 14.8mJy | 2.41 mJy | 3.5 | 17.7 |
| B1422+2314 | 152 | 164 | 81 | 5 | 1.42 | 79.4 |
| H1413+1175 | 1.65 | 1.62 | 1.0 | 0.67 | 1.63 | 6.1 |
| Q2237+0306 | 78 Jy | 60 Jy | 85 Jy | 43 Jy | 2.7 | 5.2 |
| RX J0911+05517 | 1.0 | 0.965 | 0.544 | 0.458 | 1.60 | 5.48 |
We summarise the properties of all these lens systems in Table 2. Together with the image fluxes, we list the magnification ratios and .
5.3 Magnification ratios for bulge-plus-disc models of early-type lens galaxies
To answer the question whether discs in early-type lenses could explain some or all of the observed magnification ratios, we computed all the image multiplicities, position and magnifications for all sources on a pixel grid for our particular representative model galaxy (galaxy no. 242). We performed the calculations both on a low-resolution grid that contained the whole caustic structure and on a smaller, higher resolution grid, that contained one of the cusps along the major axis of the lens galaxy. For both grids, we selected all sources with quad images, yielding a total sample of about 40000 simulated image systems.
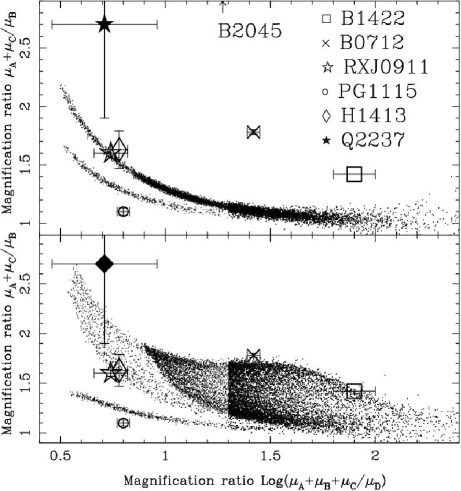
Fig. 8 shows a scatter plot of the ratio of the sum of the magnifications of the outer two images to the central image , versus the ratio of the total magnification of the brightest three images, A-C to the magnification of the faintest image D, . The points in the upper panel are for the pure-bulge model, whereas the points in the lower panel are for the bulge-plus-disc model. For large magnification ratios there is a significant difference. All the images of sources with high total magnifications, corresponding to a high ratio, scatter around for the bulge-only models. For large the scatter of a few per cent equals that expected from numerical uncertainties in the simulations, due to small deviations in the deflection angle that lead to large deviations in the source position and images occasionally being missed or associated with a wrong source position. Note that there are two distinct and well defined ‘populations’ of images, corresponding to images in the two different types of cusp regions (see
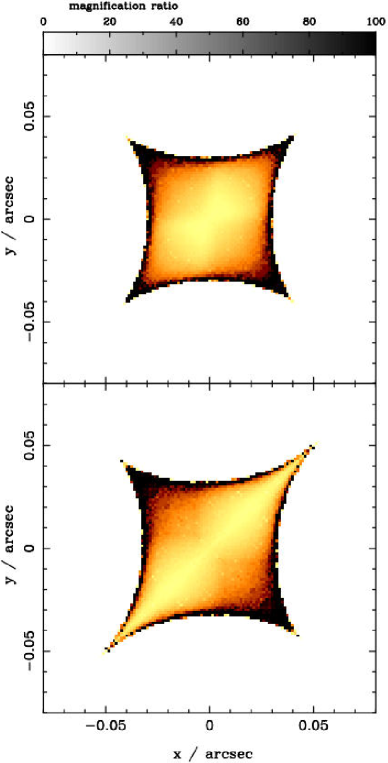
Fig. 9). The two panels of Fig. 9 show quantitatively how much the image magnification ratios deviate from equation (11) as a function of source position, both for the bulge-plus-disc model (upper panel) and the bulge-only model (lower panel). These maps are similar overall, but differ significantly in the two cusps that are aligned with the disc: when a disc is present, images of sources that lie very close to these cusps have magnification ratios that are inconsistent with the predictions of equation (11). The images that are produced by sources that lie close to these two cusps form the second population of images in the bottom panel of Fig. 8.
As an example, Fig. 4 illustrates the behaviour for sources in the lower-left cusp of our model. By comparing the relative fluxes of the images in the top and bottom panels of Fig. 4, one can see by eye that the sum of the fluxes of the images A and C is roughly equal to the flux of image B in the bulge only model, but not in the bulge-plus-disc model. The relative positions and flux ratios of the images A,B and C in the lower panel of that figure are very close to those observed in B1422+231.
Figs 8 and 9 show the difference between the bulge and bulge-plus-disc models. In the bulge-plus-disc model a set of sources exists with an image magnification ratio very different from one, even for high magnifications of . All these sources lie inside one of the two cusps along the major axis. Note that for all those images, the faintest image D lies at a large distance of from the centre of the lensing galaxy and is not demagnified. This reflects the high total magnification of a source which lies close to the caustic line.
Some unusual observed magnification ratios of some observed lens systems are indicated by the large symbols in Fig. 8. Error bars indicate the 1- flux measurement errors (Table 2). Only H1413+117 and RXJ0911+0551 lie in regions of the diagram that are consistent with a bulge-only model.
However, the bulge-plus-disc model is clearly consistent with the magnification ratios for PG1115+080, H1413+117, RX J0911+0551, B0712+472, Q2237+030 and B1422+231. B2045+265 is the only system for which our model cannot reproduce the observed magnification ratios. This source is lensed by a spiral galaxy, and so our early-type lens model with a very modest disc would not be expected to provide a good fit.
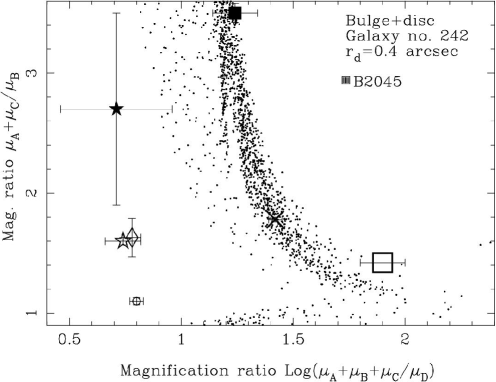
In Fig. 10 we show magnification ratios for about 40000 simulated image systems (without using a second higher-resolution grid) for a bulge-plus-disc model with a disc that has a scale-length twice that of the previous bulge-plus-disc model. All the other parameters are unchanged and correspond to galaxy no. 242. The effect of increasing the disc mass is to substantially increase the ratio for image systems with magnifications . The magnification ratio of B2045+265 is now consistent with the predicted value.
We conclude that the presence of an inclined disc component containing of order 5 per cent of the total mass can describe all of the known early-type lens systems with unusual magnification ratios without requiring compact substructure in the lens halo.
5.4 Effect of disc size, disc inclination, bulge ellipticity and a dark halo
We have used a particular model galaxy (§ 2) as a lens. In order to make sure that our results apply in general to bulge-plus-disc models of early-type galaxies and are not specific to our particular choice of parameters we investigated a range of other models. The full parameter space for bulge-plus-disc models is large and a detailed study is beyond the scope of this paper. We investigated the dependence on several parameters qualitatively. We find that, qualitatively, any disc that on its own produces a caustic of similar or larger size than that produced by the bulge is effective at modifying the image properties. In practice that means any disc that is inclined by more than with a scale-length of the order of the size of the caustic of the corresponding bulge-only model. For nearly spherical bulges, discs with smaller scale-lengths are also effective, and naturally produce magnification ratios similar to those observed for B1422+231. For disc sizes below , the disc inclination must be increased beyond to obtain magnification ratios consistent with B1422+231. Even an edge-on disc smaller than cannot reproduce the magnification ratios of B1422+231. There is also the possibility of misalignment between the positions of the disc and the bulge/halo. Such misalignments are to be expected as a result of recent merger events and may lead to complicated and unusual lensing configurations and provide more extreme changes in the magnification ratios, as discussed by Quadri, Möller & Natarajan (2002).
We have also investigated models with a CDM halo. Adding a singular CDM halo, containing 2/3 of the total mass within an Einstein radius, and adjusting the mass normalization of the bulge and disc so as to keep the Einstein radius constant, does not significantly alter the effect of the disc. It is purely the presence of a thin disc structure in combination with a more spherical mass component that produces the change in magnification ratios.
5.5 Expected number of affected systems
Möller & Blain (1998) have shown that discs in spiral galaxies are important for the statistical effects on lensing cross sections only at inclination angles of . Assuming that a fraction of per cent of all early-type lens galaxies do contain discs, per cent will contain discs with inclination angles of . A conservative estimate of the fraction of early-type lens systems in which discs may be important is thus per cent. This fraction is consistent with the number of CLASS quad lens systems with deviant magnification ratios: of the 7 CLASS quad lenses, at least two early-type lens system (B1422+231 and B0712+472) exhibit magnification ratios inconsistent with simple power-law plus external-shear models.
An additional factor to consider is magnification bias. Depending on the bulge-to-disc ratio, the disc may lead to higher cross sections for strong magnifications, as shown in Fig. 6. This could bias a flux-limited sample towards lens galaxies that contain discs. However, as shown in Fig. 6, the cross section is not increased significantly for E/S0/Sa galaxies, and so the magnification bias is likely to be small.
5.6 Distinguishing the effect of discs and CDM substructure
The results described in this section demonstrate that discs in early-type lensing galaxies may explain some of the observed magnification ratios that have hitherto only been explained assuming CDM substructure. There are some key observational differences between these two scenarios.
First, discs in early-type lens galaxies are, in principle, detectable by bulge-plus-disc light profile decompositions as discussed in § 2. However, the light of the background quasar makes accurate photometry of lens galaxies extremely difficult in practice. Treu & Koopmans (2002) obtained kinematic information of a lensing galaxy from spectroscopic observations, and demonstrated that it is thus possible to obtain additional constraints on its mass distribution. It might be possible to constrain possible disc structures in lensing galaxies in this way.
Secondly, disc structures significantly affect only the magnification ratios of sources that lie within one of the two cusps along the discs. Assuming that discs are oriented along the major axis of the bulge ellipticity, this means that disc structures provide an explanation of discrepant magnification ratios only for quad image systems with three strongly magnified images along a line perpendicular to the major axis of the lens galaxy, whereas CDM substructure could modify any image configuration. Note that this is not true for late-type lenses with extended inclined discs, in which the caustic structures are completely dominated by the disc, and the disc strongly affects the magnification ratios of quad systems produced by sources in any one of the four cusps.
We stress that these results do not prove the existence of discs in early-type lensing galaxies, nor do we propose that such disc structures provide the only explanation for all the observed magnification ratios. For all systems, the observed magnification ratios could be caused by CDM substructures. We have not carried out detailed modelling of any of the observed systems, and our analysis does not include joint fitting to both magnification ratios and image positions. However, in contrast to Keeton et al. (2002) we find that magnification ratios alone do not provide conclusive evidence for the presence of CDM halo substructure: realistic disc structures can explain the observed magnification ratios equally well. Detailed case-by-case lens modelling using bulge-plus-disc models is now needed to verify that early-type galaxies with disc structures are indeed viable models for all or at least some of the observed lens systems. The fact that discs affect image positions very slightly, even for a fixed source position, indicate that detailed bulge-plus-disc models are likely to be successful in fitting magnification ratios and image positions.
6 Effect on Hubble parameter estimation
Strong gravitational lensing of variable background quasars provides a unique method to determine the Hubble constant. Brightness fluctuations are observed at different times at each image as the path lengths and gravitational time delays to each image depend on its relative position and the local lensing potential. If the image positions and lensing potential are known, then can be determined, as . Gravitational and geometric time delays are often of roughly equal magnitude, and so an accurate knowledge of the lensing potential is crucial to deduce an accurate value of .
Lens systems with measured time delays are nearly always associated with early-type lens galaxies, although B1600+434 (Koopmans et al. 2000) and B0218+357 (Wucknitz, priv. comm.) are notable exceptions. These systems have been modelled using bulge-only models, with a constant external shear in some cases.
We now investigate how a disc component is likely to affect time delays for the bulge and bulge-plus-disc model of galaxy no. 242. The time delay between two images at and of a source at is
| (12) |
where is the angular diameter distances between observer and lens. The distances and thus are proportional to . The lens redshift is and the potentials due to bulge and disc components are and respectively. In § 4 we pointed out that the shift in image positions between bulge-plus-disc and bulge-only models for E and E/S0 type lensing galaxies is expected to be very small.
We are concerned here with the effects of modelling an early-type lens that contains a disc with a bulge-only model. Since the lens models are obtained from fits to the image positions, the image positions remain the same irrespective of the model used. Therefore, the geometrical time delay of a given pair of images is not affected by a disc component; any change in the time delay is due to the change in the potential at the image positions.
Note that compact CDM substructure does not affect time-delays measurably.
6.1 Four-image/quad systems
About half of the known lens systems with measured time delays are quad systems. Since the quad caustic structure is the region in the source plane that is most strongly affected by the presence of a disc, the greatest effect of a disc on time delays is expected in these systems. In most cases a single time delay is measured, usually between the image pair with the largest separation. Using our ray-tracing code in combination with equation (12) we calculated the time delays between images B and D for all quad systems of the model galaxy described in § 2.
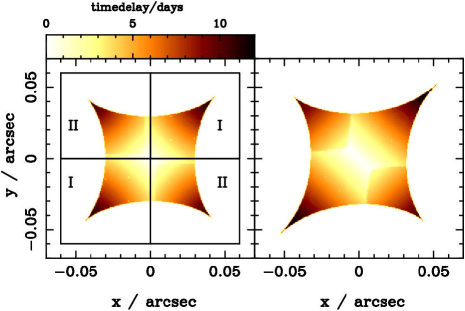
Fig. 11 shows the time delays as a function of source position for bulge-plus-disc and bulge-only models. The difference is on the order of a few tens of per cent, and is largest in the cusps lying along the disc (the regions marked I). Especially in the cusp regions close to the caustic, where the image magnification is greatest, the time delays for the bulge-plus-disc model are per cent larger than for the bulge-only model.

The time-delay statistics for regions I and II are shown in Fig. 12. For each region in Fig. 11 the time delays are divided into 50 bins and the histograms are normalized to unity. Comparing the histograms in the right panel of Fig. 12, there is no significant difference between the bulge-plus-disc and bulge-only model time-delay statistics in the cusps away from the disc (the regions marked II on Fig. 11). However, the histograms in the left panel of Fig. 12 show that the time delays in the cusps lying along the disc are increased by per cent for the bulge-plus-disc model with respect to the bulge-only model. The overall distribution for the bulge only model is shifted towards shorter time delays with respect to the bulge-plus-disc models. Assuming that an elliptical lens galaxy that contains a disc is modelled using a bulge-only model, this suggests that the Hubble constant will be underestimated systematically.

In Fig. 13 we show explicitly that disc components alter the individual image positions only very slightly for our model galaxy no. 242. The figure shows the distribution of image separations for both models. The images are systematically further apart in the bulge-only models, suggesting a larger mass inside the Einstein radius and thus a larger predicted time delay, if the radial profile of the potential is unaffected. In observed lens systems, the lens would be modelled to fit the image configurations, and so a bulge-only model fitted to the observed image separations would contain less mass within the Einstein radius than the bulge-only model with the time delay distribution shown in Fig. 12. This would shift the time-delay distributions shown in Fig. 12 for the bulge-only model to even lower time delays. The only possibility both to fit the image separations and obtain similar distribution of time delays is by changing the gradient of the potential between the images. For point sources, the only other lensing property that is sensitive to the shape of the potential is the magnification ratio between the images. Thus, if magnification ratios are not used to constrain lens models, then bulge-only models might fit the image positions of a lens that actually consists of a bulge-plus-disc lens, yielding an incorrect mass model and an value that is systematically too low by up to 25 per cent.
6.2 Two-image systems
Quad lens systems are generally regarded as being more useful than 2-image systems for determinations because more constraints on the lensing potential are available. However, many 2-image lens systems have been used for time delay measurements. In these cases, the source lies outside the diamond-shaped caustic, where magnifications . These images are expected to be affected only weakly by a disc component.

We have calculated the time delays for 2-image systems and show the corresponding statistics in Fig. 14. Comparison with Fig. 12 shows that the effect of a disc component on the time delay is much smaller for 2-image systems than for quad systems. A number of 2-image systems with measured time delays, like B0218+357 (Biggs et al. 1999) have possible disc structures, but even if these are present, our results indicate that the the effect on estimates of is small. Note that recent observations (Wucknitz, private comm.) indicate that the lens in B0218+357 is a spiral galaxy. Massive discs, as expected in spiral lenses, may affect the time delays much more strongly.
6.3 Parameter dependence
The results in this and the preceding section show that any inclined discs within elliptical lens galaxies affect sources in the cusps lying along the disc most strongly, whereas the effect on the cusps lying away from the disc is small. We have not checked the dependence of the time-delay statistics on the disc parameters in detail, but the dependence is similar to that discussed in § 5.4 since magnification ratios and time delays are both sensitive on changes in the cusps. The results we obtained in that section also hold for the time delays. Disc structures are important if they are inclined at to the line of sight and are massive/extended enough to produce a caustic of a size that is of the order of the caustic produced by the bulge. That is typically the case for discs larger than and with masses of at least per cent of the bulge, for which time delays will be increased by a few tens of per cent relative to bulge-only models.
6.4 The effect on estimates on
Our approach here only gives a rough indication of how determinations of are affected by disc structures. To be any more quantitative about the uncertainties that arise it is necessary to perform detailed modelling of known systems using bulge and bulge-plus-disc models, which is difficult and time-consuming. However, our results offer a possible resolution as to why there is a significant discrepancy between determinations of from CMB data (Lewis & Bridle 2002), the HST Key-project (Freedman et al. 2001) and gravitational lensing (Kochanek 2003).
The effect of disc structures on time-delays is much more significant for quad systems than for 2-image systems. In addition, we expect that there will be a correlation between low- results and unusual magnification ratios if discs are present. This seems to be the case: Biggs et al. (1999) derive for the 2-image system B0218+357, whereas Impey et al. (1998) obtain for PG1115+080, a quad system with unusual magnification ratios. The errors on the estimate by Biggs et al. (1999) have recently been disputed by Lehar et al.(2000) and Wucknitz, Biggs & Browne (MNRAS, submitted). More recent single-component models of PG1115+080 by Treu & Koopmans (2002) give a higher value of . The larger errors are statistical, and the smaller error of is an estimate of the systematic error. No other quad systems with measured time delays have unusual magnification ratios, and the values of determined from these systems are generally higher.
7 Conclusions
Gravitational lensing plays a role of ever increasing importance in determining cosmological parameters, notably , and constraining the dark matter distribution on a variety of scales. More than 50 strong gravitational lens systems are known. Generally, it is not possible to constrain the mass distribution of the lensing galaxy uniquely, due to the degeneracies present. Whether this uncertainty in models has serious implications for cosmological parameter estimation from strong lensing is still unclear.
The majority of all lensing galaxies have been classified as massive early-type galaxies. Reliable photometric determination of the presence of a disc component is difficult due to the usually very bright lensed quasar images. Therefore, discs similar to those discussed in this paper would not generally have been identified in existing images. However, observations of early-type galaxies in the local universe and in the moderate-redshift cluster CL 1358+62 suggest strongly that a large fraction of early-type galaxies contain disc-like structures.
We have investigated how the lensing properties of early-type galaxies would change if a thin disc component that contains about 5 per cent of the mass is included:
-
1.
If early-type galaxies contain disc components, the statistical lensing properties of early-type lensing galaxies are affected by less than about 5 per cent. Only if the majority of lensing galaxies are of S0/Sa or later types would the expected relative number of quad to 2-image lens systems increase by a factor of 2 or more.
-
2.
A disc component in early-type lensing galaxies affects significantly the expected magnification ratios of highly magnified quad systems. If a disc component is present in the lens and inclined at more than to the line of sight, the resulting image configurations and magnification ratios can resemble that of systems like B1422+231.
-
3.
Time delays may be affected significantly by the presence of a disc component in individual early-type lens galaxies. Bulge-only lens models used to fit bulge-plus-disc lenses fit lensed image positions well, but would yield a value for that is systematically low by about 25 per cent.
The presence of inclined exponential discs in early-type lensing galaxies affect the lensing properties of quad lens systems significantly. Assuming that the majority of all early-type lens galaxies contain discs, then both the time delays and magnification ratios are expected to be affected by disc components in per cent of all quad lens systems. One or two of the quad lenses identified by CLASS is expected to be affected (consistent with the properties of B1422+231). Bulge-plus-disc models provide an alternative explanation to the observed magnification ratios and lead to systematically longer time-delays. In order to obtain more stringent constraints on the presence of CDM substructure in the lens and on the effect of discs on measurements, detailed lens modelling of known lens systems will be necessary. Fitting models that include exponential discs to real lens systems is much more computationally intensive than the calculations performed here, but may be possible.
We have discussed the first order effect of discs in early-type galaxies on observed lensing properties. Once a large number of lens systems is known, it might also be possible to use lensing to constrain the masses and parameters of those systems. Determining the abundance and properties of discs in ellipticals in more detail, and at different redshifts, using gravitational lensing would shed new light on the details of the formation of discs in early-type galaxies.
acknowledgements
OM acknowledges financial support from a European Community Marie Curie Fellowship. We thank Konrad Kuijken and the referee for helpful comments on the manuscript.
References
- [Abraham & van den Bergh 2001] Abraham R. G., van den Bergh S., 2001, Science, 293, 1273
- [Barnes 2002] Barnes J. E., 2002, MNRAS, 333, 481
- [Bender, Surma, Doebereiner, Moellenhoff, & Madejsky 1989] Bender R., Surma P., Doebereiner S., Moellenhoff C., Madejsky R., 1989, A&A, 217, 35
- [Bennett, et al.] Bennett C. L., et al., 2003, ApJ, submitted, astro-ph/0302207.
- [Benjamin & Danly 1997] Benjamin R. A., Danly L., 1997, ApJ, 481, 764
- [Biggs, Browne, Helbig, Koopmans, Wilkinson, & Perley 1999] Biggs A. D., Browne I. W. A., Helbig P., Koopmans L. V. E., Wilkinson P. N., Perley R. A., 1999, MNRAS, 304, 349
- [Binney & Tremaine 1987] Binney J., Tremaine S., 1987, “Galactic dynamics”. Princeton, NJ, Princeton University Press, 1987, p747
- [Blain, Möller, & Maller 1999] Blain A. W., Möller O., Maller A. H., 1999, MNRAS, 303, 423
- [Bradač, Schneider, Steinmetz, Lombardi, King, & Porcas 2002] Bradač M., Schneider P., Steinmetz M., Lombardi M., King L. J., Porcas R., 2002, A&A, 388, 373
- [Burud, Courbin, Lidman, Jaunsen, Hjorth, Ostensen, Andersen, Clasen, Wucknitz, Meylan, Magain, Stabell, & Refsdal 1998] Burud I., Courbin F., Lidman C., Jaunsen A. O., Hjorth J., Ostensen R., Andersen M. I., Clasen J. W., et al., 1998, ApJ, 501, L5
- [Byun & Freeman 1995] Byun Y. I., Freeman K. C., 1995, ApJ, 448, 563
- [Chae & Turnshek 1999] Chae K., Turnshek D. A., 1999, ApJ, 514, 587
- [Chae 2002] Chae K.-H., 2002, MNRAS, submitted (astro-ph/0211244)
- [Chiba 2002] Chiba M., 2002, ApJ, 565, 17
- [Christian, Crabtree, & Waddell 1987] Christian C. A., Crabtree D., Waddell P., 1987, ApJ, 312, 45
- [Dalal & Kochanek 2002] Dalal N., Kochanek C. S., 2002, ApJ, 572, 25
- [de Zeeuw, Bureau, Emsellem, Bacon, Marcella Carollo, Copin, Davies, Kuntschner, Miller, Monnet, Peletier, & Verolme 2002] de Zeeuw P. T., Bureau M., Emsellem E., Bacon R., Marcella Carollo C., Copin Y., Davies R. L., Kuntschner H., et al., 2002, MNRAS, 329, 513
- [Falco, Lehar, Perley, Wambsganss, & Gorenstein 1996] Falco E. E., Lehar J., Perley R. A., Wambsganss J., Gorenstein M. V., 1996, AJ, 112, 897
- [Fassnacht, Blandford, Cohen, Matthews, Pearson, Readhead, Womble, Myers, Browne, Jackson, Marlow, Wilkinson, Koopmans, de Bruyn, Schilizzi, Bremer, & Miley 1999] Fassnacht C. D., et al., 1999, AJ, 117, 658
- [Fassnacht & Lubin 2002] Fassnacht C. D., Lubin L. M., 2002, AJ, 123, 627
- [Ferguson & Clarke 2001] Ferguson A. M. N., Clarke C. J., 2001, MNRAS, 325, 781
- [Freedman, Madore, Gibson, Ferrarese, Kelson, Sakai, Mould, Kennicutt, Ford, Graham, Huchra, Hughes, Illingworth, Macri, & Stetson 2001] Freedman W. L., et al., 2001, ApJ, 553, 47
- [Impey, Falco, Kochanek, Lehár, McLeod, Rix, Peng, & Keeton 1998] Impey C. D., Falco E. E., Kochanek C. S., Lehár J., McLeod B. A., Rix H.-W., Peng C. Y., Keeton C. R., 1998, ApJ, 509, 551
- [Irwin, Webster, Hewett, Corrigan, & Jedrzejewski 1989] Irwin M. J., Webster R. L., Hewett P. C., Corrigan R. T., Jedrzejewski R. I., 1989, AJ, 98, 1989
- [Jackson, Nair, Browne, Wilkinson, Muxlow, de Bruyn, Koopmans, Bremer, Snellen, Miley, Schilizzi, Myers, Fassnacht, Womble, Readhead, Blandford, & Pearson 1998] Jackson N., et al., 1998, MNRAS, 296, 483
- [Keeton, Kochanek, & Seljak 1997] Keeton C. R., Kochanek C. S., Seljak U., 1997, ApJ, 482, 604
- [Keeton, Gaudi, & Petters 2002] Keeton C. S., Gaudi B. S., Petters A. O., 2002, ApJ, submitted (astro-ph/0210318)
- [Kelson, Illingworth, van Dokkum, & Franx 2000] Kelson D. D., Illingworth G. D., van Dokkum P. G., Franx M., 2000, ApJ, 531, 137
- [Kneib, Alloin, Mellier, Guilloteau, Barvainis, & Antonucci 1998] Kneib J. P., Alloin D., Mellier Y., Guilloteau S., Barvainis R., Antonucci R., 1998, A&A, 329, 827
- [Kochanek 2003] Kochanek C. S., 2003, ApJ, 583, 49
- [Koopmans, de Bruyn, & Jackson 1998] Koopmans L. V. E., de Bruyn A. G., Jackson N., 1998, MNRAS, 295, 534
- [Koopmans, de Bruyn, Xanthopoulos, & Fassnacht 2000] Koopmans L. V. E., de Bruyn A. G., Xanthopoulos E., Fassnacht C. D., 2000, A&A, 356, 391
- [Koopmans, & Treu 2003] Koopmans L. V. E., Treu T., 2003, ApJ, 583, 606
- [Kundić, Hogg, Blandford, Cohen, Lubin, & Larkin 1997] Kundić T., Hogg D. W., Blandford R. D., Cohen J. G., Lubin L. M., Larkin J. E., 1997a, AJ, 114, 2276
- [Kundić, Turner, Colley, Gott, Rhoads, Wang, Bergeron, Gloria, Long, Malhotra, & Wambsganss 1997] Kundi’c T., Turner E. L., Colley W. N., Gott J. R. I., Rhoads J. E., Wang Y., Bergeron L. E., Gloria K. A., et al., 1997b, ApJ, 482, 75
- [Lewis & Bridle 2002] Lewis A., Bridle S. L., 2002, Phys. Rev. D, 66, 10
- [Lehar et al. 2000] Lehár J., Falco E. E., Kochanek C. S., McLeod B. A., Muñoz J. A., Impey C. D., Rix H.- W., Keeton C. R., et al., 2000, ApJ, 536, 584
- [Maller, Flores, & Primack 1997] Maller A. H., Flores R. A., Primack J. R., 1997, ApJ, 486, 681
- [Mao, Mo, & White 1998] Mao S., Mo H. J., White S. D. M., 1998, MNRAS, 297, L71
- [Mao & Schneider 1998] Mao S., Schneider P., 1998, MNRAS, 295, 587
- [Metcalf & Madau 2001] Metcalf R. B., Madau P., 2001, ApJ, 563, 9
- [Metcalf & Zhao 2002] Metcalf R. B., Zhao H., 2002, ApJ, 567, L5
- [Mo, Mao, & White 1998] Mo H. J., Mao S., White S. D. M., 1998, MNRAS, 295, 319
- [Möller & Blain 1998] Möller O., Blain A. W., 1998, MNRAS, 299, 845
- [Möller & Blain 2001] Möller O., Blain A. W., 2001, MNRAS, 327, 339
- [Möller, Natarajan, Kneib, & Blain 2002] Möller O., Natarajan P., Kneib J., Blain A. W., 2002, ApJ, 573, 562
- [Moriondo, Giovanardi, Hunt 1998] Moriondo G., Giovanardi C., Hunt L. K., 1998, A&A, 319, 409
- [Moore, Ghigna, Governato, Lake, Quinn, Stadel, & Tozzi 1999] Moore B., Ghigna S., Governato F., Lake G., Quinn T., Stadel J., Tozzi P., 1999, ApJ, 524, L19
- [Moustakas & Metcalf 2003] Moustakas L. A., Metcalf R. B., 2003, MNRAS, 339, 607
- [Naab & Burkert 2001] Naab T., Burkert A., 2001, ApJ, 555, L91
- [Natarajan, Kneib, Smail, Ellis] Natarajan P., Kneib J.-P., Smail I., Ellis R. S., 1998, ApJ, 499, 600
- [Patnaik, Kemball, Porcas, & Garrett 1999] Patnaik A. R., Kemball A. J., Porcas R. W., Garrett M. A., 1999, MNRAS, 307, L1
- [Putman, de Heij, Staveley-Smith, Braun, Freeman, Gibson, Burton, Barnes, Banks, Bhathal, de Blok, Boyce, Disney, Drinkwater, Ekers, Henning, Jerjen, Kilborn, Knezek, Koribalski, Malin, Marquarding, Minchin, Mould, Oosterloo, Price, Ryder, Sadler, Stewart, Stootman, Webster, & Wright 2002] Putman M. E., et al., 2002, AJ, 123, 873
- [Quadri, Möller, & Natarajan 2002] Quadri R., Möller O., Natarajan P., 2002, ApJ, submitted
- [Rest, van den Bosch, Jaffe, Tran, Tsvetanov, Ford, Davies, & Schafer 2001] Rest A., van den Bosch F. C., Jaffe W., Tran H., Tsvetanov Z., Ford H. C., Davies J., Schafer J., 2001, AJ, 121, 2431
- [Rix & White 1990] Rix H.-W., White S. D. M., 1990, ApJ, 362, 52
- [Rix 1991] Rix H.-W., 1991, Ph.D. Thesis
- [Romanowsky & Kochanek 1997] Romanowsky A. J., Kochanek C. S., 1997, MNRAS, 287, 35
- [Rusin & Tegmark 2001] Rusin D., Tegmark M., 2001, ApJ, 553, 709
- [Saha, Sandage, Tammann, Dolphin, Christensen, Panagia, Macchetto] Saha A., Sandage A., Tammann G. A., Dolphin A. E., Christenses J., Panagia N., Macchetto F. D., 2001, ApJ, 562, 314
- [Scorza & Bender 1995] Scorza C., Bender R., 1995, A&A, 293, 20
- [Scorza, Bender, Winkelmann, Capaccioli, & Macchetto 1998] Scorza C., Bender R., Winkelmann C., Capaccioli M., Macchetto D. F., 1998, A&A Supp, 131, 265
- [Simard, Koo, Faber, Sarajedini, Vogt, Phillips, Gebhardt, Illingworth, & Wu 1999] Simard L., Koo D. C., Faber S. M., Sarajedini V. L., Vogt N. P., Phillips A. C., Gebhardt K., Illingworth G. D., et al., 1999, ApJ, 519, 563
- [Somerville & Primack 1999] Somerville R. S., Primack J. R., 1999, MNRAS, 310, 1087
- [Steinmetz & Müller 1995] Steinmetz M., Müller E., 1995, MNRAS, 276, 549
- [Tonry 1998] Tonry J. L., 1998, AJ, 115, 1
- [Tran, Tsvetanov, Ford, Davies, Jaffe, van den Bosch, & Rest 2001] Tran H. D., Tsvetanov Z., Ford H. C., Davies J., Jaffe W., van den Bosch F. C., Rest A., 2001, AJ, 121, 2928
- [Tran, Simard, Illingworth, & Franx, 2003] Tran K.-V., Simard L., Illingworth G., Franx M., 2003, ApJ, in press, astro-ph/0302292
- [Treu & Koopmans 2002] Treu T., Koopmans L. V. E., 2002, MNRAS, 337, 6
- [van Dokkum & Stanford 2001] van Dokkum P. G., Stanford S. A., 2001, ApJ, 562, L35
- [Vanderriest, Wlerick, Lelievre, Schneider, Sol, Horville, Renard, & Servan 1986] Vanderriest C., Wlerick G., Lelievre G., Schneider J., Sol H., Horville D., Renard L., Servan B., 1986, A&A, 158, L5
- [Woźniak, Alard, Udalski, Szymański, Kubiak, Pietrzyński, & Zebruń 2000] Woźniak P. R., Alard C., Udalski A., Szymański M., Kubiak M., Pietrzyński G., Zebruń K., 2000, ApJ, 529, 88
- [Yee & Bechtold 1996] Yee H. K. C., Bechtold J., 1996, AJ, 111, 1007
Appendix A Galaxies in CL 1358+62
All the galaxies for which Kelson et al. (2000) provides surface brightness profile information are employed in our calculation of certain statistical properties, like the high magnification cross sections in §4.2. For completeness, we present here the surface brightness profile parameters for all the galaxies.
| Bulge only | Bulge and disc | |||||||||||||
|---|---|---|---|---|---|---|---|---|---|---|---|---|---|---|
| No. | Type | |||||||||||||
| 212 | E | 20.780 | 0.683 | 0.488 | 1.220 | 21.170 | 0.781 | 0.340 | 18.030 | 0.031 | 6.138 | 1.160 | 0.808 | 0.960 |
| 242 | E | 21.920 | 1.529 | 0.171 | 1.360 | 22.420 | 1.825 | 0.108 | 20.720 | 0.156 | 0.515 | 1.270 | 0.806 | 0.950 |
| 256 | E | 20.880 | 1.380 | 0.445 | 2.330 | 21.200 | 1.551 | 0.331 | 18.000 | 0.053 | 6.310 | 2.260 | 0.836 | 0.967 |
| 303 | E | 20.590 | 0.638 | 0.581 | 1.270 | 21.110 | 0.774 | 0.360 | 18.890 | 0.054 | 2.780 | 1.210 | 0.787 | 0.947 |
| 360 | E | 20.220 | 0.341 | 0.817 | 2.176 | 21.660 | 0.594 | 0.217 | 17.620 | 0.030 | 8.954 | 1.000 | 0.565 | 0.867 |
| 375 | E | 22.860 | 4.979 | 0.072 | 2.650 | 23.010 | 5.267 | 0.063 | 19.220 | 0.096 | 2.051 | 2.870 | 0.800 | 0.984 |
| 409 | E | 21.270 | 0.498 | 0.310 | 2.176 | 21.490 | 0.542 | 0.254 | 22.600 | 0.132 | 0.091 | 0.660 | 0.959 | 0.969 |
| 412 | E | 21.390 | 0.767 | 0.278 | 2.176 | 22.320 | 1.091 | 0.118 | 17.660 | 0.033 | 8.630 | 0.870 | 0.502 | 0.908 |
| 531 | E | 21.260 | 1.549 | 0.313 | 2.090 | 21.710 | 1.830 | 0.207 | 19.300 | 0.108 | 1.905 | 1.980 | 0.772 | 0.954 |
| 534 | E | 21.210 | 0.620 | 0.328 | 0.860 | 22.170 | 0.878 | 0.136 | 16.680 | 0.019 | 21.281 | 0.770 | 0.489 | 0.901 |
| 536 | E | 21.180 | 1.266 | 0.337 | 1.790 | 21.520 | 1.433 | 0.247 | 18.570 | 0.057 | 3.733 | 1.720 | 0.807 | 0.965 |
| 233 | E/S0 | 20.400 | 0.784 | 0.692 | 1.740 | 20.940 | 0.952 | 0.421 | 18.740 | 0.067 | 3.192 | 1.640 | 0.796 | 0.947 |
| 269 | E/S0 | 20.390 | 0.962 | 0.698 | 2.150 | 20.620 | 1.045 | 0.565 | 18.710 | 0.055 | 3.281 | 2.100 | 0.905 | 0.976 |
| 309 | E/S0 | 20.020 | 0.502 | 0.982 | 1.370 | 20.210 | 0.540 | 0.824 | 18.910 | 0.036 | 2.729 | 1.000 | 0.913 | 0.979 |
| 353 | E/S0 | 21.050 | 1.120 | 0.380 | 1.710 | 21.240 | 1.205 | 0.319 | 19.970 | 0.079 | 1.028 | 1.680 | 0.902 | 0.979 |
| 381 | E/S0 | 20.340 | 0.512 | 0.731 | 2.176 | 20.500 | 0.550 | 0.631 | 20.020 | 0.052 | 0.982 | 1.000 | 0.924 | 0.979 |
| 493 | E/S0 | 19.980 | 0.193 | 1.019 | 0.540 | 21.660 | 0.374 | 0.217 | 18.740 | 0.035 | 3.192 | 0.480 | 0.549 | 0.838 |
| 095 | S0 | 20.940 | 0.704 | 0.421 | 1.150 | 21.840 | 0.986 | 0.184 | 17.750 | 0.038 | 7.943 | 1.040 | 0.583 | 0.912 |
| 135 | S0 | 20.450 | 0.418 | 0.661 | 0.900 | 20.870 | 0.490 | 0.449 | 18.010 | 0.023 | 6.252 | 0.870 | 0.817 | 0.956 |
| 182 | S0 | 20.460 | 0.355 | 0.655 | 0.760 | 20.770 | 0.392 | 0.492 | 21.910 | 0.130 | 0.172 | 0.740 | 0.941 | 0.945 |
| 211 | S0 | 20.120 | 0.448 | 0.895 | 1.160 | 20.410 | 0.458 | 0.685 | 21.680 | 0.256 | 0.213 | 1.120 | 0.921 | 0.873 |
| 215 | S0 | 20.660 | 0.457 | 0.545 | 2.176 | 21.770 | 0.700 | 0.196 | 16.950 | 0.022 | 6.596 | 0.790 | 0.524 | 0.889 |
| 236 | S0 | 21.100 | 0.776 | 0.363 | 1.150 | 21.630 | 0.944 | 0.223 | 17.870 | 0.033 | 7.112 | 1.080 | 0.711 | 0.946 |
| 298 | S0 | 19.690 | 0.554 | 1.330 | 1.810 | 20.840 | 0.835 | 0.461 | 19.530 | 0.142 | 1.542 | 1.630 | 0.735 | 0.873 |
| 300 | S0 | 19.840 | 0.453 | 1.159 | 2.176 | 20.530 | 0.584 | 0.614 | 18.660 | 0.055 | 3.436 | 1.280 | 0.789 | 0.932 |
| 343 | S0 | 20.540 | 0.404 | 0.608 | 0.830 | 21.100 | 0.492 | 0.363 | 20.930 | 0.098 | 0.425 | 0.780 | 0.879 | 0.935 |
| 359 | S0 | 20.260 | 0.574 | 0.787 | 1.380 | 21.050 | 0.769 | 0.380 | 19.050 | 0.072 | 2.399 | 1.270 | 0.748 | 0.923 |
| 408 | S0 | 19.820 | 0.382 | 1.180 | 1.160 | 20.660 | 0.523 | 0.545 | 18.860 | 0.057 | 2.858 | 1.080 | 0.755 | 0.915 |
| 410 | S0 | 20.670 | 0.488 | 0.540 | 0.930 | 21.130 | 0.575 | 0.353 | 20.840 | 0.093 | 0.461 | 0.880 | 0.886 | 0.951 |
| 463 | S0 | 20.430 | 0.639 | 0.673 | 2.176 | 20.740 | 0.714 | 0.506 | 21.180 | 0.136 | 0.337 | 1.350 | 0.926 | 0.965 |
| 481 | S0 | 20.250 | 0.260 | 0.794 | 2.176 | 20.760 | 0.157 | 0.497 | 20.650 | 0.166 | 0.550 | 1.000 | 0.521 | 0.351 |
| 110 | S0/a | 19.450 | 0.350 | 1.660 | 1.300 | 18.360 | 0.102 | 4.529 | 20.120 | 0.248 | 0.895 | 1.000 | 0.722 | 0.363 |
| 129 | S0/a | 19.930 | 0.489 | 1.067 | 1.400 | 20.950 | 0.726 | 0.417 | 16.680 | 0.028 | 21.281 | 1.300 | 0.647 | 0.899 |
| 142 | S0/a | 21.400 | 0.834 | 0.275 | 1.030 | 20.470 | 0.318 | 0.649 | 22.440 | 0.648 | 0.106 | 0.870 | 0.934 | 0.496 |
| 164 | S0/a | 22.620 | 2.251 | 0.090 | 1.250 | 22.920 | 2.541 | 0.068 | 17.770 | 0.036 | 7.798 | 1.230 | 0.616 | 0.966 |
| 292 | S0/a | 20.320 | 0.486 | 0.745 | 1.130 | 20.390 | 0.297 | 0.698 | 21.100 | 0.332 | 0.363 | 1.000 | 0.803 | 0.506 |
| 335 | S0/a | 20.860 | 0.539 | 0.453 | 0.920 | 20.900 | 0.541 | 0.437 | 20.610 | 0.035 | 0.570 | 0.910 | 0.963 | 0.992 |
| 366 | S0/a | 20.790 | 0.630 | 0.483 | 1.120 | 21.160 | 0.718 | 0.344 | 20.460 | 0.083 | 0.655 | 1.070 | 0.882 | 0.963 |
| 369 | S0/a | 21.860 | 1.036 | 0.180 | 0.960 | 21.980 | 1.085 | 0.161 | 20.280 | 0.047 | 0.773 | 0.950 | 0.903 | 0.987 |
| 397 | S0/a | 20.500 | 0.409 | 0.631 | 0.860 | 18.960 | 0.111 | 2.606 | 21.450 | 0.320 | 0.263 | 1.000 | 0.841 | 0.443 |
| 423 | S0/a | 21.610 | 1.021 | 0.227 | 1.110 | 22.460 | 1.397 | 0.104 | 17.950 | 0.043 | 6.607 | 1.000 | 0.515 | 0.918 |
| 440 | S0/a | 22.450 | 1.108 | 0.105 | 0.690 | 22.980 | 1.328 | 0.064 | 18.800 | 0.036 | 3.020 | 0.640 | 0.572 | 0.950 |
| 454 | S0/a | 20.420 | 0.595 | 0.679 | 1.310 | 22.270 | 0.990 | 0.124 | 20.610 | 0.273 | 0.570 | 1.100 | 0.646 | 0.655 |
| 523 | S0/a | 21.640 | 1.044 | 0.221 | 1.110 | 21.960 | 1.171 | 0.164 | 21.080 | 0.117 | 0.370 | 1.070 | 0.882 | 0.968 |
| 209 | Sa | 20.650 | 0.625 | 0.550 | 1.200 | 22.060 | 0.960 | 0.150 | 20.930 | 0.253 | 0.425 | 1.040 | 0.755 | 0.772 |
| 328 | Sa | 20.720 | 0.666 | 0.515 | 1.230 | 21.530 | 0.862 | 0.244 | 21.300 | 0.232 | 0.302 | 1.130 | 0.862 | 0.881 |
| 356 | Sa | 20.200 | 0.604 | 0.832 | 1.500 | 19.780 | 0.392 | 1.225 | 22.070 | 0.533 | 0.149 | 1.420 | 0.939 | 0.749 |
| 368 | Sab | 21.100 | 0.542 | 0.363 | 2.176 | 22.390 | 0.627 | 0.111 | 21.560 | 0.305 | 0.238 | 1.000 | 0.713 | 0.568 |
| 371 | Sa | 21.040 | 0.956 | 0.384 | 1.470 | 20.640 | 0.468 | 0.555 | 21.920 | 0.693 | 0.171 | 1.260 | 0.890 | 0.497 |
| 372 | Sa | 21.920 | 1.435 | 0.171 | 1.280 | 22.720 | 1.905 | 0.082 | 21.990 | 0.351 | 0.160 | 1.150 | 0.877 | 0.909 |
| 465 | Sa | 21.010 | 0.609 | 0.394 | 0.950 | 21.220 | 0.660 | 0.325 | 21.100 | 0.079 | 0.363 | 1.000 | 0.925 | 0.977 |
| 549 | Sab | 21.920 | 0.866 | 0.171 | 0.770 | 19.900 | 0.142 | 1.096 | 22.500 | 0.609 | 0.100 | 0.560 | 0.938 | 0.284 |
| 234 | Sb | 21.860 | 0.996 | 0.180 | 0.920 | 17.800 | 0.035 | 7.586 | 22.030 | 0.621 | 0.154 | 0.520 | 0.903 | 0.094 |