Dark matter within high surface brightness spiral galaxies
Abstract
We present results from a detailed dynamical analysis of five high surface brightness, late type spiral galaxies NGC 3810, NGC 3893, NGC 4254, NGC 5676, and NGC 6643 which were studied with the aim to quantify the luminous-to-dark matter ratio inside their optical radii. The galaxies’ stellar light distribution and gas kinematics have been observed and compared to hydrodynamic gas simulations which predict the gas dynamics arising in response to empirical gravitational potentials, which are combinations of differing stellar disk and dark halo contributions. The gravitational potential of the stellar disk was derived from near-infrared photometry, color-corrected to yield a constant stellar mass-to-light ratio (M/L); for the dark halo, the mass density distribution of an axisymmetric isothermal sphere with a core was chosen. Hydrodynamic gas simulations were performed for each galaxy for a sequence of five different mass fractions of the stellar disk and for a wide range of spiral pattern speeds. These two parameters mainly determine the modelled gas distribution and kinematics. The agreement between the simulated and observed gas kinematics permitted us to conclude that the galaxies with the highest rotation velocities tend to possess very massive stellar disks which dominate the gas dynamics within the optical radius. In less massive galaxies, with a maximal rotation velocity of 200 km s-1, the mass of the dark halo at least equals the stellar mass within 2 – 3 disk scale lengths. The maximal disk stellar mass-to-light ratio in the -band was found to lie at about M/L. Furthermore, the gas dynamic simulations provide a powerful tool to accurately determine the dominant spiral pattern speed for galaxies, independent of a specific density wave theory. It was found that the location of the corotation resonance falls into a narrow range of around three exponential disk scale lengths for all galaxies from the sample. The corotation resonance encloses the strong part of the stellar spiral in all cases. Based on the experience gained from this project, the use of a color-correction to account for local stellar population differences is strongly encouraged when properties of galactic disks are studied that rely on their stellar mass distributions.
1 INTRODUCTION
Much evidence has accumulated in recent years that the stellar disks of high surface brightness spiral galaxies dominate the mass budget of the inner regions. Most of the studies arguing for a maximal disk scenario, are based on the detailed analysis of high resolution rotation curve measurements (Blais-Ouellette et al., 1999; Palunas & Williams, 2000; Ratnam & Salucci, 2000; Salucci, 2001). These studies, however, generally derive the rotational support of the stellar disk from an axisymmetric disk mass model and allow no consideration of non-circular rotation components. More sophisticated modelling strategies have been applied to spiral galaxies with variable significance (Erickson, Gottesman, & Hunter, 1999; Pignatelli et al., 2001). For the most part those studies also support heavy disks for high surface brightness galaxies, but they also find candidates for which lower disk mass fractions are more likely. The most convincing direct arguments for the maximal disk scenario come from the studies of strong bars in spiral galaxies. These features induce a strong dynamic trace in the velocity field and provide a good laboratory for estimating the stellar mass component. Based on fluid dynamic modelling, a maximal disk solution is found by Englmaier & Gerhard (1999) for the Milky Way and by Weiner, Sellwood, & Williams (2001) for NGC 4123. Furthermore, theoretical considerations hint for the requirement of a non-massive halo contribution in the central regions of strongly barred galaxies with a very cold disk, because otherwise dynamical friction would slow down the bar very quickly, leading to its destruction Debattista & Sellwood (1998, 2000). On the other hand, for initially hotter disks, this effect is largely reduced Athanassoula (2002) and references therein.
However, there is also evidence that even high surface brightness spiral galaxies might be dominated by the dark matter mass component in their central disk regions as suggested by high resolution simulations of cosmological dark matter halos (Moore et al., 1999a; Ghigna et al., 2000; Fukushige & Makino, 2001, e.g.). Bottema (1997) inferred from stellar velocity dispersions in spiral galaxy disks that a more massive halo component is needed to explain the findings. There are recent studies that argue for lighter disk models by making use of previously hardly exploited relations. Courteau & Rix (1999) applied a statistical Tully-Fisher relation analysis to a large sample of galaxies trying to relate the maximal rotation velocity of a galaxy to its disk size. Maller, Simard, & Guhathakurta (2000), and more recently Trott & Webster (2002) used the geometry of gravitationally lensed systems to disentangle the effects of the stellar disk and the halo masses. These groups found that the dark halo also dynamically plays an important role in the galaxies’ inner regions.
In the present study, we quantify the relative mass fractions of the stellar disk and the inner dark halo by analyzing the non-axisymmetric force component in the gravitational force field that arises in response to the spiral structure of the observable stellar mass distribution. We address this issue by exploring the influence of the spiral arms on the gas velocity field that builds up in response to the total gravitational potential of the galaxy. We model the gravitational potential from a mass map of the stellar distribution and a dark halo model. With the use of hydrodynamical gas simulations, we predict the gas velocity fields for different empirical mass models of the sample galaxies, assembled from a variety of stellar disk and dark matter mass components. The two parameters that dominate the resulting forces in the disk are the stellar disk mass contribution and the pattern speed of the stellar spiral, . Thus, in this study we explore the effects of those parameters and compare the simulated gas morphology and velocity wiggles with our observations, enabling the identification of the best fitting scenario for each individual galaxy. Comparable studies have been applied to barred spiral galaxies taking advantage of the strong dynamical trace of the bar in the velocity field (Weiner, Sellwood, & Williams, 2001).
First results from our study have been presented already in Kranz, Slyz, & Rix (2001), (hereafter, KSR01) for NGC 4254 where it was proven that this strategy yields valuable information which allows us to constrain disk and halo fractions also for spiral galaxies without a strong bar. In the present paper we only briefly discuss the modelling and comparison strategies involved (Section 2) but instead focus on the conclusions of the analysis. More details about the modelling issues can be found in KSR01, Slyz, Kranz, & Rix (2003) and Kranz (2002).
2 OBSERVING AND MODELLING THE SAMPLE GALAXIES
For the studied galaxies we collected near-infrared (NIR) photometry as the basis to study the luminous mass distribution and gas emission line (H) spectroscopy to acquire kinematic information for the systems. The NIR images were taken during two observing runs in May 1999 and March 2000 with the Omega Prime camera at the Calar Alto 3.5 m’s prime focus (Bizenberger et al., 1998). It provides a field of view of 676 676 with a resolution of 03961 per pixel. We used the K′filter which has a central wavelength of 2.12 ¯m. We obtained the gas kinematics from longslit spectroscopy measurements of the H emission. With the setup we used, the TWIN spectrograph that is located at the cassegrain focus of the Calar Alto 3.5 m telescope achieved a spectral resolution of 0.54 Å per detector pixel, which translates to LOS-velocity resolution per pixel, allowing us to determine LOS-velocities with precision. We sampled the velocity field of the galaxy along 14 or 16 slit position angles. The slit of the TWIN spectrograph measures 4′ 15 on the sky. The spectra were obtained during three observing runs in June 1999, May and December 2000.
The modelling procedure involved four separate steps. First, a stellar mass map had to be derived for each galaxy from the NIR images, as the basis to calculate the gravitational disk potential. Then, a parameterized dark matter component had to be added to the stellar mass component, constrained to render the observed rotation curve of the galaxy. In a third step we carried out two-dimensional hydrodynamical gas simulations in these gravitational potentials, modelling the gas density distribution and the gas velocity field. Finally, these models needed to be compared to the observations to draw conclusions about the galaxies’ structure. This detailed analysis was performed for the four galaxies NGC 3810 (catalog ), NGC 3893 (catalog ), NGC 5676 (catalog ) and NGC 6643 (catalog ), following KSR01. We included NGC 4254 (catalog ) in the final analysis, which was published in KSR01.
2.1 Constructing the stellar mass maps
For the first step, converting the stellar light map into a stellar surface mass map of unknown stellar M/L, we used color-corrected NIR photometry, applying a correction recipe provided by Bell & de Jong (2001). Bell & de Jong showed, based on population synthesis models and the assumption of a universal initial mass function, that a galaxy’s color is tightly correlated to its mass-to-light ratio. This applies to a galaxy’s global color as well as to local colors, and is approximately true, regardless of whether the color changes are due to dust, age, or metallicity differences. The color–M/L relation can be employed to improve the estimate of the stellar surface mass density distribution, , of galaxies taken from the measured NIR surface brightness, , by using color maps of the galaxy:
| (1) |
for the example of color maps. The optical images that were required to determine the galaxy colors were taken from the literature (see Table 1). Although this correction is physically motivated, it relies on empirical constants and 111The constant combines both empirical parameters and ones that are specific to the particular galaxy that is studied: , where is the empirical constant and is the surface brightness of 1 M⊙ at the galaxy’s physical distance. determined from numerical studies. Following Bell & de Jong (2001, Table 1), we used and values for , depending on the galaxies’ physical distances.
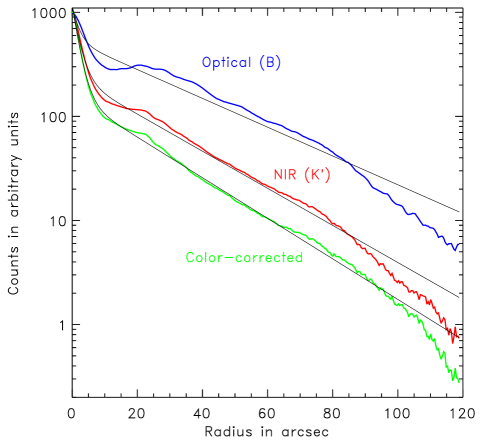
When applied to our sample galaxies, this color correction (Eqn. 1) had two major consequences. First, the radial disk scale length shortened from the K-band image to the color corrected stellar mass image. Second, the detailed two dimensional distribution changed by attenuating or enhancing different azimuthal light features in the disk. Figure 1 illustrates how the color correction affects the radial light distribution of NGC 6643. The steepening of the radial profile is due to the overall color gradients within the disk. Interestingly, the color correction also diminishes the deviation of the stellar profile from an exponential disk, which in the stellar light appear in part caused by different stellar populations. Despite the color correction, the derived mass map still may bear some systematic uncertainties for NGC 5676 and NGC 6643, because these galaxies are classified as starburst galaxies. The correction (Eqn. 1) need not be a good approximation in this regime.
The color correction not only applies to population differences, but also works for moderate dust absorption (). Dust makes the stellar radiation dimmer and redder. To first order, this is accounted for by Eqn. 1, with similar constants. Eventually, even in the -band, which is usually considered as quite a good estimate of the stellar mass distribution, the color correction changes the radial scale length of a galaxy by about 10 %. Consequently, this causes the inferred radial force components in the disk to change their magnitude, affecting the shape of the rotation curve. The use of more than only two colors for the correction, could further improve the quality of the mass density distribution that can be derived. Besides this color correction, several other minor procedures (e.g., spatial filtering) have been applied to the -band images. They were described in more detail in KSR01 and Kranz (2002).
2.2 Gravitational potentials and hydrodynamic models
In order to derive total gravitational potentials, , for the galaxies, a maximal stellar M/L was chosen for the disk, which corresponds to a maximal stellar potential contribution, . For five different values of the stellar M/L, parameterized by a disk fraction , the total gravitational potential of the galaxy was assembled by adding the potential of a dark halo component, constrained to match the observed rotation curve of the galaxy. For the dark halo, the mass density distribution of an axisymmetric isothermal sphere with a core was chosen. Its gravitational potential, , was also calculated in the two-dimensional plane of each galaxy’s disk:
| (2) |
with and 1. Finally, a fixed pattern speed was chosen to represent the dominant spiral feature, leading to centrifugal and coriolis forces in the simulations.
The hydrodynamic simulations were performed using the Bhatnagar-Gross-Krook (BGK) hydro-code, of Adrianne Slyz. This is an Eulerian, grid based hydrodynamics code which is derived from gas kinetic theory. Its concept and performance is well documented in Xu (1998), Slyz (1998), Slyz & Prendergast (1999), Slyz et al. (2002). The gas density distributions and gas velocity fields resulting from these simulations were compared to the observed galaxy morphologies and to the measured H II kinematics (see Kranz 2002 for modelling and comparison details). The evaluation of the data match let us probe both the relative luminous-to-dark matter fractions for the sample galaxies and the pattern speed of the spiral structure.
3 RESULTS FROM THE ANALYSIS
For the discussion of the results we also include the findings for the spiral galaxy NGC 4254 which was studied with the same approach and has been presented in KSR01. In light of this, our sample consists of five high surface brightness spiral galaxies for which we discuss the modelling results in a common context.
3.1 Disk dynamics
The secular evolution of spiral structures in disk galaxies is not yet fully understood. The debate is about whether spirals arise from quasi-stationary, self-sustained density waves, or if they are transient features, triggered by internal or external processes, that fade away unless continuously replenished (Athanassoula, 1984, for a review). The present study is not very dependent on the long-term evolution of the spiral. The gravitational potentials used for the modelling are calculated from the morphological “snapshot” that the measurements provide and the potentials were not allowed to evolve during the simulation process. To achieve a steady state flow in the simulations we needed to adopt a spatially and temporally constant pattern speed for the dominant spiral structure. The good qualitative match of observed and simulated morphology in our sample suggests that in the end this approximation might not be far off. Furthermore, it must be noted that the modelling only requires that the spiral morphology is stable over about one dynamical period, the time required for the gas to adjust to moderate changes in the pattern speed. Aside from some subtle evidence that weak central bars of our sample galaxies reveal pattern speeds that are decoupled from the rest of the disk, the rigid spiral pattern assumption seems to be consistent for most of the disks studied here. To avoid confusion with possible effects of these weak central bars, we exclude in such cases the very inner parts of the disk from the comparison with the simulations and thus restrict ourselves to the galaxies’ outer disks.
3.1.1 Location of the corotation resonance
If a fixed pattern is a reasonable approximation, the determination of resonance locations within galactic disks is well defined. It has already been proven that such an approach yields valuable information about the disk dynamics of several galaxies, e.g., M 51 Garcia-Burillo, Combes, & Gerin (1993), M 100 Garcia-Burillo, Sempere, & Combes (1994), NGC 7479 (Sempere, Combes, & Casoli, 1995) and M 94 and NGC 3310 (Mulder & Combes, 1996). However, since these studies were mostly dealing with single systems, the results were not put into a more general context.
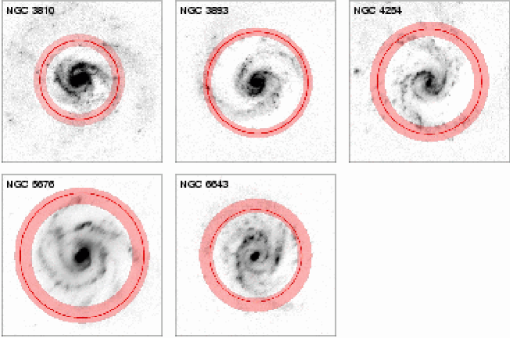
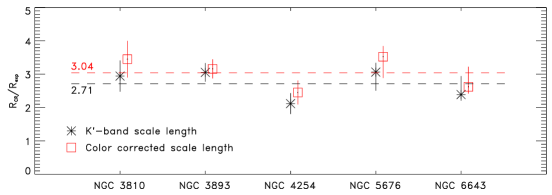
KSR01 showed that it is possible with our modelling approach to locate the corotation resonances with a fairly high precision, by comparing the simulated gas density distributions for different spiral pattern speeds to the observed disk morphology. The decision for the best pattern speed, or equivalently the corotation radius, , was based on a visual match in the morphologies, which accounted for the phase pitch angle and the extent of the spiral arms, as well as for bifurcations. This method appears to be of a qualitative nature, and it might be argued that the pitch angle of the response depends on the velocity dispersion of the gas, in the sense that cold material will form a more tightly wound spiral than the stars. However, comparing the simulated gas response to images of the galaxies taken in optical wavelengths rather than the NIR images, it can be seen that the most dense, shocked regions in the simulations come to lie in fact inside the stellar spirals and tend to coincide with dust lanes, in cases there are some. Furthermore, this approach was supported by the fact that the simulated velocity field for the selected also matches best with the observed rotation curves and less good for other pattern speed assumtions. In this way it is also possible to estimate an uncertainty range. Details of the estimates are given in KSR01 and Kranz (2002). Table 2 compiles the results for the five analyzed galaxies and Figure 2 illustrates the location of the corotation (circle) with its uncertainty range. Figure 3 compares the estimated corotation radii to the disk scale length. Taking the -band exponential disk scale length, the mean ratio of the corotation radius and the disk scale length shows little variation among the objects: , increasing to for the color corrected exponential disk scale lengths. Already from this rather small sample it is possible to outline general trends for spiral galaxies.
First, one can examine the spiral morphologies and how they reflect the dynamical state of the disk. In the modal theory of spiral structure (Bertin et al., 1989a, b) the corotation resonance is typically located in the outer parts of the optical disk, where the gas-to-star density ratio is larger. The stellar spiral should exhibit a basic continuity across the corotation resonance and a reversal of the properties of the spiral tracers, such as the locations of H II-regions (Bertin, 1993). As is apparent from Figure 2, these predictions are only partly satisfied for the galaxies in our sample. On the other hand, some of the galaxies reveal multi-arm or flocculent spiral properties that cannot be explained by linear, quasi-stationary modal theories. Non-linear mechanisms or transient amplification processes might play important roles and affect the location of the corotation resonance, too. The results from non-linear orbital modelling of spiral structures (Patsis, Contopoulos, & Grosbøl, 1991) indicate that the strong, symmetric, logarithmic stellar spirals already end at the inner 4:1 resonance, located well inside the corotation resonance. In their approach, the end of the strong spiral pattern is found at a radial range of 2 – 3 exponential disk scale lengths, which is compatible with a corotation radius of . As seen from Figure 3, the corotation radii from our galaxy sample tend to fall in that range.
Figure 2 compares these corotation radii to the image morphologies. Clearly, the dominant two-arm pattern in these galaxies lies mostly within the corotation resonance. This finding does not disagree with the conclusions of Patsis, Contopoulos, & Grosbøl (1991) and Patsis & Kaufmann (1999), derived from non-linear orbital modelling and N-body simulations respectively. However, the linear modal theory of spiral structure also predicts that the corotation radius falls into the radial range, which was found for the sample galaxies discussed here. Bertin (1993) states . Thus, the locations of the corotation resonances in the sample galaxies are mostly in agreement with the predictions from linear as well as non-linear theories. The good agreement between the measured disk properties and the theoretical expectations from spiral density wave theories can be regarded as support of these theories.
Determining the location of the corotation resonance from hydrodynamic modelling is a rather elaborate and time consuming process. However, looking at Figure 2 it becomes clear that there is no obvious common feature in the galactic disks that would enable an easy identification of the corotation resonance otherwise. It is not always the case that at corotation the star forming rate is largely reduced. Furthermore, there is no characteristic feature in the amplitudes of the low Fourier components at the radius of the corotation resonance. This lack of any reliable corotation tracer complicates the application of density wave theories to real galaxies. Ultimately, the appearance of any real galaxy in the universe is the product of a combination of many processes. In some cases, the linear modal density wave theory can be applied to describe the relevant issues, but in many galaxies non-linear effects in the density wave dynamics and other processes seem to play a role. Nevertheless, assuming a fixed spiral pattern rotation speed seems, to first order, to be a viable assumption for the simulations of gas flows in fixed galaxy potentials. In light of this, it is a very promising conclusion that the hydrodynamic gas simulations provide a powerful tool to learn about disk dynamics and to determine the location of resonances in spiral galaxies.
3.1.2 Quantitative match of the 2D gas kinematics
In addition to the good agreement of the simulated gas density distribution with the disk morphology, the modelled gas velocity fields provide a good overall match to the measured kinematics too. This comparison can be made along the 14 or 16 position angles along which we have long-slit H velocities. Figure 4 gives an example of how good the simulations reproduce individual features in the observed kinematics. Displayed are the rotation curves along three slit positions across the disks of the galaxies NGC 3893, NGC 5676, and NGC 6643. Overlaid are the simulation results from each a maximum disk and a minimum disk model with the best fitting model indicated by the thick line. In all cases, the global structure of the velocity field could be reproduced with satisfying accuracy by the model velocity field. This is a non-trivial result which speaks highly for the quality of the hydrodynamics code.
In order to compare the amplitude of individual wiggles and rotation curve features to the observations, the code was required not only to reproduce global gas dynamics but also to properly model the small scale features. In general, this is also quite well achieved by the simulations, as it can be read from Figure 4. Slyz, Kranz, & Rix (2003) discuss the details of how the positions and amplitudes of features in the simulations depend on our modelling assumptions. However, within the galactic disks, there are processes other than local gravity fluctuations which create additional gas-dynamic effects. The gas dynamic traces of expanding supernova gas shells or outflows from young star forming regions are superimposed on the larger scale response to the gravitational potential wells and may eventually cover up the features that are relevant for this project. In order to minimize the influence of these non-gravitational effects, we used the hydrodynamic simulations – for which the only driving force is gravity – as a reference to discard a fraction of 30 - 40 % from the observed data points that deviate largely from all simulated cases as non-gravitationally induced wiggles. This procedure is explained in more detail in §4.3.2.1. of Kranz (2002). It should be added that with this treatment only local parts of the rotation curves, such as individual wiggles or features near the center, where small bars could play a role, were excluded and that the global coverage of the disk is not sacrificed. Ultimately, it would be desirable to use high sensitivity two dimensional velocity maps to provide a better understanding of the dynamical processes in the disk and to completely eliminate this concern.
Using this technique we find that the agreement between the simulated two dimensional velocity fields and the observed rotation curves is very good also on a wiggle-by-wiggle basis. As an example, this is shown for the averaged rotation curve of NGC 3893 in Figure 5. About 30 % of the data points have been discarded. Although the match of the large wiggle at about 12″ radius is not perfect, the simulated velocity field provides a better general representation of the rotation curve features than any axisymmetric rotation curve model could do.
3.2 Ratio of stellar to dark mass
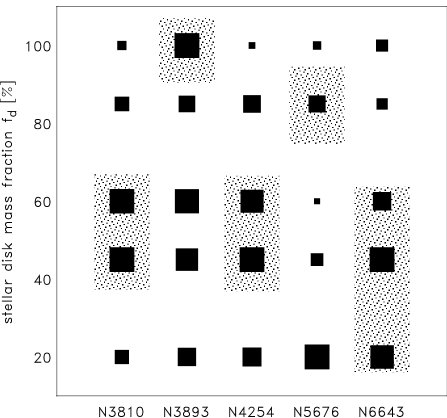
Our main objective was to find the relative stellar disk to dark halo mass fractions from the comparison of modelled gas flows within realistic galaxy gravitational potentials of differing dark and luminous matter composition to observations. The results from the model-to-data comparison is presented in Figure 6 for the five galaxies NGC 3810, NGC 3893, NGC 4254, NGC 5676 and NGC 6643 drawing on a least squares comparison of predicted velocity fields for differing to the observed. The symbol sizes represent the probability – derived from the least squares analysis – that a certain mass model applies to the specific galaxy. The most probable values for the disk mass fraction is indicated by the dotted regions in the plot. Since in some cases a purely formal least squares analysis does not give an unambiguous indication of the mass composition of the galaxy, we have to reexamine the quality of the fit by eye in order to assign a certain disk mass fraction to the specific galaxy. In the cases of NGC 3893 and NGC 5676 this approach supported higher disk mass fraction models (Kranz, 2002). As can be seen from Figure 6, the precision with which a certain scenario can be attributed to a particular galaxy is not equally good for all sample galaxies. For NGC 3893 the disk mass fraction could be estimated quite well, placing this galaxy into the realm of maximum disks. For NGC 3810 and NGC 6643 the least squares comparison mostly argued for a light to medium disk scenario. The analysis for NGC 6643 was especially difficult since this galaxy exhibits only a weak stellar spiral density wave, leading to a larger uncertainty range for the disk mass fraction. The analysis of NGC 4254 suffered from the high abundance of strong non-gravitationally induced gas kinematic features in the observed velocity field, which is apparent from the high abundance of small scale wiggles in the obseved rotation curves. The main conclusion for NGC 4254 was to exclude the strictly maximal disk solution. For NGC 5676 the -analysis mostly argues for a heavy disk scenario, although some simulations suffered from premature terminations. However, as discussed in Kranz (2002), the simulations proceeded to a point where the spiral pattern seemed to have reached a quasi-stationary state, making us confident that the conclusions for this galaxy are quite reliable.
As defined by Sackett (1997), the designation “maximal disk” applies to a galactic disk when % of the total rotational support of a galaxy at a radius R = 2.2 Rexp is contributed by the stellar disk mass component. In the extreme case of , this definition allows a relatively massive halo to almost comprise the same amount of mass as the disk within that radius.
The above definition translates into the notation used here in the following way. The rotational support from the stellar disk is , where is the rotational support from the maximal stellar disk at a radius of 2.2 disk scale lengths. A maximal disk model also includes a halo contribution , with typically 0.9. Accordingly, the rotational support from the disk is about 0.9 ( %), 0.83 ( %), 0.7 ( %), 0.6 ( %), and 0.4 ( %). All of the = 85 % models clearly represent maximal disk scenarios. The = 60 % models are at the lower border of the maximal disk realm, representing compositions with about an equal amount of dark and luminous mass within 2 – 3 exponential disk scale lengths. In light of this, Figure 6 shows that a maximal disk scenario applies to NGC 3893 and NGC 5676. For the other galaxies the results from the modelling favor less massive stellar disks. NGC 3810, NGC 4254 and NGC 6643 possess stellar disks that appear to balance the mass of the dark halo inside the optical disk ( %), although for NGC 6643 an even lighter stellar mass component could not be excluded.
Table 4 gives an overview of the stellar mass-to-light ratios that were derived from the calculations of the potentials. The values are given for a maximum disk and mostly fall in the range between M/LK = 0.6 – 0.7. A smaller value for M/LK was only found for NGC 4254. These stellar mass-to-light ratios agree very well with those emerging from the color correction procedure of Bell & de Jong (2001), which are based on population synthesis models222Bell & de Jong (2001) used an initial mass function that was scaled to a maximal disk scenario, which was established from measured disk kinematics. In light of this, the population synthesis M/Ls also ultimately rely on disk dynamics.. Using these mass-to-light ratios, the total mass of the stellar disk can be inferred. The values given in Table 4 apply to a disk mass fraction which, as taken from Figure 7, is a reasonable assumption for the particular galaxy. These disk masses appear realistic and scale well with the maximal velocities in the rotation curves, i.e. attributing a high disk mass to NGC 5676 and a light disk to NGC 3810. The mismatch for NGC 4254 most likely originates from residual inaccuracies in the determination of the galaxy’s distance, inclination and possible calibration errors due to non-photometric conditions during the data acquisition. The other results for NGC 4254 are only insignificantly affected by possible inaccuracies of these parameters.
4 DISCUSSION
We have presented a new, direct and independent estimate of the stellar mass fraction in a small sample of spiral galaxies. With respect to ratio of luminous and dark matter in their inner parts, the population of high surface brightness spiral galaxies does not seem to comprise an entirely homogeneous class of objects. Combining the maximum rotation velocity, presented in Table 1, with the estimates for the galaxies’ most probable fractions of the stellar disk mass, reveals an intriguing trend: the most massive of the analyzed galaxies, NGC 3893 and NGC 5676, tend to also possess the most massive stellar disks which dominate the dynamics of the central regions. The other galaxies from the sample are less massive systems that exhibit a maximum rotation velocity 200 km s-1. For those objects the total mass of the dark halo within the optical radius is higher and was found to, at least, equal the stellar mass. This trend is graphically presented in Figure 7.
Our results can be compared to Athanassoula, Bosma, & Papaioannou (1987). These authors inferred disk and halo mass fractions from spiral structure constraints. The small points displayed in Figure 7 represent a subsample of the total sample (given in Athanassoula et al. 1987, Table A2), selected for late type galaxies with a bulge mass % and a maximum rotation velocity of more than 100 km s-1. For comparison the stated disk-to-halo mass ratio was converted into our scheme of quantifying the disk mass fraction .
It can be clearly seen that the trend that emerged from our small dataset is supported by the results from Athanassoula, Bosma, & Papaioannou (1987). In this sample there is no late type spiral galaxy with a maximum rotation velocity of over 200 km s-1 that seems to be in agreement with a substantially submaximal stellar disk. For less massive systems this is not the case anymore. Apparently galaxies with a wide range of dark halo and disk mass decompositions can exist and maintain spiral structure.
In light of this, the results from Courteau & Rix (1999) might be explained that in a statistical sample of spiral galaxies the heavy and clearly maximum disk galaxies could account for only a relatively small fraction and most of the “lighter” high surface brightness galaxies exhibit already a considerable dark mass fraction. Indeed, in the Courteau & Rix sample, only roughly a third of the galaxies exhibit maximal rotation velocities 200 km s-1.
However, beyond the discussion of the disk mass fraction in spiral galaxies, at present there is growing evidence that galaxy size dark halos are not cuspy in their centers, as claimed by standard cold dark matter (CDM) models. (Moore, 1994; Flores & Primack, 1994; Moore et al., 1999b; Salucci & Burkert, 2000; Borriello & Salucci, 2001; de Blok et al., 2001; van den Bosch & Swaters, 2001). This circumstance was first found for low surface brightness and dwarf galaxies, that supposedly are comprised of a massive dark halo. Most of the authors argued that this also applies to high surface brightness galaxies. For the present analysis, the functional form of the dark halo profile has only a second order effect on the results as long as the models describe well the overall shape of the observed rotation curves. Thus, we decided not to distinguish between different dark halo profiles. However, the results from this study, which mostly confirm the strong dynamic influence of the stellar disk in massive high surface brightness spiral galaxies within the optical radius, provide very little room for a strongly cusped halo core.
5 SUMMARY
With this project it has been demonstrated that an analysis similar to the one applied to barred galaxies (Englmaier & Gerhard, 1999; Weiner, Sellwood, & Williams, 2001) can also be applied to non-barred spiral galaxies. This application is on one hand more difficult and problematic, since the spiral arms provide a much less prominent dynamical feature in the velocity field than a strong bar does. On the other hand, for pure disk galaxies the vertical scale height is smaller in the central regions than in strong bars that often show peanut shapes when viewed edge-on. This fact reduces systematic uncertainties that arise from motions along the z-axis which are superimposed onto the circular motions that are studied. The main points that could be learned from this study can be summarized in the following way:
-
•
The color correction, described in Section 2.1, allows us to derive the stellar mass density from any multi color imaging data. As a correction to the K-band photometry Equation 1 has proven to work very well. We encourage its use for all studies that depend on the mass distribution in galaxy disks.
-
•
The BGK hydrodynamics code, applied to the problem (Slyz, Kranz, & Rix, 2003), is a powerful tool and it can be used successfully to simulate the interstellar gas in the disks of galaxies. The parameters that dominate the morphology and the kinematics of the gas simulations are the non-axisymmetric stellar mass component and the pattern speed of the spiral structure.
-
•
Adopting a globally fixed pattern speed for the rotation of the spiral seems to be a viable approximation for the simulation process. Moreover, from analyzing the morphology of the simulated gas density distribution it could be found for the sample of five galaxies that the corotation radius , increasing to for the color corrected exponential scale lengths representing the stellar disk mass. In all five cases the strong stellar spiral ends inside the corotation resonance.
-
•
The detailed comparison of the velocity fields is challenging, but it is possible to put constraints on the relative mass fractions of the inner disk. The results from this study indicate that high surface brightness galaxies possess maximal disks if their maximal rotation velocity 200 km s-1. If the maximal rotation velocity is less, the galaxies appear to have submaximal disks.
References
- Athanassoula (1984) Athanassoula, E., 1984, ’The Spiral Structure of Galaxies’. In Physics Reports (Review Section of Physics Letters), Vol 114, Numbers 5 & 6 pp. 319 – 403
- Athanassoula (2002) Athanassoula, E., 2002, ’Formation and evolution of bars in disc galaxies’. In Disks of Galaxies: Kinematics, Dynamics and Perturbations, eds. E. Athanassoula, A. Bosma, & R. Mujica, (San Francisco: ASP), 275, in press. (astro-ph/0209438)
- Athanassoula, Bosma, & Papaioannou (1987) Athanassoula, E., Bosma, A., & Papaioannou, S. 1987, A&A, 179, 23
- Bell & de Jong (2001) Bell, E. F., & de Jong, R. S., 2001, ApJ, 550, 212
- Bertin (1993) Bertin, G. 1993, PASP, 105, 640
- Bertin et al. (1989a) Bertin, G., Lin, C., Lowe, S., & Thurstans, R. 1989a, ApJ, 338, 78
- Bertin et al. (1989b) Bertin, G., Lin, C., Lowe, S., & Thurstans, R. 1989b, ApJ, 338, 104
- Bizenberger et al. (1998) Bizenberger, P., McCaughrean, M., Birk, C., Thompson, D., & Storz, C. 1998, SPIE, 3354, 825
- Blais-Ouellette et al. (1999) Blais-Ouellette, S., Carignan, C., Amram, Ph., & Cté, S. 1999, AJ, 118, 2123
- Borriello & Salucci (2001) Borriello, A., & Salucci, P. 2001, MNRAS, 323, 285
- Bottema (1997) Bottema, R. 1993, A&A, 275, 16
- Courteau & Rix (1999) Courteau S., & Rix H.-W., 1999, ApJ, 513, 561
- Debattista & Sellwood (1998) Debattista V. P., & Sellwood J. A., 1998, ApJ, 493, L5
- Debattista & Sellwood (2000) Debattista V. P., & Sellwood J. A., 2000, ApJ, 543, 704
- de Blok et al. (2001) de Blok, W., McGaugh, S., Bosma, A., & Rubin, V. 2001, ApJ, 552, L23
- Englmaier & Gerhard (1999) Englmaier, P., & Gerhard, O., 1999, MNRAS, 304, 512
- Erickson, Gottesman, & Hunter (1999) Erickson, L. K., Gottesman, S. T., & Hunter, J. H. Jr. 1999, ApJ, 515, 153
- Flores & Primack (1994) Flores, R. A., & Primack, J. R. 1994, ApJ, 427, L1
- Frei et al. (1996) Frei, Z., Guhathakurta, P., Gunn, J. E. , & Tyson, J. A., 1996, AJ, 111, 174
- Fukushige & Makino (2001) Fukushige, T., & Makino, J., 2001, ApJ, 557, 533
- Garcia-Burillo, Combes, & Gerin (1993) Garcia-Burillo, S., Combes, F., & Gerin, M. 1993, A&A, 274, 148
- Garcia-Burillo, Sempere, & Combes (1994) Garcia-Burillo, S., Sempere, M. J., & Combes, F. 1994, A&A, 287, 419
- Ghigna et al. (2000) Ghigna, S., Moore, B., Governato, F., Lake, G., Quinn, T., Stadel, J. 2000, ApJ, 544, 616
- Héraudeau & Simien (1996) Héraudeau, P., & Simien, F. 1996, A&AS, 118, 111
- Kranz (2002) Kranz, T. 2002, PhD thesis, University of Heidelberg, http://www.ub.uni-heidelberg.de/archiv/2214
- Kranz, Slyz, & Rix (2001) Kranz, T., Slyz, A., & Rix, H.-W. 2001, ApJ, 562, 164 (KSR01)
- Maller, Simard, & Guhathakurta (2000) Maller, A., Simard, L., & Guhathakurta, P., et al., 2000, ApJ, 533, 194
- Moore (1994) Moore, B. 1994, Nature, 370, 629
- Moore et al. (1999a) Moore, B., Ghigna, S., Governato, F., et al., 1999a, ApJ, 524, L19
- Moore et al. (1999b) Moore, B., Quinn, T., Governato, F., Stadel, J., & Lake, G. 1999b, MNRAS, 310, 1147
- Mulder & Combes (1996) Mulder, P. S., & Combes, F. 1996, A&A, 313, 723
- Palunas & Williams (2000) Palunas, P., & Williams, T. B. 2000, AJ, 120, 2884
- Patsis, Contopoulos, & Grosbøl (1991) Patsis, P. A., Contopoulos, G., & Grosbøl, P. J., 1991, A&A, 243, 373
- Patsis, Grosbøl, & Hiotelis (1997) Patsis, P. A., Grosbøl, P. J., & Hiotelis, N., 1997, A&A, 323, 762
- Patsis & Kaufmann (1999) Patsis, P. A., & Kaufmann, D. E. 1999, A&A, 352, 469
- Pignatelli et al. (2001) Pignatelli, E., Corsini, E. M., Vega Beltrán, J. C., Scarlata, C., Pizzella, A., Funes, J. G., Zeilinger, W. W., Beckman, J. E., & Bertola, F. 2001, MNRAS, 323, 188
- Prendergast & Xu (1993) Prendergast, K. H., & Xu, K. 1993, J. Comput. Phys., 109, 53
- Ratnam & Salucci (2000) Ratnam, C., & Salucci, P. 2000, New Astronomy, 5, 427
- Sackett (1997) Sackett P., 1997, ApJ, 483, 103
- Salucci (2001) Salucci, P. 2001, MNRAS, 320, L1
- Salucci & Burkert (2000) Salucci, P., & Burkert, A., 2000, ApJ, 537, L9
- Sempere, Combes, & Casoli (1995) Sempere, M. J., Combes, F., & Casoli, F. 1995, A&A, 299, 371
- Slyz (1998) Slyz, A. 1998, PhD thesis, Columbia University, New York
- Slyz et al. (2002) Slyz, A., Devriendt, J., Silk, J., & Burkert, A. 2002, MNRAS, 333, 894
- Slyz, Kranz, & Rix (2003) Slyz, A., Kranz, T., & Rix, H.-W. 2003, MNRAS, in preparation
- Slyz & Prendergast (1999) Slyz, A., & Prendergast, K. H., 1999, A&AS, 139, 199
- Trott & Webster (2002) Trott, C. M., & Webster, R. L. 2002, MNRAS, 334, 621
- Tully et al. (1996) Tully, R. B., Verheijen, M. A. W., Pierce, M. J., Huang, J.-S., & Wainscoat, R. J. 1996, AJ, 112, 2471
- van den Bosch & Swaters (2001) van den Bosch, F. C., & Swaters, R. A. 2001, MNRAS, 325, 1017
- Weiner, Sellwood, & Williams (2001) Weiner, B. J., Sellwood, J. A., & Williams, T. B., 2001, ApJ, 546, 931
- Xu (1998) Xu, K., 1998, Gas-Kinetic Schemes for Unsteady Compressible Flow Simulations, von Karmann Institute Lecture Series, (VKI report 1998-03)


| Galaxy | K′tot | PA | max | dist. | optical | reference | ||
|---|---|---|---|---|---|---|---|---|
| [mag] | [mag] | [°] | [°] | [km s-1] | [Mpc] | image | ||
| NGC 3810 | 11.4 | 8.02 | 22 | 46 | 155 | 13.5 | B | Frei et al. 1996 |
| NGC 3893 | 11.23 | 7.94 | 166 | 42 | 220 | 17 | B | Tully et al. 1996 |
| NGC 4254 | 10.2 | 6.85 | 67.5 | 41.2 | 153 | 20 | g | Frei et al. 1996 |
| NGC 5676 | 11.7 | 8.03 | 46.5 | 63.2 | 245 | 33 | V | Héraudeau & Simien 1996 |
| NGC 6643 | 11.8 | 8.18 | 39 | 57.5 | 185 | 23 | B | Héraudeau & Simien 1996 |
| Galaxy | (′) | (′corr) | |
|---|---|---|---|
| [kpc] | [kpc] | [kpc] | |
| NGC 3810 | 3.15 0.5 | 1.07 | 0.913 |
| NGC 3893 | 5.5 0.5 | 1.80 | 1.74 |
| NGC 4254 | 7.5 1.1 | 3.54 | 3.06 |
| NGC 5676 | 11.0 | 3.59 | 3.12 |
| NGC 6643 | 6.5 | 2.72 | 2.48 |
Note. — All values are calculated for the distance given in Table 1. (′corr) specifies the color corrected exponential scale lengths.
| Galaxy | |||||
|---|---|---|---|---|---|
| NGC 3810 | 0.800 | 0.550 | 0.555 | 0.787 | 1.069 |
| NGC 3893 | 1.775 | 1.555 | 1.480 | 1.897 | 1.451 |
| NGC 4254 | 1.146 | 0.959 | 1.007 | 1.206 | 2.303 |
| NGC 5676 | 0.706 | 1.109 | 1.817 | 0.908 | 1.463 |
| NGC 6643 | 1.400 | 1.349 | 1.651 | 2.284 | 2.183 |
| Galaxy | (M/L | (M/L)color | M | M |
|---|---|---|---|---|
| NGC 3810 | 0.63 | 0.55 | ||
| NGC 3893 | 0.56 | 0.54 | ||
| NGC 4254 | 0.23 | 0.74 | ||
| NGC 5676 | 0.67 | 0.83 | ||
| NGC 6643 | 0.71 | 0.65 |
Note. — Given are the maximal disk -band M/Ls. (M/L corresponds to a stellar mass fraction ; (M/L)color were derived using the relations by Bell & de Jong (2001) for the respective overall galaxy colors. The disk mass M has been scaled for the galaxies’ most probable disk mass fraction . All values are given in solar units.