High Latitude Dust and the 617 MHz - 850 m relation in NGC 5775
Abstract
We present continuum observations of the edge-on spiral galaxy NGC 5775 at 617 MHz with the Giant Metrewave Radio Telescope (GMRT) and at 850 m with the Submillimetre Common-User Bolometer Array (SCUBA) on the James Clerk Maxwell Telescope (JCMT). We report the detection of dust at high-latitudes, extending to about 5 kpc from the disk of the galaxy, and spurs of non-thermal radio emission. The 617 MHz and 850 m distributions are compared with one another and we find a strong correlation between metre wavelength radio emission and sub-mm emission in the disk and at high-latitudes. This suggests that there may be a more fundamental relationship between cold dust and synchrotron radiation other than the link via star formation.
keywords:
galaxies: halo – radio continuum: galaxies – sub-mm: galaxies – galaxies: individual: NGC 57751 Introduction
There is now considerable evidence for galactic halos, thick disks, and discrete connecting features between the disk and the halo in many star-forming spiral galaxies. Such features are best detected directly by observing edge-on galaxies with sufficient sensitivity and spatial resolution. High-latitude (i.e. 1 kpc) emission has now been observed in every interstellar medium (ISM) tracer (cf. Dahlem 1997). NGC 5775 is an example of a galaxy in which every ISM component has been observed at high-latitudes (Lee et al. 2001).
The Infrared Astronomical Satellite (IRAS) data of a sample of spiral galaxies showed the estimated ratio of their gas mass to dust mass, to be about 10 times larger than the average value for the inner region of the Galaxy (Devereux & Young 1990). It was suggested that this could be due to a large amount of cold dust in these galaxies that IRAS was not sensitive to. Observations with good spectral coverage and sensitivity were required to disentangle the warm and cold dust components. The Submillimetre Common-User Bolometer Array (SCUBA) operating on the James Clerk Maxwell Telescope (JCMT), which we have used for this project, allows astronomers to determine the distribution and quantity of such cold dust with high resolution. Currently, only a small number of quiescent and active edge-on spiral galaxies have had their dust distributions mapped using either SCUBA or the IRAM 30-m telescope; these include NGC 891 (Alton et al. 1998), NGC 3079 (Stevens & Gear 2000), NGC 4631 (Neininger & Dumke 1999), NGC 4565 (Neininger et al. 1996), NGC 5907 (Dumke et al. 1997) M82, NGC 253, NGC 4631 (Alton et al. 1999) and now NGC 5775.
In the 1970s a correlation was discovered between mid-infrared (m) and radio (1425 MHz) luminosities from the nuclei of Seyfert galaxies, and later normal spiral galaxies (van der Kruit 1971, 1973; Rieke 1978). In the 1980s the IRAS mission established a universal and tight correlation between the far infrared (FIR) and the radio continuum luminosities of galaxies, (de Jong et al. 1985; Helou et al. 1985). Recently a number of authors have investigated the FIR/radio correlation within the disks of nearby galaxies in an attempt to gather more detailed information on how the correlation works (Beck & Golla 1988; Bicay & Helou 1990, amongst others).
Presently, it is widely believed that the main reason behind the FIR/radio correlation, is that both emissions depend on the same recent star formation activity of that particular galaxy (Condon 1992). That is, hot young stars heat the dust, producing FIR emission, as well as ionize gas and provide a supply of SNe, producing the radio continuum emission. However, the situation may not be so clear cut. For example, in a detailed study of M31, Hoernes, Berkhuijsen & Xu (1998, hereinafter referred to as HBX), reported the discovery of a nonthermal-radio/cool-dust correlation, quite separate from the thermal-radio/warm-dust correlation that is linked through massive ionizing stars. It is worth noting that HBX did not find evidence of a correlation between either non-thermal radio with warm dust, or thermal radio with cool dust. Thermal emission from warm dust is the result of heating from massive stars (), while cool dust could be powered by intermediate mass stars (5-20 ) and the interstellar radiation field. The nonthermal-radio/cool-dust correlation could not be explained through a dependence on the same energy source. HBX suggest a possible scenario involving coupling of gas, cold dust and magnetic fields.
In this paper we present the first detection of high-latitude dust for NGC 5775. Observing with SCUBA, we map the cold dust in the disk and halo. We also present radio continuum observations of the galaxy taken with the Giant Metrewave Radio Telescope (GMRT), which trace largely the non-thermal synchrotron emission. The observations from SCUBA and GMRT are spatially compared with one another in an effort to investigate whether a cold dust/non-thermal radio emission correlation exists in the disk and halo of this galaxy. NGC 5775 is an edge-on spiral galaxy at a distance of 24.8 Mpc (Ho=75 km s-1 Mpc-1), and with an inclination angle of 86∘ (Irwin 1994). NGC 5775 is found on the FIR/radio correlation at log P20cm = 22.32 W Hz-1 and log (LFIR/L⊙) = 10.44. The results in this paper are the first ones of an ongoing project to investigate a possible sub-mm/metre wavelength correlation in the disks and halos of galaxies.
2 Observations and Data Reduction
2.1 Submillimetre
Observations of NGC 5775 were made on 2001 January 4 and 5, at the JCMT using SCUBA. SCUBA images a region of sky simultaneously at 450 and 850 m. Our observations provide fully sampled images by moving the secondary mirror in the 64pt jiggle map mode. We performed pointing checks every hour against a bright source. Skydip measurements were also made to determine the atmospheric transparency by change in elevation (opacity was about 0.27 at 850 m and 1.67 at 450 m). Mars was mapped twice each night for calibration of our source and to determine the beam shape. Our observations of NGC 5775 consisted of three exposures of 45 minutes each over two overlapping fields, since our galaxy is larger than the diameter of the region that the telescope can image.
The software package SURF was used to reduce the SCUBA data. All maps were reduced using typical reduction tasks. SURF was used to clean and flat-field the images. Dirty bolometers were removed and the image noise was reduced using a SURF task which compensated for spatially correlated emission. The pointing drifts were corrected and the images were calibrated using Mars. Finally all the observations were combined into a single map. The resulting map has a resolution of 14.6′′ and an rms noise of 4 mJy/beam.
2.2 Radio Continuum
NGC 5775 was observed with the GMRT on 2000 July 1 and 16 at 617 MHz using a bandwidth of 16 MHz. The GMRT consists of thirty steerable, 45-metre diameter antennas, of which 14 are located randomly in a central 1 km 1 km diameter region referred to as the Central Square. The remaining antennas lie along 3 arms of an approximately ‘Y’ configuration, with each arm extending to a length of about 14 km. This provides coverage for imaging both the compact and extended emission. A more detailed description of the GMRT can be found in Swarup et al. (1991). These observations were made during the commissioning phase of the GMRT and typically 25 to 27 antennas were available for each day. The source was observed on two different days for checking consistency of the images. The primary flux density calibrator was 3C286 while the phase calibrator was 3C298. The total time spent on the source was approximately 120 minutes on each observing day.
The analysis of the data was done using the Astronomical Image Processing System (AIPS) from the National Radio Astronomy Observatory. The data editing itself was done within the AIPS environment using the task UVFLG. However, the identification of bad data was done outside the AIPS environment with algorithms developed by J. Stil in a package called ‘borg’. The borg allows the user to define what constitutes bad data. For our data, borg identified all points that had near zero flux density at each channel for the flux density and phase calibrator. The routine also identified the spikes in the data while observing the calibrators by finding points that deviate more than, approximately 3 sigma from the modal amplitude for a particular baseline, channel and source. If any baseline had a significant number of points flagged, it was subsequently flagged from all sources. The borg package helped to ease the editing of the data because the GMRT did not have any automatic flagging of bad data, including bad antennas at the time of these observations.
The AIPS tasks CALIB, CLCAL and BPASS were used on the flagged data set to calibrate the source. The central 100 channels of the total of 128 channels were used in the analysis. The channels were averaged and Fourier inversion and cleaning were performed on the NGC 5775 data using IMAGR. A series of self-calibration and cleaning procedures were then conducted to produce two maps, one from each day of observations. After determining that the two maps were virtually identical we used the AIPS task DBCON to combine the UV plane data from each observation and produced a final single map to increase our signal-to-noise ratio. Using the brightest source visible in our observation and the rms noise of the map, 0.9 mJy/beam, we calculate a dynamic range of 112. Although the angular resolution using the entire GMRT is approximately 6 arcsec, we have tapered the GMRT images to 14.6′′ to be comparable with the 850 m SCUBA map.
3 Results
3.1 Submillimetre and radio maps
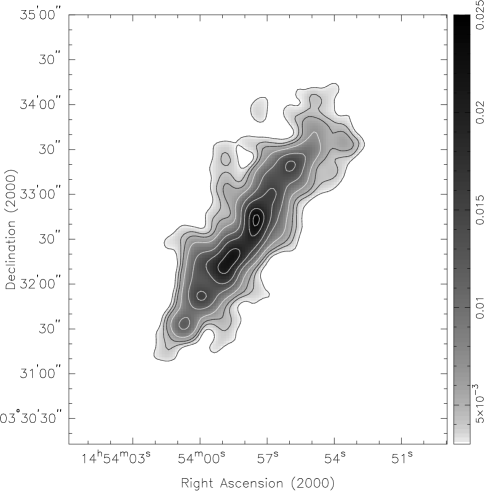
In Fig. 1 we show our final 850 m map of the edge-on spiral galaxy NGC 5775. The 450 m map (not shown) has a very similar disk morphology with poorer signal-to-noise ratio. SCUBA maps of NGC 5775 reveal a bright central source and a number of additional peaks of bright emission, approximately along the disk (Note that the figure-8 outline is an artifact due to combining the data from the two fields used.).
One of the most striking features of the map is the emission that rises from the disk of the galaxy into the halo. Clear evidence of emission is found at large distances from the disk; in three cases at latitudes of about 5 kpc. This is among the farthest from the plane that dust has been detected for any galaxy. Although the signal-to-noise ratio is modest, these features are visible in separate observations on different days, providing supporting evidence of their reality (Brar & Irwin 2002).
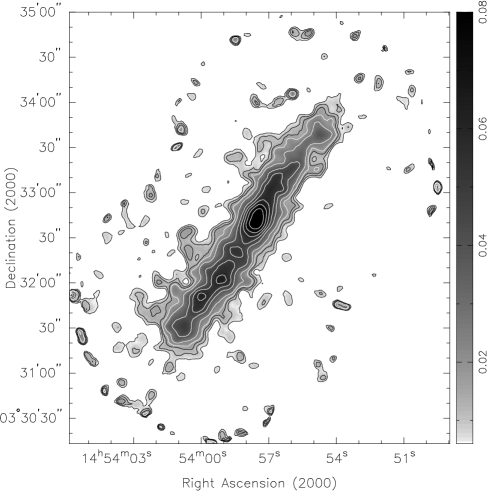
The 617 MHz radio-continuum map of NGC 5775 is presented in Fig. 2. A comparison of the GMRT image with a VLA 1400-MHz image with a similar angular resolution (Lee et al. 2001) shows the emission in the disk to be very similar, but the spurs of emission extending from the disk are more clearly discernible in the 617 MHz image. The disk of NGC 5775 in radio continuum emission is spatially very similar to the SCUBA image shown in Fig. 1. In particular, it possesses a central bright spot and a number of other bright areas of emission along the disk, including a secondary peak towards the lower half of the galaxy.
Radio emission too is detected at high-latitudes. The emission at 617 MHz, which is predominantly non-thermal, is observed above the disk along the entire galaxy, with the high-latitude features being particularly prominent on the northern side of the galaxy axis.
3.2 Comparison of maps
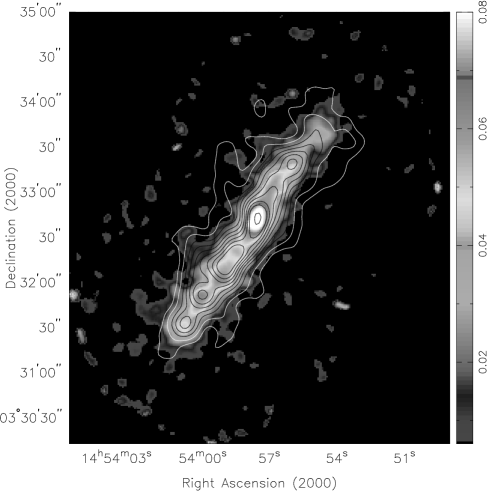
Fig. 3 is an optical image from the Digitized Sky Survey (DSS) with the 850 m contour plot overlayed on it. This overlay demonstrates the large distances that dust is detected away from the optical disk. Within the disk, the brightest regions of sub-mm emission do not correlate with the brightest regions of optical emission. In fact, even the central bright regions are slightly separated. In the southern half of the galaxy, the regions of high optical and dust emission appear to be anti-correlated, as expected if the dust is obscuring starlight.
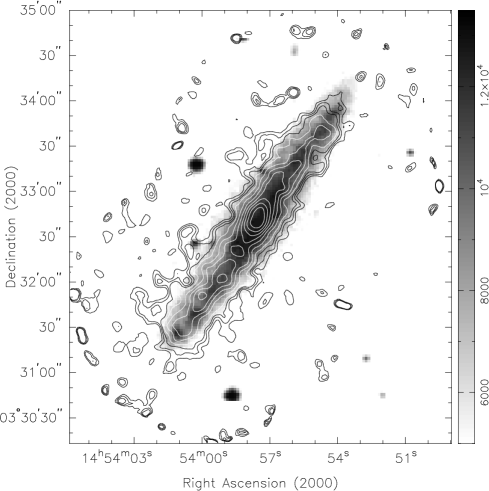
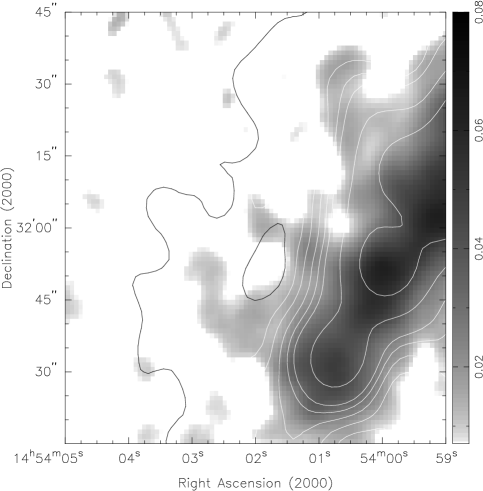
Fig. 4 shows the GMRT map overlayed on the SCUBA map. The spatial correlation of the features in the disk is high. More surprisingly, we also find a similar correlation at high-latitudes. Note that the two lower streams (14h 54m 02s, 3∘ ) in the SCUBA map do have corresponding emission in the GMRT map, but are at lower brightness levels than demonstrated in Fig. 4 and are displayed separately in Fig. 5. In Fig. 5 there is a single black contour level at 1.4 mJy/beam. Thus the contour located between the two features indicates a depression in radio emission.
In Fig. 6 we present z profiles of the JCMT and GMRT maps, both above and below the plane. A fairly typical profile was chosen to demonstrate the separation of the halo and disk, the exact positions of which are given in Fig. 6. Fig. 6 a) and b) profiles indicate evidence for a halo at about 13 arcsec above (north-east) the maximum intensity in the disk. Fig. 6 c) and d) profiles show halo evidence beginning at about 11 arcsec below (south-west) the plane. This translates into, evidence for a halo starting at between 1.32 and 1.56 kpc from the plane of NGC 5775. From these profiles and a galaxy inclination of 86 degrees, we can safely state that the features we are observing reside in the halo and not the disk.
 a) a) |
 b) b) |
 c) c) |
 d) d) |
4 Discussion
4.1 Correlation
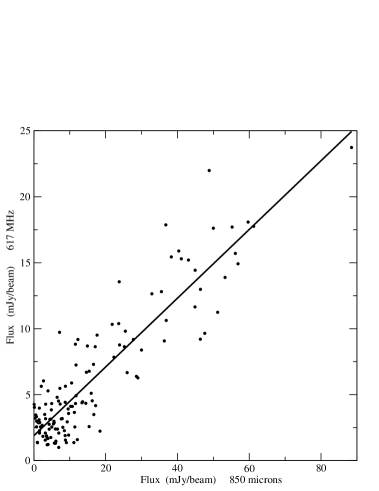
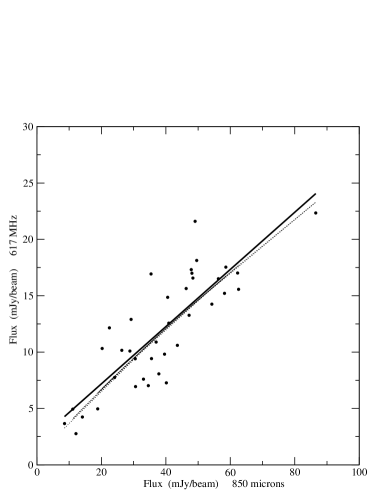
The similarities between the sub-mm and radio maps demonstrate that a correlation exists between the radio continuum and sub-mm radiation in NGC 5775. A more quantitative demonstration is shown in Fig. 7, where we have plotted the flux densities at 850 m against those at 617 MHz at identical independent positions for the entire disk and halo of NGC 5775. Fig. 8 shows the correlation for positions solely in the disk. It is clear that sub-mm and radio emission are highly correlated. The slope of the linear-least squares fit to the entire disk and halo is 0.260.01 (Fig. 7), while for the disk alone the slope is (Fig. 8). The corresponding values for the north-eastern and south-western halos are and respectively (Fig. 9). Within the errors, the slopes for each section of the galaxy are similar, suggesting that the reason behind this correlation for different parts of the galaxy must also be similar. This result also suggests that the discrete kpc disk halo features originate in the disk of the galaxy. The fainter dotted line in Fig. 8 is the best fit of a power law regression, which is similar to the linear regression. The slope of the power law is . This value is very close to one, indicating the relationship is approximately linear. For comparison, the slopes typically found for the radio-FIR correlation are between 1.1 and 1.3.
The sub-mm observations map the cold dust, which emits predominantly longward of a couple of hundred m (Sauvage 1997). The detection of cold dust was not a surprising finding since dust-to-gas mass ratio of external galaxies derived from IRAS were approximately 10 times lower than in our galaxy (cf. Devereux & Young 1990). The IRAS observations are largely sensitive to warm dust and helped establish the tight and universal correlation between FIR and radio continuum emission. While this correlation is attributed to the dependence of both emission processes on recent star formation activity, the 617 MHz/850 m correlation demonstrated here is unlikely to be the result of a common energy source for the emission at the two wavebands. The cold dust in galaxies is heated not by massive ionizing or intermediate mass non-ionizing stars, but possibly by the general interstellar radiation field (Hippelein et al. 2000). Also, the radio map at 617 MHz, is almost entirely due to non-thermal synchrotron radiation. From Condon (1992) we estimate the ratio of thermal flux density to total flux density at 617 MHz in NGC 5775 to be approximately 0.06 using a spectral index of 0.93 (Irwin et al. 1999). The ratio of the thermal component is approximately twice the above value at 1420 MHz.
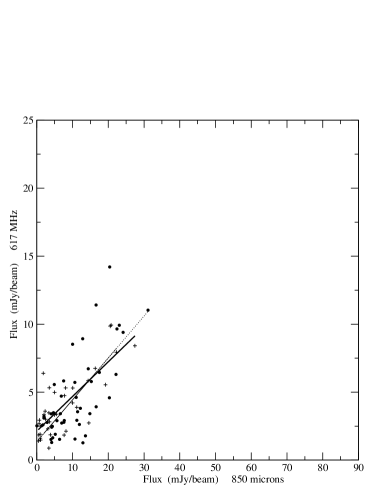
Further supporting evidence that the correlation is not due to a simple shared energy source, comes from the halo region of both maps. The overlay in Fig. 4 demonstrates that there is a spatial relation between the sub-mm and metre-wave radio emission in the halo region of the galaxy. This relation is more clearly shown in Fig. 9, which is similar to Fig. 7 except that only high-latitude emission ( 1.5 kpc) is shown. The circles represent positions located in the halo on the north-eastern side of the galaxy axis, while the plus signs mark positions in the south-western halo. In these regions there is no evidence of significant star formation. The link between the two types of emission must be due to another factor.
Our findings lead us to suggest that the well-known FIR/radio correlation might be one aspect of a more fundamental relationship. These results on NGC 5775 not only demonstrate a relationship between the two types of emission, namely thermal emission from cold dust and non-thermal emission from relativistic electrons, but could provide clues towards understanding the distributions and relationships between gas, dust and magnetic fields. Studying the more abundant cold dust component, which could contribute approximately 80 to 95% of the dust in normal spiral galaxies (Sievers et al. 1994), has revealed a correlation between the non-thermal radio and sub-mm emission in NGC 5775. This could indicate a wider and more important relationship than one based on recent star-formation activity alone.
Currently a model that can perhaps explain the correlation presented in this paper is the magnetic field-gas coupling model described by HBX to explain the relationship between the non-thermal and cold-dust emission in M31. In this model the cold dust and the non-thermal radio continuum emission are linked through the magnetic field coupled to the neutral gas which is mixed with the cold dust. Using this model, HBX could explain the slope of for the observed relationship between the non-thermal radio and cool dust emission in M31 (HBX). This slope is very close to our value of for NGC 5775.
An investigation of the magnetic field in NGC 5775 was conducted by Tüllmann et al. (2000). An analysis of polarized radio continuum emission at 1.49 and 4.86 GHz indicated that the magnetic field in the halo has a strong component that is aligned with radio continuum spurs and are in a direction perpendicular to the disk of NGC 5775. The magnetic fields extend to sufficient latitudes from the disk and could provide an explanation of the extra-planar features presented above at 850 m and 617 MHz. This supports the possibility that a magnetic field-gas coupling model may explain the cold dust non-thermal gas correlation we have found in NGC 5775.
It is interesting to note that NGC 5775 may be interacting with the nearby galaxy NGC 5774 (Lee et al. 2001), and enquire whether the dust which has been detected up to 5 kpc feeds the intergalactic medium. However, without an estimate of the the velocity of the dust we cannot be certain that these dust grains will escape NGC 5775’s gravitational well. However, a few of the high-latitude features appear to suggest that dust might be falling back towards the disk. This is interesting in light of observations by Lisenfeld et al. (2002) which show no dust in the halo of the dwarf galaxy NGC 1569. The mass difference between dwarf galaxies and normal spirals may account for the missing dust, if the dust escaped into the intergalactic medium.
5 Summary
We have presented maps of NGC 5775 at 850 m which are due to emission from cold dust and at 617 MHz where the emission is due to synchrotron emission from relativistic electrons. We detect dust at high-latitudes extending up to approximately 5 kpc, and spurs of non-thermal radio emission. The discrete high-latitude features originate in the disk of the galaxy. The non-thermal and sub-mm emission are correlated in the disk and as well as at high-latitudes. This correlation is unlikely to be due to the recent star formation activity in the galaxy, but possibly reflects a coupling of gas, dust and magnetic fields in the galaxy. This galaxy is the first one of an ongoing study that we are conducting on high-latitude emission from edge-on spiral galaxies. Other galaxies must be analyzed to determine whether the correlation observed in NGC 5775 is more widespread.
Acknowledgments
We would like to thank Jeroen Stil for creating the borg program, which assisted us in flagging GMRT data. We thank the staff of the GMRT that made these observations possible. GMRT is run by the National Centre for Radio Astrophysics of the Tata Institute of Fundamental Research. The JCMT is operated by the Joint Astronomy Centre on behalf of PPARC for the United Kingdom, the Netherlands Organisation for Scientific Research, and the National Research Council of Canada.
References
- [1] Alton P. B., Bianchi S., Rand R. J., Xilouris E. M., Davies J. I., Trewhella M., 1998, ApJL, 507, L125
- [2] Alton P. B., Davies J. I., Bianchi S., 1999, A&A, 343, 51
- [3] Beck R., Golla G., 1988, A&A, 191, L9
- [4] Bicay M. D., Helou G., 1990, ApJ, 362., 59
- [5] Brar R. S., Irwin J. A., 2002, in Seeing Through the Dust, ASP Conf. Proceedings 276
- [6] Condon J. J., 1992, ARA&A, 30, 575
- [7] Dahlem M., 1997, PASP, 109, 1298
- [8] de Jong T., Klein U., Wielebinski R., Wunderlich E., 1985, A&A, 147, L6
- [9] Devereux N. A., Young J. S., 1990, ApJ, 359, 42
- [10] Dumke M., Braine J., Krause M., Zylka R., Wielebinski R., Guelin M., 1997, A&A, 325, 124
- [11] Hoernes P., Berkhuijsen E. M., Xu C., 1998, A&A, 334, 57 (HBX)
- [12] Helou G., Soifer B. T., Rowan-Robinson M., 1985, ApJ, 298, L7
- [13] Hippelein H., Haas M., Lemke D., Stickel M., Tuffs R., Klaas U., Völk H. 2000, in Berkhuijsen E.M., Beck R., Walterbos R. A. M., eds, The interstellar medium in M31 and M33. Proceedings 232. WE-Heraeus Seminar, p. 81
- [14] Irwin J. A., 1994, ApJ, 429, 618
- [15] Irwin J. A., English J., Sorathia B., 1999, AJ, 117, 2102
- [16] Lee S.-W., Irwin J. A., Dettmar R.-J., Cunningham C. T., Golla G., Wang Q. D., 2001, A&A, 377, 759
- [17] Lisenfeld U., Israel F. P., Stil J. M., Sievers A., 2002, A&A, 382, 860
- [18] Neininger N., Dumke M., 1999, Proc. Natl. Acad. Sci., 96, 5360
- [19] Neininger N., Guélin M., García-Burillo S., Zylka R., Wielebinski R., 1996, A&A, 310, 725
- [20] Rieke G.H., 1978, ApJ, 226, 550
- [21] Sauvage M., 1997, in Mamon G. A., Thuan T. X., Van J. T. T., eds, Extragalactic Astronomy in the Infrared, Editions Frontieres, Paris, p. 179
- [22] Sievers A. W., Reuter H.-P., Haslam C. G. T., Kreysa E., Lemke R., 1994, A&A, 281, 681
- [23] Stevens J. A., Gear W. K., 2000, MNRAS, 312, L5
- [24] Swarup G., Ananthakrishnan S., Kapahi V.K., Rao A.P., Subrahmanya C.R., Kulkarni V.K., 1991, Current Science, 60, 95
- [25] Tüllmann R., Dettmar R.-J., Soida M., Urbanik M., Rossa J., 2000, A&A, 364, L36
- [26] van der Kruit P. C., 1971, A&A, 15, 110
- [27] van der Kruit P. C., 1973, A&A, 29, 263